Green Economy Journal Issue 58

Create successful ePaper yourself
Turn your PDF publications into a flip-book with our unique Google optimized e-Paper software.
G R E E N<br />
<strong>Economy</strong><br />
journal<br />
ISSUE <strong>58</strong> | 2023<br />
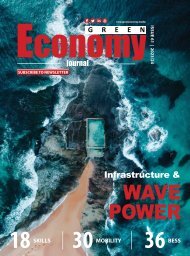
The highs & lows of<br />
HYDROGEN<br />
20<br />
COMMERCIAL<br />
AND<br />
INDUSTRIAL<br />
24<br />
BLOCKED<br />
SUPPLY<br />
CHAINS<br />
42 PART<br />
INFRASTRUCTURE<br />
DEVELOPMENT<br />
2
HELLO<br />
HELLO FUTURE<br />
Say Hello to world-leading self-charging innovation. Say hello to the all-new Toyota Hybrid range.<br />
With two power sources, the Toyota Hybrid System fuses an internal combustion engine’s<br />
high-speed power with the clean efficiency and low-speed torque of an electric motor that<br />
never needs to be plugged in. It’s what you want when you want it. Hello Future.<br />
BOOK A TEST DRIVE TODAY AT TOYOTA.CO.ZA
PUBLISHER’S NOTE<br />
Beyond emergency!<br />
As I write this note, commercial and industrial (C&I) energy<br />
customers around South Africa find themselves trapped between a<br />
dysfunctional utility and an industry hamstrung by rising equipment<br />
costs, a lack of competition as well as blocked supply chains.<br />
After years of slow uptake of hybrid solar PV and battery<br />
projects and the rapid uptake of diesel gensets, C&I customers are<br />
rushing for solutions to stem the financial bloodshed resulting from<br />
hours per day of running those gensets.<br />
EPCs are inundated with requests for rushed quotes while solar<br />
panels, batteries and certified inverters are in short supply with lead<br />
times ranging from two to six months.<br />
At the same time, costs are rising. Between profit taking, rising<br />
interest rates, rising cost of forex, the price of equipment goes<br />
up almost weekly. Prices can even change between order and<br />
delivery, resulting in higher markups by EPCs.<br />
Competitors are circling but barriers to entry are keeping them<br />
at bay. These include unfamiliar brands, fear of being first, local<br />
certification requirements and a lack of presence/support by<br />
suppliers in the country. Every electrician, builder and plumber<br />
is becoming an installer, with all range of experience levels, but<br />
closing the bigger deals remains challenging.<br />
Net effect, the industry is stymied. For now. But the midterm<br />
outlook is extremely good for the broad uptake of solar PV/battery<br />
hybrid systems, and this is very positive for overall grid capacity and<br />
stability.<br />
Onwards and upwards!<br />
Regards,<br />
Publisher<br />
G R E E N<br />
<strong>Economy</strong><br />
journal<br />
EDITOR:<br />
CO-PUBLISHERS:<br />
LAYOUT AND DESIGN:<br />
OFFICE ADMINISTRATOR:<br />
WEB, DIGITAL AND SOCIAL MEDIA:<br />
SALES:<br />
PRINTERS:<br />
GENERAL ENQUIRIES:<br />
ADVERTISING ENQUIRIES:<br />
Alexis Knipe<br />
alexis@greeneconomy.media<br />
Gordon Brown<br />
gordon@greeneconomy.media<br />
Alexis Knipe<br />
alexis@greeneconomy.media<br />
Danielle Solomons<br />
danielle@greeneconomy.media<br />
CDC Design<br />
Melanie Taylor<br />
Steven Mokopane<br />
Gerard Jeffcote<br />
Glenda Kulp<br />
Nadia Maritz<br />
Tanya Duthie<br />
Vania Reyneke<br />
FA Print<br />
info@greeneconomy.media<br />
alexis@greeneconomy.media<br />
REG NUMBER: 2005/003854/07<br />
VAT NUMBER: 4750243448<br />
PUBLICATION DATE: June 2023<br />
www.greeneconomy.media<br />
G R E E N<br />
<strong>Economy</strong><br />
journal<br />
CONTENTS<br />
4 NEWS AND SNIPPETS<br />
ENERGY<br />
8 Stand out from the decarbonisation crowd<br />
14 The highs & lows of hydrogen<br />
20 Commercial and industrial small-scale embedded generation<br />
24 How to navigate the headwinds in the renewable energy<br />
supply chain<br />
27 Unlocking the power of the sun<br />
29 Preparing the way for a solar PV plant<br />
30 Reducing the cost of wind turbine foundations<br />
31 Progress in private offtake market is leading towards a<br />
liberalised energy system<br />
35 It’s time to look in the mirror, says REVOV<br />
48 Energy materials research is driving changes<br />
MOBILITY<br />
18 Toyota fuel cell technology opens new horizons<br />
for sustainability<br />
32 Mineral supply constraints are looming<br />
36 The value of micromobility for African cities<br />
08<br />
32<br />
EDITOR’S NOTE<br />
Hydrogen demand is expected to grow globally from both<br />
incumbent markets as well as from new markets. This increase<br />
in hydrogen production and use is being driven by a growing desire<br />
to improve energy security and by decarbonisation efforts (page 14).<br />
To achieve reliable and cost-efficient energy supply, commercial<br />
and industrial consumers are looking for alternative sources of<br />
energy for their operations. However, careful consideration of all the<br />
tariff components is necessary to determine the economic business<br />
case of small-scale embedded generation (page 20).<br />
The renewable energy supply chain is under pressure, with<br />
massive consequences for project developers. Demand for<br />
equipment is surging for everything from wind turbines to solar<br />
PV modules and hydrogen electrolyzers – and the supply gaps are<br />
widening (page 24).<br />
The rapid increase in EV sales during the pandemic has tested the<br />
resilience of battery supply chains and Russia’s war in Ukraine further<br />
exacerbated the challenge. Prices of raw materials such as cobalt,<br />
lithium and nickel have surged (page 32).<br />
Enjoy this issue!<br />
Alexis Knipe<br />
Editor<br />
All Rights Reserved. No part of this publication may be reproduced or transmitted in any way or<br />
in any form without the prior written permission of the Publisher. The opinions expressed herein<br />
are not necessarily those of the Publisher or the Editor. All editorial and advertising contributions<br />
are accepted on the understanding that the contributor either owns or has obtained all necessary<br />
copyrights and permissions. The Publisher does not endorse any claims made in the publication<br />
by or on behalf of any organisations or products. Please address any concerns in this regard to<br />
the Publisher.<br />
WATER<br />
40 South Africa’s water update<br />
INFRASTRUCTURE<br />
42 Quo Vadis: infrastructure development. Part 2<br />
WASTE<br />
51 Waste not, want not by USE-IT<br />
52 Effective waste management<br />
READ REPORT<br />
THOUGHT [ECO]NOMY<br />
greeneconomy/report recycle<br />
key takeouts<br />
of the report<br />
40<br />
To access the full report in our Thought [ECO]nomy report boxes:<br />
Click on the READ REPORT wording or image in the box and you will<br />
gain access to the original report. Turn to the page numbers (example<br />
below) for key takeouts of the report.<br />
01 02 03<br />
key takeouts<br />
of the report<br />
key takeouts<br />
of the report<br />
2<br />
3
NEWS & SNIPPETS<br />
NEWS & SNIPPETS<br />
OF SA, GOVERNMENT AND<br />
KARPOWERSHIPS<br />
According to Rudi Dicks, head of the project management<br />
office in the Presidency and member of the National Energy Crisis<br />
Committee (NECOM), government is considering reducing the<br />
term for Karpowership contracts as an “emergency measure”.<br />
Dicks says contracts of potentially five to 10 years would be<br />
preferable to the initial term of 20 years.<br />
Despite being named as a preferred bidder in government’s<br />
RMIPPPP in 2021 to provide over 1 200MW of power at three of<br />
South African ports, Karpowership has drawn criticism over the<br />
cost of its 20-year contract along with its refusal of environmental<br />
authorisation for its three vessels at the Richards Bay, Ngqura and<br />
Saldanha Bay docks.<br />
NECOM has taken the view that a shorter-term period would<br />
have to be looked at, potentially between five and 10 years.<br />
By Andre van Wyk<br />
ESKOM’S WOES WORSEN<br />
Eskom’s financial losses and smothering debt levels are set to<br />
balloon, making it more difficult for the power utility to stem<br />
the tide of intensified blackouts across SA.<br />
Eskom made a financial loss of R21.2-billion during 2022/3. Eskom<br />
had budgeted for a R13.6-billion loss. Gross debt securities and<br />
borrowings (or debt levels) increased to R439.1-billion in 2022/3<br />
from R396.3-billion in 2021/2. The utility attributes the 11% increase<br />
in its debt levels to the impact of the weak rand.<br />
A broken business model<br />
Eskom’s net revenue grew to R259.2-billion in 2022/3, up from<br />
2021/2’s R247.6-billion. The utility cannot generate enough revenue<br />
from its electricity tariffs approved by Nersa. In 2022, an increase<br />
of 9.61% was granted to Eskom, lower than the 20.5% it asked for.<br />
During 2022/3, Eskom spent R21.36-billion on diesel purchases<br />
(more than double 2021/2).<br />
Municipalities owe billions<br />
Total invoiced municipal arrear debt increased to R<strong>58</strong>.5-billion at<br />
year-end, up from 2021/2’s R44.8-billion. A total of 61 municipalities<br />
has arrears debt of over R100-million each.<br />
Eskom’s sales volumes were 3.1% lower than budgeted and<br />
declined by 4.3% from 2021/2.<br />
During 2022/3, Eskom received R21.9-billion in equity support<br />
from government. Government has committed to taking over R254-<br />
billion of Eskom debt in the next three years.<br />
Daily Maverick<br />
WIND FARM FOR SIBANYE-STILLWATER<br />
AIIM consortium reached financial close on 89MW Castle Wind<br />
Farm to supply renewable energy to Sibanye-Stillwater’s mining<br />
operations via an Eskom wheeling agreement. The consortium<br />
consists of African Infrastructure Investment Managers (AIIM),<br />
African Clean Energy Developments (ACED) and Reatile Renewables.<br />
This milestone marks the effective date of the PPA and the<br />
commencement of construction. The energy will originate from<br />
Castle Wind Farm (Northern Cape) and will result in energy cost<br />
savings, increased energy security and decarbonisation benefits for<br />
Sibanye-Stillwater.<br />
This transaction will be the second private wind power wheeling<br />
project in SA to have reached financial close. Rand Merchant Bank,<br />
a division of FirstRand Bank Limited, is the sole-mandated lead<br />
arranger for the project.<br />
THE PRESIDENCY BUDGET VOTE 2023/4<br />
Delivered by President Ramaphosa<br />
Progress has been made in implementing measures outlined in<br />
the Energy Action Plan. The private sector can invest in electricity<br />
generation projects of any size. More than 100 projects are at<br />
various stages of development, representing over 10 000MW of<br />
new generation capacity and over R200-billion investment. The<br />
exponential growth of private sector investment in electricity<br />
generation is proof that this reform is having a major impact.<br />
The procurement of new capacity has been accelerated. Three<br />
projects from the risk mitigation programme have entered<br />
construction, with a further five projects expected to reach financial<br />
close during this quarter. Project agreements have been signed<br />
for 25 preferred bidders from Bid Window 5 and 6 amounting to<br />
approximately 2 800MW, of which 784MW is already in construction.<br />
In the coming months, the procurement of more than 10 000MW<br />
of additional generation capacity will be initiated. Municipalities can<br />
procure power independently. Several municipalities have embarked<br />
on processes to procure additional power of up to 1 500MW.<br />
Government is driving progress on the unbundling of Eskom<br />
into separate entities for generation, transmission and distribution.<br />
Significant progress has been made towards the establishment of<br />
the national transmission company as an independent subsidiary<br />
of Eskom.<br />
Government is pursuing sweeping legislative reform and has<br />
introduced the Electricity Regulation Amendment Bill, which<br />
seeks to establish a competitive electricity market and support the<br />
unbundling of Eskom.<br />
Another key piece of legislation, the Energy Security Bill, will<br />
soon be introduced to streamline the regulatory framework<br />
and accelerate construction of renewable energy projects. Tax<br />
incentives have been introduced to support the rollout of rooftop<br />
solar for households.<br />
Jobs must be protected in sectors of the economy that must<br />
decarbonise to remain competitive.<br />
Where it may be necessary to delay the decommissioning<br />
coal-fired power stations temporarily to address electricity supply<br />
shortfall, any decision will be informed by a detailed technical<br />
assessment, the timeframe in which new generation capacity is<br />
expected and the impact on SA’s decarbonisation trajectory.<br />
Trade, Industry and Competition recently announced the<br />
establishment of an energy resilience fund of R1.3-billion.<br />
The value of projects currently in construction is over R300-billion,<br />
including energy, water infrastructure and rural roads projects.<br />
The pipeline of green hydrogen projects with a value of over<br />
R300-billion is significant. Among these projects is the Boegoebaai<br />
<strong>Green</strong> Hydrogen (Northern Cape) with a potential to create<br />
thousands of jobs.<br />
Two years ago, the Blue Drop and <strong>Green</strong> Drop water quality<br />
monitoring systems were administered to monitor SA’s water<br />
quality. This will enable stronger intervention in municipalities<br />
that fail to meet the minimum standards for water service delivery.<br />
Last year’s <strong>Green</strong> Drop report points to serious challenges in<br />
municipalities when it comes to managing water resources. The<br />
challenges in water provision highlight the broader challenge of<br />
dysfunctionality in many municipalities.<br />
NERSA: GREEN LIGHT FOR ESKOM<br />
Nersa has announced its approval for Eskom’s plan to purchase 344.5MW new generation<br />
capacity. Eskom can procure 75MW of new generation capacity from solar at Lethabo<br />
Power Station (Free State) and 19.5MW (solar) at Sere Wind Farm (Western Cape) as well<br />
as 100MW (solar) and a 150MW battery energy storage system at Komati Power Station<br />
in Mpumulanga.<br />
The generation capacity must be procured by Eskom through tendering procedures that<br />
are fair and cost-effective. Nersa has approved the national free basic electricity rate of<br />
172.76c/kWh for 2023/4, effective from July.<br />
Business Report<br />
4<br />
5
NEWS & SNIPPETS<br />
NEWS & SNIPPETS<br />
ENERGY BLOCK EXEMPTIONS<br />
The Minister of Trade, Industry and Competition has published<br />
the Energy Users and Energy Suppliers Block Exemptions. These<br />
exemptions facilitate collaboration between companies to address<br />
electricity supply constraints, by allowing them to engage in<br />
activities normally prohibited under the Competition Act.<br />
“These exemptions will enable energy suppliers and energy users<br />
to increase and optimise supply capacity, reduce the cost of energy<br />
or improve the efficiency of energy supply, and secure backup or<br />
alternative energy supply in order to minimise the effects of the<br />
current electricity supply constraints,” Minister Ebrahim Patel said.<br />
“Reforms in the competition law effected in 2019 provides for more<br />
flexibility when circumstances warrant it. The block-exemptions have<br />
been used during the pandemic and in crises such as the July 2021<br />
unrest, to enable competitors to cooperate to address shortages<br />
of stock or facilities. This will now also be available to companies to<br />
address the energy challenges,” he added.<br />
6<br />
SOLAR SITE PROTECTS TREES<br />
Renewable energy company, Scatec, was involved in a massive<br />
Quiver tree planting and re-planting operation at their Kenhardt<br />
site in the Northern Cape.<br />
This started after they were awarded the project under the<br />
RMIPPPP. The site is currently under construction – and once it<br />
reaches completion will have a total solar capacity of 540MW,<br />
battery storage capacity of 225MW/1, 140MWh, and provide<br />
150MW of dispatchable renewable power under a 20-year Power<br />
Purchase Agreement.<br />
With Quiver trees being on the national flora red list, Scatec’s<br />
main objective was to execute an operation to preserve the Quiver<br />
trees on site – and ensure an increase of the plant species in the<br />
local habitat.<br />
Scatec had a huge role to play to ensure that they preserve the<br />
branching succulent plants in the Kenhardt area.<br />
The Quiver tree is known to grow slowly and is habitat specific<br />
– found in areas with extreme weather conditions. Climate change<br />
has not made things easier for Quiver trees, as they are struggling<br />
to grow as abundantly as they did in years gone by.<br />
“Our Environmental license in the area gave us a very clear<br />
mandate to protect these trees while we work. Replanting these<br />
trees was never going to be an easy process. Scatec partnered<br />
with a specialist team that helped them navigate the process,” says<br />
Scatec’s sub-Saharan Africa executive VP Jan Fourie.<br />
For every tree that was relocated, an additional ten Quiver Trees<br />
had to be planted. The Quiver tree was not an easy find. A nursery<br />
that stocked the special trees was in the Western Cape (where the<br />
Scatec team had to apply for a permit to transport the Quiver trees<br />
over the provincial border).<br />
To date, the Quiver trees are growing into these beautiful and<br />
succulent trees. The pictures do not do them justice, you just<br />
must see them in real life. “When you are next in the Kenhardt<br />
area, be sure to drive by the Scatec site to witness the beauty and<br />
appreciate the effort that the team put into replanting the Quiver<br />
trees to conserve them,” says Fourie.<br />
SAWEA CALLS FOR GRID OPTIMISATION<br />
If SA is to add the much-needed 5GW of new capacity to the<br />
grid each year, solutions are needed to optimise the existing<br />
transmission infrastructure capacity. The employment of<br />
multiple improved energy mechanisms is required, if another<br />
failed REIPPP bid window is to be avoided, says SAWEA.<br />
“We have been engaged in efforts to tackle the issues regarding<br />
access to the grid and the unlocking of grid capacity since early<br />
2022, whilst urging key stakeholders to prioritise the transmission<br />
build. However, more than a year later, having reviewed the 2022/3<br />
Grid Connection Capacity Assessment (GCCA) report, our industry<br />
is faced with the reality that the areas of highest wind resource<br />
potential in the country are either already depleted or close to<br />
being depleted in terms of available grid capacity – a sobering<br />
reality that was already known before the last public procurement<br />
bidding round,” says Niveshen Govender, Chief Executive Officer<br />
of SAWEA.<br />
“Following the Bid Window 6 upset, when not a single wind<br />
project advanced to preferred-bidder status, owing to grid<br />
constraints in the Cape provinces, it has become increasingly<br />
important to understand the methods that were used to allocate<br />
the grid capacity ensuring fair and transparent processes, so that<br />
we can ensure access for both private and public procurement,”<br />
added Govender.<br />
The grid allocation rules need to be finalised to provide clarity<br />
to the market and ensure further delays in allocating capacity<br />
to projects are reduced. Other short-term measures include the<br />
addition of the Battery Energy Storage Capacity Bid Window, that<br />
will add a capacity totalling 1 230MW in two bid windows this<br />
year; and the exploration of co-locating renewable technologies<br />
across wind and solar.<br />
By pairing power plants, a single transmission connection<br />
point can be used more effectively, matching renewable energy<br />
generation profiles with energy demand. “Beyond the economics,<br />
international examples of energy planning demonstrate that<br />
co-location is a viable consideration if we are to optimise the grid.<br />
This is simply because wind production peaks in the late afternoon<br />
and continues throughout the night, which compliments solar<br />
production during the day, hence we can expect that developers<br />
will seriously consider this, especially as it offers feasible cost<br />
reductions that will benefit the country,” concluded Govender.<br />
Kagnas Wind Farm.<br />
FORESTRY, FISHERIES AND ENVIRONMENT BUDGET VOTE 2023/4<br />
Delivered by Minister Creecy<br />
Connecting Strength<br />
PV mounting systems<br />
easy to plan & install<br />
• Installation on all pitched and flat<br />
roofs<br />
• Simplified design and documentation<br />
with digital tools<br />
Plan now<br />
base.k2-systems.com<br />
Waste management<br />
The Extended Producer Responsibility schemes have begun diverting waste from<br />
landfill sites. DFFE’s Recycling Enterprise Support Programme has supported<br />
56 start-ups within the sector providing over R300-million in financial support,<br />
creating 1 5<strong>58</strong> jobs and diverting over 200 000 tons of waste from landfills.<br />
Marine living resources<br />
DFFE intends to finalise the allocation of 15-year fishing rights to small-scale fishing<br />
communities in the Western Cape by October 2023. This will enable a further 3 500<br />
declared traditional small-scale fishers to participate in the ocean’s economy.<br />
Climate change and air quality<br />
SA’s mitigation and adaptation architecture is at an advanced stage. Cabinet has<br />
approved a framework to determine emissions allocation to industrial sectors for<br />
the 2023-2027 mandatory commitment period. DFFE is developing carbon budget<br />
regulations that will address the processing of mitigation plans to be submitted<br />
by industry. Besides assisting 44 district municipalities, DFFE is working with nine<br />
provinces, to review their existing climate change plans to align with the draft<br />
Climate Change Bill.<br />
There is a project pipeline of 9 789MW for renewable energy applications<br />
[2 899MW: solar, 6 890MW: wind]. These include battery energy storage systems<br />
and associated transmission and distribution infrastructure.<br />
Decision-making timeframes have been reduced from 107 to 57 days.<br />
Grid capacity is a national priority to solve. DFFE is considering delays in<br />
decommissioning aging coal-fired power stations.<br />
All innovations:<br />
Intersolar Munich<br />
A6.190 / A6.280
ENERGY<br />
ENERGY<br />
Decarbonisation is<br />
not transactional:<br />
it’s a long-term effort.<br />
Stand out from the<br />
DECARBONISATION CROWD<br />
With the European Union aiming to cut emissions in half by 2030, the industrial sector is facing a<br />
strong push to decarbonise. In this €350-billion market, there’s a wealth of value on the table.<br />
BY KEARNEY CONSULTING<br />
Climate change caused more than $170-billion in damages in<br />
2021 alone. To avoid a full-scale climate catastrophe (and the<br />
associated costs), one of the biggest challenges is transitioning<br />
to a climate-neutral economy. The industrial sector has a central<br />
role to play in achieving this goal. Driven by intrinsic motivators<br />
8<br />
along with regulations societal pressure and market dynamics,<br />
industrial companies are pushing to decarbonise. In fact, their<br />
decarbonisation efforts – and the results across all emission scopes<br />
will be a prerequisite if they hope to stay competitive. In this article,<br />
we tell you how to stand out from the decarbonisation crowd.<br />
When considering direct and indirect owned emissions (scope 1 and<br />
scope 2), the challenge is mostly an energy-related matter for many<br />
industrial companies. For others, decarbonisation affects the core<br />
product itself. Two examples:<br />
Sugar industry. Most CO2 emissions are energy related. Natural<br />
gas is used in combined heat and power plants for sugar extraction,<br />
crystallisation and the drying of beet pulp. In addition to improving<br />
energy efficiency, decarbonisation opportunities include the trade-off<br />
of used natural gas with alternatives such as biogas or hydrogen and<br />
electrification through large-capacity heat pumps or electric boilers.<br />
Cement industry. CO2 emissions are rooted in the core product. About<br />
two-thirds of emissions in the production process are the result of the<br />
underlying calcination reaction. Up until now, alternative production<br />
technologies have hardly yielded many significant results; emission<br />
reductions have mostly been the result of operational improvements,<br />
such as higher plant utilisation. However, although the sector has<br />
been exploring innovative technologies, such as clinker substitutes.<br />
This dichotomy has implications for the knowledge and resources<br />
that industrial companies can deploy for decarbonisation. Many<br />
companies acknowledge they have neither the knowledge nor the<br />
resources required to get – and keep – the ball rolling. And that’s fair.<br />
The decarbonisation challenge is complex and multifaceted. It ranges<br />
from creating the required internal data transparency and monitoring<br />
an array of regulatory developments, to the realisation of technical<br />
solutions over many years and carefully reporting the impact of<br />
decarbonisation efforts.<br />
There is much to learn and a lot to do – so much so that companies<br />
will have to consider a “make versus buy” decision. On one hand, the<br />
companies for which decarbonisation is mostly an energy-related<br />
matter tend to tilt toward the “buy” side and investigate partnering.<br />
They actively look for external suppliers to support them in their<br />
decarbonisation journey, provided that the suppliers bring expertise<br />
that is not readily available in-house for less than it would cost to<br />
build those capabilities from scratch.<br />
On the other hand, companies where CO2 emissions are rooted in<br />
the core product or where energy costs are a top driver for their total<br />
cost, such as a process industry, tend to tilt more toward the “make”<br />
side of the spectrum. For them, it makes sense to build significant<br />
decarbonisation capabilities in-house since it is more important to their<br />
business operation.<br />
Of course, this “make versus buy” decision is not purely binary.<br />
Decarbonisation-related activities are plentiful. A “make versus buy”<br />
decision for each will result in an equilibrium that is probably in<br />
between the two extremes (see figure 1).<br />
The decarbonisation services supply market is still in an emerging<br />
state, but it is evolving quickly. Many players in adjacent markets, such<br />
as utilities, real estate managers and energy efficiency companies are<br />
figuring out whether – and how – they will target this market. At the<br />
same time, many innovative start-ups want to claim their slice of the<br />
pie by entering the market with innovative technology solutions.<br />
In summary, industrial companies are calling for support in their<br />
decarbonisation journeys while the supply market for such support still<br />
boasts significant untapped value. Therefore, if you want a winning,<br />
profitable model in this attractive market, now is the time.<br />
SET UP FOR SUCCESS<br />
The decarbonisation journey is a multi-year undertaking that requires<br />
companies to be highly dynamic considering three trends:<br />
• Continuous innovation pushes the available technical solutions.<br />
• The company itself is also likely to change in terms of the site<br />
footprint, product portfolio and strategic priorities.<br />
• Applicable regulations are rapidly evolving.<br />
Moreover, this multi-year journey requires a plethora of specific<br />
capabilities, including a sustainability strategy, carbon accounting,<br />
technical solution implementation, investment financing, impact<br />
monitoring and verification, compliance management as well as<br />
Kearney Analysis<br />
Figure 1: Companies will need to decide whether to make or buy their<br />
decarbonisation solutions.<br />
9
ENERGY<br />
Decarbonisation is generally<br />
important but specifically different.<br />
reporting. As mentioned, industrial companies often choose to<br />
partner with specialist suppliers on at least some of these specific<br />
decarbonisation capabilities.<br />
Managing these partnerships and the associated interactions<br />
requires significant effort. While the large industrial companies often<br />
have experience in managing complex partnerships and projects,<br />
small and medium-size companies usually don’t. This implies a<br />
significant decarbonisation execution risk. To mitigate the execution<br />
risk, these companies look to simplify their interfaces with the<br />
decarbonisation service provider. Enter decarbonisation-as-a-service<br />
providers, which will offer a single interface to the decarbonisation<br />
services market.<br />
From our work in this decarbonisation services space, we see three<br />
emerging business model archetypes (see figure 2):<br />
• One Stop Shop. Providing all decarbonisation capabilities in an<br />
integrated way.<br />
• Integrator. Blending supply market capabilities in a single<br />
interface to customers.<br />
• Specialists. Offering spot capabilities with deep specialisation.<br />
These are clear-cut archetypes. However, many companies will<br />
pivot, transition or expand into this space. Therefore, we expect to<br />
see more hybrid business models in the market. In such a model, a<br />
decarbonisation services company will opportunistically develop<br />
and perform some specialist capabilities while integrating others<br />
via subcontracting. This integration can happen either in a<br />
decarbonisation-as-a-service model or via a structured ecosystem<br />
of specialists. Regardless of the chosen service model, there are<br />
four common success factors:<br />
• Nurturing long-term client relationships. Decarbonisation is<br />
not transactional: it’s a long-term effort. Suppliers that are willing<br />
to commit to the journey will prove more successful.<br />
• Managing complex projects with multifarious stakeholders.<br />
Decarbonisation touches many aspects and relative functions<br />
at industrial companies, including commercial, operations,<br />
finance and legal.<br />
• Knowledge and innovation. Decarbonisation is a field in full<br />
evolution. Suppliers must stay on top of new trends, regulation<br />
and technologies.<br />
• Customer centricity. Decarbonisation is generally important<br />
but specifically different. Suppliers should seek positive network<br />
effects among their customer base, though always respect the<br />
specificity of their customers’ context.<br />
Kearney Analysis<br />
Decarbonisation-as-a-service<br />
Figure 2. Three business model archetypes are emerging in the decarbonisation services market.<br />
*Authors: Horst Dringenberg, Partner, Maria de Kleijn, Partner<br />
and Thomas Vyncke, Founder, CARBON2ZERO. The authors<br />
thank Maximilian Hermann, Thomas Peinsipp, Bernhard Pribyl-<br />
Kranewitter, Annika Schmitz and Leonhardt Viebach for their<br />
valuable contributions to this article.<br />
10
Combo<br />
All-Inclusive Combos, Including Awareness, Facilitation, and Internal Auditing Training.<br />
Course Topic Duration Cost<br />
(excl. VAT)<br />
ISO 9001:2015<br />
ISO 45001:2018<br />
ISO 14001:2015<br />
IMS<br />
9001 /14001 /45001<br />
Quality Management<br />
Systems<br />
Occupation Health &<br />
Safety Management<br />
Systems<br />
Environmental<br />
Management Systems<br />
Integrated Management<br />
Systems<br />
Date<br />
5 days R 9 950 8 - 12 May 2023<br />
5 days R 9 950 15 - 19 May 2023<br />
5 days R 9 950 22 - 26 May 2023<br />
5 days R 9 950 29 - 2 Jun 2023<br />
Virtual<br />
Learn from Anywhere with Our Interactive Virtual Instructor-Led Sessions<br />
Course Topic Duration Cost<br />
(excl. VAT)<br />
IATF 16949<br />
Awareness<br />
IATF 16949<br />
Facilitation<br />
IATF 16949 Internal<br />
Auditor<br />
FSSC 22000<br />
Awareness<br />
FSSC 22000<br />
Facilitation<br />
FSSC 22000<br />
Internal Auditor<br />
R638 of 2018<br />
Take Your Skills to the Next Level with DQS<br />
Academy’s May 2023 Training Specials<br />
Automotive Industry<br />
Specifications For<br />
Quality Standards<br />
Food Safety<br />
Management Systems<br />
Food Safety and<br />
Hygiene Practices<br />
Date<br />
1 day R 1 914 2 May 2023<br />
3 days R 4 914 03 - 05 May 2023<br />
5 days R 8 575 22 - 26 May 2023<br />
1 day R 1 914 8 May 2023<br />
3 days R 4 914 9 - 11 May 2023<br />
5 days R 8 575 22 - 26 May 2023<br />
1 Day R 1 650 15 May 2023<br />
ISO 31000 Risk Management 3 Days R 5 990 23 - 25 May 2023<br />
Virtual Continued...<br />
Course Topic Duration Cost<br />
(excl. VAT)<br />
ISO 37001 -<br />
Awareness<br />
ISO 37001 -<br />
Facilitation<br />
ISO 55001 –<br />
Introduction &<br />
Implementation<br />
Date<br />
Anti-Bribery 1 Day R 2 125 15 May 2023<br />
3 Days R 5 950 16 - 18 May 2023<br />
Asset Management 4 Days R 12 250 15 - 18 May 2023<br />
Classroom<br />
Experience Hands-On Learning with Our Expert Instructors<br />
• Minimum 8 Participants Required<br />
• Location: Randburg, Johannesburg<br />
Course Topic Duration Cost<br />
(excl. VAT)<br />
FSS 220001 v5.1 -<br />
Lead Auditor<br />
ISO 27001 -<br />
Awareness<br />
ISO 27001 -<br />
Facilitation<br />
ISO 27001 -<br />
Lead Implementer<br />
IMS -<br />
Awareness &<br />
Implementation<br />
IMS -<br />
Internal Auditor<br />
Date<br />
Food Safety System 5 days R 14 500 29 - 02 June<br />
2023<br />
Information Security<br />
Management<br />
Systems<br />
Integrated Management<br />
Systems<br />
2 days R 7 250 08 - 09 May<br />
2023<br />
4 days R 9 100 15 – 18 May<br />
2023<br />
5 days R 17 500 15 – 19 May<br />
2023<br />
3 Days R 7 020 02 - 04 May<br />
2023<br />
5 Days R 12 250 22 - 26 May<br />
2023<br />
ISO31000 Risk Management 4 Days R 6 990 Starting 02 May<br />
2023<br />
Occupational<br />
Certificate:<br />
Occupational Health<br />
& Safety Practitioner<br />
NQF Level 5<br />
www.dqsacademy.co.za<br />
+27 (0)11 787 0102<br />
academy.sa@dqs.de<br />
Occupational Health &<br />
Safety<br />
18 Months R 45 653 01 - 04 May<br />
2023<br />
Simply<br />
leveraging<br />
Quality
ENERGY<br />
ENERGY<br />
IDTechEx<br />
COMMERCIALISED AEL SYSTEMS EFFICIENCY<br />
COMMERCIALISED PEMEL SYSTEMS EFFICIENCY<br />
The highs & lows of<br />
HYDROGEN<br />
While previous periods of hype for the hydrogen economy have waned, significant capital, both<br />
public and private, is now being spent on developing water electrolysis systems to produce<br />
green hydrogen.<br />
BY IDTechEx<br />
Hydrogen atom<br />
Sandia National Laboraties<br />
Alkaline electrolyzers have long been used for industrial<br />
applications. They are characterised by their low-capital costs<br />
and long lifetimes. PEM electrolyzers are at an earlier stage<br />
of commercialisation but are set to gain market share. They are<br />
characterised by higher-power densities, output hydrogen pressures<br />
and faster response times than alkaline systems. This makes them<br />
better suited to utilising renewable power. SOELs are the youngest<br />
electrolyzer technology. Operating at elevated temperatures above<br />
700°C, they offer higher system efficiencies but are expensive,<br />
can struggle with dynamic operation and improvements will be<br />
necessary. Nevertheless, their higher efficiencies can play a role in<br />
decreasing the levelised cost of the hydrogen while they also hold<br />
IDTechEX<br />
promise for producing syngas through the combined electrolysis of<br />
H2O and CO2.<br />
Key metrics for assessing the performance of an electrolyzer system<br />
include efficiency, capital cost, response time and dynamic range,<br />
hydrogen purity and pressure, lifetime and footprint. Ultimately,<br />
one of the most important parameters is likely to be levelised cost<br />
of hydrogen.<br />
Hydrogen demand is expected to grow globally from both<br />
incumbent markets (refining and ammonia production) as<br />
well as from new markets such as in methanol, green steel<br />
and transport applications. This increase in hydrogen production<br />
and use is being driven by a growing desire to improve energy<br />
security and by decarbonisation efforts. However, the hydrogen<br />
produced must itself be low carbon.<br />
What is green hydrogen?<br />
<strong>Green</strong> hydrogen refers to the splitting of water into hydrogen and<br />
oxygen via electrolysis in an electrolyzer. If renewable electricity<br />
is used to power the electrolyzer then the hydrogen produced is<br />
green hydrogen. <strong>Green</strong> hydrogen will have lower carbon emissions<br />
associated with it than the hydrogen being produced today, most of<br />
which comes from steam methane reformation or coal gasification.<br />
HYDROGEN MARKETS<br />
Hydrogen offers a route to decarbonising hydrogen production,<br />
in turn various hard-to-abate sectors, such as steel manufacturing,<br />
methanol production and certain modes of transport such as<br />
heavy-duty vehicles, shipping or aviation. The primary end-uses for<br />
hydrogen are in refining activities and ammonia production. These<br />
are forecast to remain the key uses in the medium term.<br />
Hydrogen offers a route to greater energy security by allowing<br />
local production, and a reduction in their use via their replacement<br />
of natural gas and coal for industries including steel, methanol,<br />
construction and chemicals production. This is topical given the<br />
volatility in natural gas prices and supply.<br />
<strong>Green</strong> hydrogen accounted for
ENERGY<br />
ENERGY<br />
IDTechEx<br />
Can hydrogen be COST COMPETITIVE?<br />
The clean hydrogen market is poised for growth, driven by decarbonisation efforts and concerns around energy<br />
security. Several ambitious roadmaps are being set out by different governments.<br />
BY IDTechEx<br />
The key challenge for green and electrolytic hydrogen is cost.<br />
<strong>Green</strong> hydrogen is more expensive than grey, black and blue<br />
hydrogen due to the relatively low cost of natural gas and low<br />
energy use for hydrogen production. Hydrogen’s long-term cost<br />
competitiveness is debatable. The high electricity consumption<br />
and cost limit the widespread adoption of green or electrolytic<br />
hydrogen. The water electrolyzer market is expected grow to over<br />
US$120-billion by 2033.<br />
help strengthen the case for green hydrogen. However, this also<br />
highlights the need to utilise variable power sources, necessitating<br />
additional energy storage systems to smooth out the power supply<br />
or an electrolyzer system capable of operational flexibility.<br />
Innovations in electrolyzer systems have a role to play. For<br />
example, new electrolyzer cell designs that separate gas directly in<br />
the cell could improve the dynamic operability of alkaline systems.<br />
Having an electrolyzer system capable and safe to operate at partial<br />
and variable loads will likely be key to the widespread success of<br />
green hydrogen.<br />
Order the report GREEN HYDROGEN PRODUCTION |<br />
ELECTROLYZER MARKETS 2023-2033 | IDTechEx | [January 2023]<br />
Socio-economic development<br />
• Contribute towards South Africa’s emission reduction goals.<br />
• Focus on decarbonising industrial sectors.<br />
• Ensure integration of renewable energy.<br />
• Incorporate non-financial criteria in procurement processes.<br />
• Develop skills development and job creation within sector.<br />
Local industrial capability and participation<br />
• Develop skills and achieve localised industrialisation.<br />
• Invest and implement R&D programmes.<br />
• Understand the potential for industrialisation.<br />
• Create partnerships.<br />
• Drive the identified skills action plan.<br />
Consider the need and role of a Just Transition<br />
• Analyse and plan for a Just Transition.<br />
• Quantify the commercial and economic impact and sustainability of<br />
industrial sectors.<br />
• Ensure appropriate skills development programmes.<br />
GREEN HYDROGEN COMMERCIALISATION STRATEGY FOR<br />
SOUTH AFRICA | Final report | [November 2022]<br />
Newly developed catalyst that recycles greenhouse gases into ingredients<br />
that can be used in fuel, hydrogen gas and other chemicals.<br />
Cafer T. Yavuz, Kaist<br />
Tyler Mefford and Andrew Akbashev/Stanford University<br />
Estimates of green hydrogen costs under different electrolyzer capital and<br />
operational cost scenarios.<br />
A reduction in the capital cost of electrolyzer systems will help<br />
to bring down the levelised cost of hydrogen. The industry expects<br />
capex to come down as manufacturing capacity increases and<br />
capabilities improve through greater levels of automation. The more<br />
efficient a system is, the lower the energy consumption. Solid oxide<br />
electrolyzers are the most efficient type and can be improved further<br />
if waste heat can be utilised. Other key performance metrics for<br />
electrolyzer systems include operating lifetime, output pressure and<br />
purity, current and power density, start-up times, dynamic range and<br />
minimum load levels.<br />
The cost of electricity prices needs to drop. Further reductions<br />
in the levelised cost of energy for solar and onshore wind would<br />
This animation combines images of a tiny, plate-like catalyst particle as it<br />
carries out a reaction that splits water and generates oxygen gas – part of a<br />
clean, sustainable process for producing hydrogen fuel.<br />
COMMERCIALISATION<br />
STRATEGY FOR SA<br />
The <strong>Green</strong> Hydrogen Commercialisation Strategy builds on the<br />
strong foundation of the work undertaken by the Department of<br />
Science and Innovation with respect to its HySA programme and<br />
the publication of the Hydrogen Society Roadmap.<br />
SA HYDROGEN STRATEGIC VISION.<br />
Developing a globally competitive, inclusive and low-carbon<br />
economy by harnessing South Africa’s entrepreneurial<br />
spirit, industrial strength and natural endowments.<br />
STRATEGIC OBJECTIVES<br />
Export markets<br />
• Secure long-term global market share and trade position.<br />
• Strategically position SA as a preferred provider to key markets.<br />
• Secure global market and national procurement programmes.<br />
• Expedite an export pilot project.<br />
• Progress international strategy.<br />
Domestic markets<br />
• Introduce supportive policies and a regulatory framework that<br />
aids price parity to increase domestic demand.<br />
• Support R&D, specifically on heavy-duty fuel cell vehicles.<br />
• Show feasibility of hydrogen in hard-to-abate sectors.<br />
Investment and finance<br />
• Secure strong inflow of FDI and outflow of hydrogen exports.<br />
• Establish a regulatory and market framework.<br />
• Define a key set of “catalytic” infrastructure projects.<br />
• Define government role and financial investment.<br />
• Expedite private sector investment.<br />
IDTechEx<br />
FUEL FLEXIBILITY<br />
paves path to HYDROGEN ECONOMY<br />
Fuel cells could play a role in the future of power generation, enabling the transition from hydrocarbon fuels to<br />
zero-emission fuels. It could be foolish to expect that an imminent abundant supply of hydrogen will fulfil all<br />
demand soon, presenting an opportunity for the fuel agnostic, SOFC.<br />
The fuel flexibility of solid oxide fuel cells (SOFC) offers a<br />
competitive advantage over the currently dominant proton<br />
exchange membrane fuel cell (PEMFC), which is limited to<br />
operating on hydrogen.<br />
While PEMFCs can only run on hydrogen, SOFCs run on multiple<br />
fuels such as hydrogen, LNG, biogas, methanol, ammonia, e-fuels<br />
and more. Liquefied natural gas (LNG) is the most deployed fuel in<br />
many applications, but it is not a long-term low-carbon solution due to<br />
methane slip and energy-intensive cooling and re-gassing processes.<br />
The utilisation of methane (CH4) produces both CO and CO2, while<br />
using methanol removes the emission of CO. However, reduction in<br />
An overview of the main fuel choices for solid oxide fuel cells, segmented by<br />
carbon emissions.<br />
emissions such as sulfur oxides, nitrous oxides and organics can still<br />
be achieved with respect to coal-fuelled plants. Several fuels exist in<br />
the zero/low carbon emission sector, including hydrogen, ammonia<br />
and e-fuels.<br />
The key issue with hydrogen is its low volumetric energy density<br />
and storage temperatures of -263°C, which is intensive to reach and<br />
maintain. Ammonia does not need carbon capture but requires new<br />
bunker infrastructure and is highly toxic in a spillage.<br />
<strong>Green</strong> ammonia is a derivative of green hydrogen, so an abundance<br />
of green hydrogen must exist first. A by-product of methane is<br />
carbon, meaning carbon capture is required for zero emissions, and<br />
this can be problematic due to added cost and complexity. Methane<br />
is the primary ingredient of LNG, the most deployed alternative fuel<br />
with decades of infrastructure.<br />
Methane is also susceptible to methane slip (boil-off methane),<br />
a powerful greenhouse gas, while “e-methane” relies on carbon<br />
predominantly from industrial sources, which must ultimately be<br />
phased out.<br />
Both ammonia and methane are widely transported by the sea<br />
today. In contrast, hydrogen is not. At the same time, the former is<br />
preferred over the latter due to the lack of emissions produced when<br />
using ammonia in a SOFC.<br />
In a future centred around the hyped hydrogen economy, PEMFCs<br />
are expected to dominate the fuel cell market. However, SOFCs offer<br />
interesting opportunities: their fuel cell flexibility, namely the ability<br />
to operate on the fuel choices for both today and tomorrow, sees<br />
SOFCs being positioned as a technology to enable a transition in<br />
power production methods.<br />
16<br />
17
MOBILITY<br />
MOBILITY<br />
Toyota believes that<br />
hydrogen is the catalyst for<br />
energy decarbonisation.<br />
Energy Observer Productions I Amélie Conty<br />
TOYOTA FUEL-CELL TECHNOLOGY<br />
opens new horizons for<br />
The Toyota fuel-cell-powered Energy Observer boat docks in Cape Town in June 2023. This<br />
state-of-the-art sustainability project demonstrates the adaptability of Toyota hydrogen fuelcell<br />
technology.<br />
Former racing catamaran turned ship of the future, Energy<br />
Observer, has made waves on its seven-year odyssey around<br />
the world as the first energy-autonomous hydrogen vessel.<br />
Toyota, official partner of Energy Observer and an avid supporter of<br />
their project from the start, specially developed a fuel-cell system<br />
for the Energy Observer maritime application.<br />
Energy Observer is an electrically propelled vessel of the future that is<br />
operated using a mix of renewable energies and an on-board system<br />
that produces carbon-free hydrogen from seawater. The operators of<br />
the vessel are on a mission to meet people in 50 countries and 101<br />
ports during their voyage, with an aim to prove that a cleaner world<br />
is not only possible but that the innovations can open doors to new<br />
sustainable energy systems. Their activities also demonstrate and<br />
share potential solutions to champion an ecological and energy<br />
transition – a challenge facing South Africa in particular.<br />
18<br />
Energy Observer in Svalbard.<br />
SUSTAINABILITY<br />
ENERGY OBSERVER<br />
Toyota’s fuel-cell system, first introduced in the Toyota Mirai, the<br />
world’s first mass-produced hydrogen fuel-cell electric vehicle, proved<br />
its value as a propulsion system on the road. However, the company<br />
has more recently been exploring the use of its fuel cell in other<br />
applications such as buses and trucks.<br />
Toyota as a company is aiming to develop a hydrogen society and<br />
to “establish a future society in harmony with nature,” as stated in its<br />
The project successfully demonstrates<br />
the adaptability of the Toyota fuel-cell<br />
technology to a variety of applications.<br />
Energy Observer Productions I Antoine Drancey<br />
Energy Observer Productions I Amélie Conty<br />
Solar and hydrogen technologies onboard Energy Observer.<br />
OVERVIEW OF THE BOAT<br />
Length<br />
31m<br />
Width<br />
13m<br />
Weight<br />
30 tons<br />
Height 14,85m<br />
Draft 2.2m<br />
Crew members 5<br />
Average speed 5/6 knots<br />
Energy Observer in Sweden.<br />
The Energy Observer Foundation Exhibition village will be on display<br />
at Jetty 2 at the V&A Waterfront harbour from 12 to 18 June. Entrance<br />
is free and talks and videos about Energy Observer's Odyssey, the<br />
17 Sustainable Development Goals (SDGs) and energy transition in<br />
South Africa will take place daily.<br />
Victorien Erussard, captain and founder of Energy Observer.<br />
The Toyota Fuel Cell System integrated in Energy Observer.<br />
BEYOND ZERO:<br />
Achieving zero and adding new value beyond it as part of efforts to<br />
pass our beautiful Home Planet to the next generation, Toyota has<br />
identified and is helping to solve issues faced by individuals and<br />
society, which Toyota calls “Achieving Zero”. Toyota is also looking<br />
“Beyond Zero” to create and provide greater value by continuing to<br />
seek ways to improve lives and society for the future.<br />
For more information about Beyond Zero visit: https://global.<br />
toyota/en/mobility/beyond-zero/<br />
Environmental Challenge 2050 – this aligned perfectly with Energy<br />
Observer’s mission and activities. From that common ground, the two<br />
have worked closely together on how a hydrogen fuel-cell system<br />
could be adapted to maritime applications.<br />
The maritime-specific system was developed by Toyota Technical<br />
Center Europe in a mere seven months. It required a redesign of<br />
the Mirai’s system, followed by the build and installation of the<br />
compact fuel-cell module. The project successfully demonstrates<br />
the adaptability of the Toyota fuel-cell technology to a variety of<br />
applications outside of land-based vehicles.<br />
“We are proud of the association with Toyota and its fuel-cell<br />
system, as used on our ocean passages and tested in the roughest<br />
conditions. After seven years and nearly 50 000 nautical miles of<br />
travelling, including three ocean crossings, the Energy Observer<br />
energy supply and storage system is now very reliable. We believe<br />
that the Toyota fuel-cell system is the perfect component for this,<br />
industrially produced, efficient and safe. Being an ambassador for the<br />
Sustainable Development Goals (SDGs), our mission is to promote<br />
clean energy solutions and we share with Toyota the same vision for<br />
a hydrogen society,” says Victorien Erussard, founder and captain of<br />
Energy Observer.<br />
The Toyota fuel-cell system has proven its benefits already for<br />
many years in the first-generation Mirai, and into the second<br />
generation zero-emissions vehicle revealed in South Africa earlier<br />
this year, but more recently other applications such as buses and<br />
trucks have been under development. Toyota believes that hydrogen<br />
is the catalyst for energy decarbonisation and such technology<br />
acceptance can accelerate modular fuel-cell solutions.<br />
19
ENERGY<br />
ENERGY<br />
Boosting the growth of the South African<br />
PPA market could alleviate pressure on<br />
Eskom to supply demand.<br />
• Reactive energy charges (c/kVArh) supplied more than 30% (0.96<br />
power factor or less) of the kWh recorded during peak and standard<br />
periods. The excess reactive energy is determined per 30-minute<br />
integrating period and is accumulated for the month applicable<br />
during the high-demand season.<br />
COMMERCIAL<br />
AND INDUSTRIAL<br />
Small-Scale Embedded Generation<br />
To achieve reliable and cost-efficient energy supply, commercial and industrial consumers are<br />
looking for alternative sources of energy for their operations. However, careful consideration of<br />
all the tariff components is necessary to determine the economic business case of small-scale<br />
embedded generation.<br />
Eskom<br />
Eskom C&I customers with a notified maximum demand (NMD)<br />
greater than 1MVA are typically on a time-of-use (TOU) tariff structure,<br />
namely the Megaflex tariff, while municipal licensees apply their own<br />
tariffs. All other customer segments who install small-scale embedded<br />
generation (SSEG) are required to move to a TOU structure.<br />
C&I customers who have installed grid-tied generation are moved<br />
to the Megaflex-Gen tariff (>22 kVA connections). On the Megaflex-<br />
Gen tariff, any excess energy fed into the grid that is not wheeled to<br />
another Eskom customer is credited at the Gen-offset tariff. If energy<br />
is wheeled to another Eskom customer (the off-taker), then the offtaker<br />
is credited at the Gen-wheeling tariff. The Megaflex tariff varies<br />
according to transmission zone, network connection size, maximum<br />
instantaneous demand and time of use (hour and season).<br />
Megaflex tariff components<br />
• Fixed charges (R/month) to recover overhead costs and prices<br />
that vary with customer-base size. These charges are based on<br />
the sum of the monthly utilised capacity at each point of delivery<br />
(POD) and administration charges.<br />
• Transmission, network and distribution demand charges<br />
(R/kW/month) to recover long-run marginal investments required<br />
to meet peak demand. These charges are based on the supply<br />
voltage, transmission zone and annual utilised capacity measured<br />
at the POD at all time periods. Excess network capacity charges<br />
are payable.<br />
• Energy charges (R/kWh) recover variable costs to meet the<br />
customer load. These are TOU differentiated active energy charges<br />
including losses based on supply voltage and the transmission<br />
zone of the customer. There are three TOU periods namely peak,<br />
standard and off-peak.<br />
• Ancillary service charges (c/kWh) based on the voltage of the<br />
supply applicable during all time periods.<br />
WEEKDAY TARIFF STRUCTURE<br />
Eskom and CSIR<br />
The Megaflex tariff incorporates three transparent cross-subsidies:<br />
i. The affordability subsidy funded by Eskom’s direct industrial and<br />
business customers and is calculated using the end-user’s total<br />
active energy demand.<br />
ii. The electrification and rural subsidy funded by Eskom’s direct<br />
industrial and business customers as well as municipalities and is<br />
calculated using the end-user’s total active energy demand.<br />
iii. The urban low voltage subsidy funded by all Eskom’s customers<br />
on urban tariffs that take supply at 66kV or higher. This cost is based<br />
on the voltage of the supply and charged on the annual utilised<br />
capacity measured at the POD applicable during all time periods.<br />
The actual revenue split between variable and fixed costs was<br />
determined in a cost-of-supply study (see figure 3) and demonstrates<br />
Eskom’s financial risk to declining energy volume sales. The average<br />
Figure 3. Eskom cost of supply and revenue share.<br />
ENERGY CHARGE (R/kWh)<br />
REPORT BY CSIR AND RES4AFRICA*<br />
The commercial and industrial (C&I) market provides a double<br />
opportunity for organisations by delivering them with costs<br />
savings, long-term price stability and security of energy<br />
supply, and allows for decarbonisation of their operations. The<br />
electricity consumption from the C&I market segment however<br />
has not grown at the same levels as other global markets due to<br />
unreliable supply, in fact it has slightly decreased since 2010.<br />
Official numbers of C&I installations and the equivalent capacity<br />
is not available, however estimates have been pulled together from<br />
different sources – placing the market size at over 1.15GW as of 2020.<br />
Outside of developed countries, South Africa has the largest share of<br />
companies actively sourcing renewable energy.<br />
SA TARIFF STRUCTURES<br />
Energy consumers either purchase electricity from Eskom or their<br />
municipality. Municipalities buy electricity directly from Eskom and<br />
redistribute it to end-users, adding their own distribution network<br />
and retail costs as well as an allowable profit margin. There are<br />
currently 266 local municipalities in South Africa, but not all have<br />
distribution licenses.<br />
Figure 1: Eskom total annual electricity sales volumes in GWh from 2010 to 2020.<br />
Eskom<br />
Figure 2. The Megaflex tariff. Notes: Megaflex Non-Local Authority tariff; transmission zone 66kV and 132kV. High season = Jun-Aug; low season =<br />
Sep-May. Notes: Megaflex Non-Local Authority tariff; transmission zone 66kV and 132kV. High season = Jun-Aug; low season = Sep-May.<br />
20<br />
21
ENERGY<br />
ENERGY<br />
LARGE INDUSTRIAL CUSTOMER<br />
LARGE COMMERCIAL OFFICE PARK<br />
The charges levied for wheeling follow NERSA guidelines. Eskom<br />
does not enter into long-term wheeling agreements at a fixed rate, so<br />
C&I customers are subject to changes in their and tariffs structures.<br />
Eskom and CSIR<br />
Figure 4: Megaflex tariff energy costs for C&I customers based in Gauteng. Notes: Commercial customer - Megaflex energy charges 500V and
ENERGY<br />
ENERGY<br />
HIS Markit, Global Wind Energy Council, International Energy Agency, BloombergNEF, Kearney Analysis<br />
How to navigate the headwinds in<br />
CLEAN ENERGY SUPPLY CHAINS<br />
The renewable energy supply chain is under immense pressure, with massive consequences for<br />
project developers. The demand for equipment is surging for everything from wind turbines to<br />
solar PV modules and hydrogen electrolyzers – and the supply gaps are widening.<br />
BY KEARNEY CONSULTING*<br />
The International Energy Agency predicts that global renewable<br />
capacity will increase by about 2 400GW (75%) between<br />
2022 and 2027. By 2030, this increase should reach between<br />
500GW and almost 1 200GW per year. For comparison, the entire<br />
global renewable capacity installed over the past decades stands<br />
at about 3 000GW. The picture looks starker for hydrogen: hundreds<br />
of gigawatts of electrolyzers are needed from today’s baseline of<br />
near-zero demand.<br />
Commodity markets are pouring even more fuel on the fire. Driven<br />
by price spikes, oil and gas companies created almost $1-trillion in<br />
free cash flow in 2022. This windfall provides the capital needed<br />
to finance their own renewable ambitions, with some companies<br />
targeting more than 100GW buildouts by 2030. Finally, the US Inflation<br />
Reduction Act and Europe’s REPowerEU plan have set ambitious<br />
targets and provided hefty incentives, such as a tax credit of up to<br />
$3 per kilogram for low-carbon hydrogen, likely driving incremental<br />
capacity additions across low-carbon energy sources.<br />
SHIFTING SUPPLY CHAINS<br />
So, is supply keeping up? In some cases, the answer is no or only<br />
with significant disruption or changes to the market structure.<br />
The solar photovoltaic (PV) market is looking the best so far, with<br />
module production capacity outstripping demand by a factor of two.<br />
However, shortages along the supply chain in critical raw materials<br />
such as polysilicon are a risk, with available capacity only about 20%<br />
above current demand – rendering the supply chain vulnerable to<br />
unexpected factory shutdowns, as in Xingjang.<br />
For batteries, concerns also loom on the raw materials side, with<br />
forecasts estimating lithium shortages between 2024 and 2028.<br />
On the final product, it is estimated that production capacity will<br />
not meet supply in the short term, also driven by growing demand<br />
for electric vehicles. Some automakers are already reacting with<br />
vertical integration, a strategy that won’t be available to utilities.<br />
The wind turbine supply chain is facing severe profitability troubles<br />
despite high demand. Further consolidation is probable, despite<br />
the already oligopolistic market structure with only five major<br />
western original equipment manufacturers (OEMs) remaining. In<br />
this environment, investing in extra capacity and innovation can be<br />
challenging. As a result, we are seeing price increases and rationing<br />
of production volumes. Access to some top-tier battery OEM<br />
production capacity requires minimum order sizes of 1GWh. Access<br />
to wind turbine blades now takes almost a year or longer. Electrolyzer<br />
manufacturers have put capacity expansions on hold due to the lack<br />
of final investment decisions (FIDs) with additional capacity taking at<br />
least 18 months to ramp up.<br />
Technologies with long-established cost curves have reversed their<br />
decline. Li-ion battery packs cost 2% more in 2022 year-over-year,<br />
after 12 years of consecutive decline at a rate of -18%. The wind turbine<br />
prices of some manufacturers rose more than 30% from 2021 to 2022.<br />
www.zeiss.com<br />
Figure 1. The outlook for supply and demand differs depending on the type of renewable equipment. Note: PEM is polymer electrolyte membrane.<br />
Segmented 3D volume of a polymer electrolyte fuel cell membrane<br />
electrode assembly. Gas diffusion layer fibre weaves are visible in green<br />
and magenta, microporous layer in blue, catalyst in yellow and electrolyte<br />
membrane in red.<br />
ADAPTING TO CHANGE<br />
What will all this mean for renewable players, such as project<br />
developers? Without adapting your supply chain approach, it will<br />
be difficult to secure access to new technologies and volumes of<br />
renewable equipment on time and at cost. In this environment, the<br />
procurement approach will need to be tailored to the supply-demand<br />
dynamics in the respective technologies and markets (see figure 1).<br />
In wind energy, which is an already-concentrated industry, the<br />
balance of power will likely shift further toward the supply side, driven<br />
by additional OEM consolidation and more entrants fragmenting<br />
the demand side, such as oil and gas companies. Similarly in solar<br />
PV, additional concentration on the supply side is probable, while<br />
the already heavily-distributed demand will continue to fragment.<br />
The demand for ESG-conforming panels is surging in Europe,<br />
with the EU proposing a directive for corporate sustainability due<br />
diligence along value chains.<br />
The dynamics are harder to assess for hydrogen electrolyzers, a<br />
more nascent industry. In the short term, a few OEMs have already<br />
committed to or executed capacity expansions. Therefore, they will<br />
likely make up a large share of the supply potential in the next three<br />
to five years, giving them some power to allocate scarce volumes<br />
to the highest bidder. The demand side also has some power thanks<br />
to early-mover benefits. Firm FID-backed order commitments or equity<br />
investments are valuable to OEMs, allowing them to scale production<br />
and potentially build a cost leadership position as they move down<br />
the cost curve faster than other OEMs. Flagship projects with publicly<br />
announced OEMs might also mobilise more customers. This demandside<br />
benefit could wane in the medium term.<br />
Supply and demand dynamics provide a valuable indicator for<br />
24<br />
25
ENERGY<br />
ENERGY<br />
Kearney Analysis<br />
Technologies<br />
with longestablished<br />
cost curves<br />
have<br />
reversed<br />
their decline.<br />
Unlocking the<br />
POWER OF THE SUN<br />
Investing in solar<br />
It has become popular to rely on inverter-only backup systems in the face of loadshedding,<br />
however by adding solar to the system South Africans can save money.<br />
Figure 2. The best way to counteract market forces will differ depending on the strategic goals of the renewable energy source. 1 Value and necessity of<br />
strategic partnerships also in wind offshore are growing.<br />
BY MENLO ELECTRIC*<br />
which supply chain strategy project developers should pursue. While<br />
demand power can be company-specific (think a multi-GW global<br />
utility versus a 100MW independent developer), an industry average<br />
view showcases the big picture. Offshore wind turbines and<br />
electrolyzers have high demand and supply power. Meanwhile,<br />
onshore wind and PV face the most adverse combination of market<br />
forces from a buyer’s perspective, where demand power is low and<br />
supply power is high.<br />
The best way to navigate these market forces is highly dependent<br />
on the respective technology and the underlying strategic goals on<br />
the demand side as well as on the supply side (see figure 2).<br />
• For PV modules, project developers put a clear focus on securing<br />
supply in the right quality and time and at competitive cost.<br />
In addition, ESG compliance, especially regarding forced<br />
labour, is paramount. The potential for additional value creation<br />
and project optimisation with suppliers is rather limited, and<br />
innovation is not as important as in other technologies.<br />
Consequently, pooling PV module demand into large bundles<br />
or a global framework agreement is a better strategy.<br />
• In wind energy, a close collaboration with an OEM can unlock<br />
substantially higher value. OEMs can customise turbines and<br />
support those already in early-stage project development to<br />
maximise project value, enlarging the pie for both parties.<br />
In onshore wind, with its heterogenous and relatively small<br />
projects, a formal strategic partnership agreement is necessary<br />
to enable portfolio-wide collaboration of both parties.<br />
Here, the procurement approach can be customised by<br />
regions, such as by entering a strategic partnership in Europe<br />
but procuring project-by-project in the US. In offshore wind, the<br />
sheer scale of projects allows utilities to get the most – and best<br />
– out of OEM competencies, often without formal partnership<br />
agreements. However, with the aforementioned market shifts,<br />
strategic partnerships may be about to become valuable and<br />
necessary also in offshore wind.<br />
• Electrolyzers are a less-established technology in terms of<br />
supply chain strategy compared with PV and wind turbines.<br />
In procurement, the focus is a bit less on cost (as long as capex<br />
comes down as forecasted in the next few years) and more<br />
on the efficiency to require less renewable electricity. Simply<br />
gaining access to equipment volume is a key concern as well.<br />
Equity investments or technology partnerships are the go-tostrategy<br />
for electrolyzers.<br />
STRATEGIC SOURCING<br />
The choice of the right procurement strategy is a highly individual<br />
decision. It requires careful analysis of a utility’s specific situation<br />
and strategic goals. Follow these steps to ensure an optimal fit of<br />
the resulting procurement strategy:<br />
• Conduct a thorough baselining to understand your cost, risk<br />
and procurement process for each of technology.<br />
• Identify and align your strategic objectives – both from a<br />
procurement and a business perspective.<br />
• Understand the supply market structure and trends, and<br />
define your value proposition to the supply market.<br />
• Develop the right sourcing strategy to enable growth, create<br />
cost competitiveness and mitigate risks on the supply market.<br />
A<br />
significant drawback of relying solely on backup systems is<br />
the inefficiency of charging with alternating current (AC) grid<br />
power. Charging batteries using high voltage AC grid power<br />
results in power losses. These losses occur during the conversion<br />
process from AC to direct current (DC).<br />
Solar PV modules charge the batteries directly, bypassing the<br />
need for converting AC grid power. This direct charging from solar<br />
energy eliminates the inefficiencies associated with grid charging,<br />
resulting in higher overall system efficiency.<br />
Another drawback is the limited use of backup systems during<br />
non-loadshedding periods. When there is no loadshedding, the<br />
backup system remains idle, not actively contributing to<br />
reducing reliance on the grid or lowering electricity costs. This<br />
underutilisation of the system means that the investment made<br />
in the backup system does not provide continuous benefits. It<br />
is essential to explore solutions that maximise the utilisation of<br />
backup systems throughout the year.<br />
By introducing solar PV panels into the system, you can begin to<br />
harness the sun’s energy to power your electrical appliances and<br />
extend the inverter battery’s lifespan for night-time or extended<br />
loadshedding periods. This reduces your dependence on the grid<br />
during loadshedding hours and ensures a more consistent power<br />
supply. There are also added bonuses of lower electricity bills and a<br />
more sustainable energy solution.<br />
THOUGHT [ECO]NOMY<br />
RESIDENTIAL SET-UP EXAMPLE<br />
System consists of:<br />
• 6 x 550W PV modules [R21 000]<br />
• 250/100 Victron MPPT DC-DC charger [R16 000]<br />
• Victron Multiplus-II 5kVA inverter/charger [R28 000]<br />
• 1 x 5kWh lithium battery [R27 000]<br />
The average baseload is around 500W, with a maximum draw of<br />
4 000W on the output of the inverter. The daily energy consumption<br />
ranges from 12kWh to 15kWh, excluding the gas geyser.<br />
From the six 550W modules, an average of 11kWh to 13kWh per<br />
day can be generated, depending on the time of year. Approximately<br />
4kWh to 4.5 kWh is stored in the battery, while the remaining energy<br />
powers the electrical loads.<br />
By shifting lifestyle habits to use high-power-consuming devices<br />
during daylight hours when solar energy is abundant, you can<br />
minimise grid dependency. While the return on investment may<br />
take around 10 years, it is important to note that the solar system<br />
serves not only as an investment but also provides loadshedding<br />
relief and convenience.<br />
As South Africa continues to address its energy challenges, solar<br />
presents a viable option to ensure a more sustainable and resilient<br />
energy future.<br />
When you are ready to embrace solar power and join the movement<br />
towards a more reliable energy landscape, ask your installer about<br />
sourcing solar panels from Menlo Electric South Africa, an official<br />
distributor of JA Solar, Jinko Solar, Tongwei and Longi solar panels.<br />
info.sa@menloelectric.com<br />
*Authors: Hanjo Arms (partner), Oskar Schmidt (principal), Enzio Reincke (partner) and Daniel Handschuh (consultant).<br />
Article courtesy of Kearney Consulting<br />
WATCH VIDEO<br />
greeneconomy/report recycle<br />
HOW TO GET THE MOST OUT OF HYBRID INVERTERS | Home<br />
energy storage solutions by Sungrow | Menlo Electric<br />
Menlo Electric speaks to Sungrow expert Michal Klos about<br />
energy systems, inverters, PV modules and related topics.<br />
Get exclusive insights into the solar industry. Menlo Electric offers<br />
free training to its clients. Participants will learn how to use Menlo<br />
products, market trends market trends and meet leading experts in<br />
the space training is conducted by both Menlo experts and guests. On<br />
completion, a certificate is issued to verify participants' commitment to<br />
professional development.<br />
TIPS TO MAXIMISE SAVINGS<br />
Invest in energy-efficient appliances. To reduce overall energy demand<br />
and augment the effectiveness of your solar system.<br />
Opt for LED lighting. Replace traditional bulbs with energy-efficient LED<br />
lights as they consume consume less energy and have a longer lifespan.<br />
Take advantage of time-of-use pricing. Schedule high-energy-consuming<br />
activities, such as laundry or dishwashing, during off-peak hours.<br />
Monitor and manage energy usage. Install an energy monitoring and<br />
management system to track and analyse your energy usage. This helps<br />
identify areas where energy consumption can be reduced and optimise<br />
the efficiency of your solar system.<br />
* Written by Arno Odendaal, technical sales, Menlo Electric South Africa.<br />
26<br />
27
Battery energy<br />
storage powered<br />
by renewable energy<br />
is the future, and it<br />
is feasible in South<br />
Africa right now!<br />
Sodium-sulphur batteries (NAS ® Batteries),<br />
produced by NGK Insulators Ltd., and<br />
distributed by BASF, with almost 5 GWh<br />
of installed capacity worldwide, is the<br />
perfect choice for large-capacity stationary<br />
energy storage.<br />
A key characteristic of NAS ® Batteries is the<br />
long discharge duration (+6 hours), which<br />
makes the technology ideal for daily cycling<br />
to convert intermittent power from renewable<br />
energy into stable on-demand electricity.<br />
NAS ® Battery is a containerised solution,<br />
with a design life of 7.300 equivalent cycles<br />
or 20 years, backed with an operations and<br />
maintenance contract, factory warranties, and<br />
performance guarantees.<br />
Superior safety, function and performance are<br />
made possible by decades of data monitoring<br />
from multiple operational installations across<br />
the world. NAS ® Battery track record is<br />
unmatched by any other manufacturer.<br />
Provide for your energy needs from renewable<br />
energy coupled with a NAS ® Battery.<br />
PREPARING THE WAY<br />
for a solar PV plant<br />
Gqeberha in the Eastern Cape will see construction starting on an exciting new<br />
solar energy plant later this year and SRK Consulting, South Africa is among<br />
the technical partners working to make this project a reality.<br />
BY SRK CONSULTING<br />
According to Brent Cock, principal engineering geologist<br />
at SRK’s Gqeberha office, the company has conducted a<br />
geotechnical investigation of the site where the 50MW<br />
photovoltaic plant will be located. The project is on a 100-hectare<br />
site on the western outskirts of Gqeberha between Bridgemeade<br />
and <strong>Green</strong>bushes. An interpretive geotechnical report has been<br />
prepared and submitted to the co-developers, RAW Renewables and<br />
Natura Energy.<br />
“In a project like this, it is important to test the subsurface<br />
geotechnical and geological conditions, including the suitability<br />
of on-site material for engineering layer works,” says Cock. “We<br />
were also asked to investigate the excavatability of the site, as<br />
well as groundwater and seepage conditions.” The study checked<br />
for any problematic soils and looked at foundation conditions<br />
to make appropriate recommendations for the project’s design<br />
and construction.<br />
“We excavated 24 test pits across the site with a 30-ton tracked<br />
excavator, to depths ranging from 0.9 metres (m) to 3.9m below<br />
current ground level – so that we could expose and analyse the ground<br />
profile,” he says. “We also undertook dynamic probe super heavy<br />
(DPSH) tests to assess the in-situ consistency, which showed refusal<br />
occurring at depths of 1m to 2.4m.”<br />
Wenner vertical electric sounding (VES) tests were conducted at<br />
17 locations, with two perpendicular soundings at each of the<br />
selected positions sharing the same centre position. “Samples of<br />
disturbed soil were collected from representative soil horizons and<br />
tested by an SRK-approved soil testing laboratory. This gives us insight<br />
into aspects such as the particle size distribution, including clay content<br />
where it occurs, as well as moisture content, thermal resistivity and<br />
aggressiveness towards buried concrete and steel,” Cock explains.<br />
The presence of ferruginisation in the terrace gravels – where the<br />
gravel particles have either been stained/coated, zones within the<br />
layer indurated (hardened) by iron oxide or a combination of both –<br />
indicates that there are sections of the site where water perched on<br />
the underlying bedrock in the past. A 2:1 paste of soil and distilled<br />
ENERGY<br />
Brent Cock, SRK<br />
Consulting, South Africa.<br />
water was tested according to the Basson Method to determine<br />
whether the ground is aggressive towards buried concrete and<br />
corrosive towards steel,” he says.<br />
Attention was paid to the presence of reworked residual clayey<br />
silt, residual shale and shale bedrock as these are not considered<br />
suitable construction material. “Disturbing these horizons is not<br />
recommended as recompacting the material is difficult, particularly<br />
if wet,” Cock adds.<br />
The site was deemed to be underlain by competent founding<br />
material, typically medium-dense sand and gravel with occasional<br />
very stiff clayey silt. “Both piled and concrete plinth foundations<br />
will be suitable for the support of the PV panels.” He added that<br />
where materials of variable consistency are present on a site, it is<br />
often economical to pre-drill percussion holes to the required depth<br />
– to provide both bearing and uplift – and then backfill the holes with<br />
suitable soil, after which piles can be driven into them.<br />
The Parsons Power Park project is aimed at the commercial and industrial<br />
market and will produce competitively-priced electricity for sale to large<br />
power users connected to the Nelson Mandela Bay municipal grid.<br />
SRK excavated 24 test pits across the site to assess the ground profile.<br />
Contact us right away for a complimentary<br />
pre-feasibility modelling exercise to find<br />
out how a NAS ® Battery solution can<br />
address your energy challenges!<br />
info@altum.energy<br />
www.altum.energy<br />
Altum Energy:<br />
BASF NAS ® Battery Storage Business<br />
Development Partner – Southern Africa<br />
(Left) The depth to bedrock, albeit variable, is typically shallow across the site. (Right) The thickness of the gravel material is variable across the site with thicker<br />
zones considered preferred borrow areas.<br />
29
ENERGY<br />
ENERGY<br />
Reducing the cost of<br />
WIND TURBINE FOUNDATIONS<br />
Non-linear finite element analysis can save up to 30% in steel reinforcement costs for concrete<br />
structures in wind turbine foundations. Sourcing materials for a remote location is logistically<br />
complex, adding significantly to the total project cost.<br />
BY ZUTARI<br />
While non-linear finite element analysis (NL-FEA) is not<br />
intended as a mainstream design solution, it is ideal for<br />
once-off structures like wind turbine foundations. Given<br />
the large number of renewable energy projects South Africa plans<br />
to have running within the next couple of years, optimising these at<br />
the design stage will fast-track the rollout and reduce costs.<br />
A standard foundation contains about 120kg of reinforcement<br />
per cubic metre of concrete, equating to about R1.5-million of<br />
reinforcement per foundation. Using NL-FEA design to reduce<br />
the reinforcement per foundation by up to 30% for a wind farm of<br />
30 wind turbines equates to a staggering R13.5-million saving,<br />
plus a significant reduction in the carbon footprint.<br />
“We are trying to be more accurate in looking at prestressed or<br />
reinforced concrete structures to reduce the project risk. The result<br />
is considerable savings for both client and contractor,” says Professor<br />
Pierre van der Spuy, associate, Zutari.<br />
Conventional finite element analysis (FEA) packages operate in the<br />
linear-elastic regime of concrete and other materials. On the other<br />
hand, NL-FEA develops accurate material models for concrete that<br />
consider softening post-yield until ultimate failure occurs.<br />
“Rather than being conservative in our approach towards concrete<br />
structures, we aim to be more accurate,” highlights Prof van der Spuy.<br />
Concrete is a non-linear material that resists tension but endures<br />
compression. Therefore, capturing its true behaviour as a material is<br />
difficult with conventional FEA packages.<br />
“By adopting NL-FEA instead, we can utilise the material’s true<br />
properties in a way that cannot be done otherwise in a linear method<br />
or through hand calculations, both methods that err on the side of<br />
caution,” says the professor.<br />
NL-FEA dives into the heart of concrete, presenting opportunities<br />
in other areas like forensics. “Fortunately, concrete structures do not<br />
collapse that often. In such situations, we can look at the behaviour of<br />
a specific part of a structure and achieve much more accurate results<br />
Khobab Wind Farm.<br />
Second base pour at Excelsior wind farm.<br />
Concrete is a non-linear<br />
material that resists tension<br />
but endures compression.<br />
than with standard methodologies,” he adds.<br />
It is even possible to apply NL-FEA to other concrete-intensive<br />
infrastructures such as dam walls, which typically have heat problems<br />
as the concrete hydrates. “The software even allows us to model<br />
cooling pipes in concrete.” Regarding wind turbine foundations,<br />
NL-FEA design can be used to tweak the geometry so that any heat<br />
build-up is dissipated toward the edges.<br />
“It is a bit more effort from the design perspective, but the benefit<br />
is so vast from a construction perspective that additional design costs<br />
are easily offset.” Zutari is not reinventing the wheel, as a European<br />
company is already using the method for wind turbine foundation<br />
design. “We are bringing this methodology to the local market as an<br />
affordable design option with significant benefits.”<br />
Arc Innovations working on a base at Perdekraal Wind Farm.<br />
Arc Innovations Arc Innovations<br />
Jeffery’s Bay Wind Farm in the Eastern Cape.<br />
The PRIVATE OFFTAKE MARKET<br />
is leading towards a<br />
LIBERALISED ENERGY SYSTEM<br />
South Africa’s renewable energy market continues to evolve while<br />
growing significantly, demonstrating that the industry is maturing. We<br />
are witnessing the liberalisation of the energy market moving towards a<br />
sustainable wind sector, says SAWEA.<br />
BY SAWEA*<br />
The renewable energy industry has witnessed significant changes<br />
this last year, resulting in the market’s transition from being<br />
one with a single offtaker (Eskom) to an open model, brought<br />
about by the removal of the licencing requirement for generation<br />
plants over 100MW as liberalisation mechanisms promulgated into<br />
law by the Department of Mineral Resources and Energy (DMRE).<br />
With more renewable-energy projects being introduced through this<br />
intervention, it will significantly contribute to the reduction of carbon<br />
emissions in line with our Nationally Determined Commitments.<br />
“There is a clear indication of a changing energy landscape<br />
through policy interventions that promote a green pathway to<br />
energy security, which have come about because of our country’s<br />
need for energy security and commitment to decarbonise. The<br />
private off-taker market model is very different to the public<br />
programme and together, these two structures will allow for the<br />
procurement of new capacity to meet the needs of the country, and<br />
to facilitate the implementation of the targeted energy mix,” says<br />
Niveshen Govender, SAWEA CEO.<br />
This shift offers flexibility and allows for private entities to<br />
accelerate the reduction of their carbon footprint, further attracting<br />
new investors to renewable energy. The structure of Power Purchase<br />
Agreements (PPAs) for the private offtake market will be viewed<br />
* South African Wind Energy Association<br />
Niveshen Govender, CEO<br />
of SAWEA.<br />
differently to the conventional Renewable Energy Independent<br />
Power Producer Procurement Programme (REIPPPP) PPA structure.<br />
“Tariffs in the private PPA market will be determined by bilateral<br />
negotiations between willing buyers and willing sellers, creating<br />
an open-market mechanism that will lead to IPPs approaching<br />
commercialisation differently,” adds Govender. “While there is an<br />
argument for the standardisation of PPAs, the allocation of risk<br />
is a concern and will be approached differently, depending on<br />
the project conditions. Contributing factors to future tariffs could<br />
include inflation, the cost of logistics and shipping, global changes<br />
to raw material and production costs amongst others. This may lead<br />
to an unintended imbalanced market shift between established<br />
and new IPPs competing on scale and price.”<br />
To date, the country has procured 3 442MW of wind energy plants<br />
through the established public procurement programme, with a<br />
further 984MW of wind energy projects having NERSA registrations for<br />
private procurement. There’s a potential pipeline of at least 4 000MW<br />
as bid in Bid Window 6 for public procurement and 15 000MW as<br />
indicated by the DMRE for private procurement. When considering<br />
South Africa’s long-term energy planning, both private and public<br />
markets are required to significantly increase the penetration of<br />
renewable energy towards a sustainable energy transition.<br />
30<br />
31
MOBILITY<br />
MOBILITY<br />
Zeiss Microscopy<br />
MINERAL SUPPLY<br />
CONSTRAINTS<br />
are LOOMING<br />
The rapid increase in EV sales during the pandemic has tested the resilience of battery supply<br />
chains and Russia’s war in Ukraine further exacerbated the challenge. Prices of raw materials such<br />
as cobalt, lithium and nickel have surged.<br />
BY INTERNATIONAL ENERGY AGENCY*<br />
Unprecedented battery demand and a lack of structural<br />
investment in new supply capacity are key factors. Russia’s<br />
invasion of Ukraine created pressures because Russia supplies<br />
20% of global high purity nickel. Average battery prices fell by 6%<br />
to USD132 per kilowatt-hour in 2021, a slower decline than the 13%<br />
drop the previous year. Given the current oil price environment the<br />
relative competitiveness of EVs remains unaffected.<br />
Today’s battery supply chains are concentrated around China, which<br />
produces three-quarters of all lithium-ion batteries and is home to 70%<br />
of production capacity for cathodes and 85% of production capacity<br />
for anodes (both are key components of batteries). Over half of lithium,<br />
cobalt and graphite processing and refining capacity is in China.<br />
Europe is responsible for over one-quarter of global EV production,<br />
but it is home to very little of the supply chain apart from cobalt<br />
processing at 20%. The US has an even smaller role in the global<br />
EV battery supply chain with only 10% of EV production and 7% of<br />
battery production capacity.<br />
Both Korea and Japan have considerable shares of the supply<br />
chain downstream of raw material processing, particularly in the<br />
highly technical cathode and anode material production. Korea is<br />
responsible for 15% of cathode material production capacity, while<br />
Japan accounts for 14% of cathode and 11% of anode material<br />
production. Korean and Japanese companies are also involved in the<br />
production of other battery components such as separators.<br />
Mining generally takes place in resource-rich countries such as<br />
Australia, Chile and the Democratic Republic of Congo, and is handled<br />
by a few major companies. Governments in Europe and the US have<br />
32<br />
bold public sector initiatives to develop domestic battery supply<br />
chains, but most of the supply chain is likely to remain Chinese through<br />
2030. For example, 70% of battery production capacity announced for<br />
the period to 2030 is in China.<br />
Additional investments are needed in the short term, particularly in<br />
mining, where lead times are much longer than for other parts of the<br />
supply chain.<br />
Digital material simulation to map diffusion behaviours in an NMC<br />
lithium-ion battery cathode.<br />
Zeiss Microscopy<br />
The supply of some minerals such as lithium would need to rise<br />
by up to one third by 2030 to match the demand for EV batteries.<br />
For example, demand for lithium – the commodity with the largest<br />
projected demand-supply gap – is projected to increase sixfold to<br />
500 kilotonnes by 2030, requiring the equivalent of 50 new averagesized<br />
mines.<br />
There are other variables affecting demand for minerals. If current<br />
high commodity prices endure, cathode chemistries could shift<br />
towards less mineral-intensive options. For example, the lithium iron<br />
phosphate chemistry does not require nickel nor cobalt but comes<br />
with a lower-energy density and is better suited for shorter- range<br />
EVs. Their share of global EV battery supply has more than doubled<br />
DOWNLOAD REPORT<br />
3D rendering of an intact lithium-ion battery.<br />
*This article is an excerpt from the report GLOBAL EV OUTLOOK 2022 | Securing supplies for an electric future | International Energy Agency | [2022].<br />
THOUGHT [ECO]NOMY<br />
since 2020 because of high mineral prices and technology innovation,<br />
primarily driven by an increasing uptake in China.<br />
Innovation in new chemistries, such as manganese-rich cathodes<br />
or even sodium-ion, could further reduce the pressure on mining.<br />
Recycling can also reduce demand for minerals. Although the impact<br />
between now and 2030 is likely to be small, recycling’s contribution to<br />
moderating mineral demand is critical after 2030.<br />
EV BATTERY SUPPLY CHAIN | Trends, risks and opportunities in a fast-evolving sector | Fitch Solutions<br />
County Risk & Industry Research | [December 2021]<br />
Companies have taken various actions to secure their EV battery supply chains. EV automakers are<br />
investing heavily into the localisation of their supply chains. By offering them a nearby supply of lithiumion<br />
batteries (LiBs), local gigafactories will reduce firms’ dependency on foreign suppliers and the<br />
downside risks ingrained in global supply chains.<br />
greeneconomy/report recycle<br />
This is particularly evident in the midstream as of November 2021, there is a total of 145 EV battery factories<br />
that are either operating or undergoing construction across 28 markets. This includes 51 construction<br />
projects in Europe, totalling 1 230GWh, and 29 in North America at 488.2GWh.<br />
These projects are key enablers in the localisation of EV battery supply chains. Localisation is occurring<br />
upstream with automakers and EV battery manufacturers employing various strategies to develop local<br />
supplies of CRMs near manufacturing sites.<br />
Renewable energy should become a major pull-factor for EV battery manufacturers in the near term.<br />
Battery manufacturing is capital and energy-intensive process – it therefore behoves firms to produce<br />
in markets with abundant access to affordable renewable energy to secure funding (given the growing<br />
importance of ESG in investment decision-making) and to ensure the sustainability of EVs. Consequently,<br />
we the primary pull factor for EV battery manufacturers (outside of government support) will shift from<br />
labour cost/availability to renewable energy cost, availability and sustainability. This is because automakers, and their large commercial<br />
clients, have put in place their own sustainability strategies which will place increased pressure on their component suppliers to become more<br />
sustainable. This will include sourcing ethically produced materials, using renewable energy and reducing carbon footprints along their own<br />
supply chains.<br />
Recycling presents several upside risks to the EV supply chain. By enabling automakers to re-use the CRMs in EV batteries, recycling<br />
offers an affordable, reliable and local supply of CRMs, which tapers automakers’ exposure to supply chain risks and reliance on the mining industry<br />
for regular supplies of expensive metals. Recycling is also an attractive process, particularly to governments and private sector firms, as by diverting<br />
LiBs away from landfills recycling contributes to an organisation’s sustainability efforts.<br />
33
ENERGY<br />
IT’S TIME TO LOOK IN THE MIRROR<br />
and ask ourselves if we really care about our planet<br />
Let’s take a moment and reflect on the energy crisis in this country. We are hovering around stage 6<br />
loadshedding at the time of writing this, and there are fears that it will get worse during winter.<br />
BY REVOV*<br />
Simply put, we don’t have enough energy to power our faltering<br />
economy. That’s the one side of the coin. On the other side,<br />
we find ourselves in a world that is under increasing pressure<br />
to reduce carbon emissions. Make no mistake, our country will<br />
pay the price in terms of international trade unless we step up<br />
and honour our renewable energy obligations.<br />
However, there is a third side to this coin – the rim. And the rim<br />
of this coin is not defined by either the pressure of supply or the<br />
pressure to avoid losing out on international trade. It is defined by<br />
the ethical responsibility of doing the right thing. We must start<br />
caring about the planet.<br />
Around the world, and especially in this country, people are quick<br />
to dismiss the “green agenda”. Let’s take a moment to reflect on how<br />
this plays out in South Africa.<br />
On a national level, we are being told that we don’t have the luxury<br />
to worry about renewables because there is an urgent energy crisis to<br />
fix. The solution, we are told, lies in ships burning gas off our coastline,<br />
and a re-investment in our notoriously unreliable and dirty coal power<br />
stations.<br />
On a personal level, we hear that we don’t have the luxury to worry<br />
about the lowest carbon footprint energy backup solutions because<br />
we must keep the lights on as cost-effectively as possible. This<br />
inevitably leads to people using generators or battery systems made<br />
from inferior chemistry, or from the right chemistry but without much<br />
thought going into the carbon footprint of the battery.<br />
Worrying about whether we will have a planet in a generation’s<br />
time is certainly not a luxury. It is the absolute crux of the point.<br />
This is the radical mindshift that’s required. It is time more South<br />
Africans stood up for the environment. If anyone needs to be<br />
reminded just how dire the situation is, do yourself a favour and visit<br />
the Human Impact Lab’s Climate clock. We have eight years left until<br />
the dominoes fall one by one.<br />
It is the absolute crux of the point.<br />
We must start caring<br />
about the planet.<br />
Remember the chimney collapse at Kusile? To rush the unit back<br />
into operation by the end of this year, a host of environmental standards<br />
(such as removing dangerous chemicals from the byproduct) have<br />
been waived – all in the name of reducing loadshedding. Fair<br />
enough, but does the prospect of acid rain on innocent people in<br />
Mozambique not keep you awake at night? It should.<br />
A common refrain in South Africa is that renewables cannot<br />
produce the amount of power we need. Renewables really can<br />
generate power – and large amounts to boot. Not only will it go a<br />
long way towards solving the energy crisis, but it will be clean and<br />
more reliable.<br />
In one year, Vietnam’s ambitious and forward-looking rooftop<br />
solar programme added 9.3GW of electricity to the country’s<br />
energy supply. Today, because they did not invest fast enough in<br />
transmission infrastructure at the same time, they must put a lid<br />
on the sheer amount of power being generated. Don’t let anyone<br />
tell you renewables can’t produce enough electricity: regulations<br />
and an outdated mindset is what stops renewables from generating<br />
enough electricity.<br />
We simply must do the right thing. Renewable energy, backed up<br />
with 2nd LiFe battery technology – with as close to a zero-carbon<br />
footprint as possible, and which fills a crucial spot in the circular<br />
economy as it solves what to do with replaced electric vehicles’<br />
batteries instead of dumping them in landfills – ensures we have<br />
an almost endless supply of energy storage capacity waiting to be<br />
put to use.<br />
It just takes bravery.<br />
* Written by Lance Dickerson, MD at REVOV.<br />
35
MOBILITY<br />
MOBILITY<br />
The value of<br />
MICROMOBILITY<br />
FOR AFRICAN CITIES<br />
1<br />
skateboards, Segways, cargo bikes and electric pedal assisted<br />
(pedelec) bicycles.<br />
e-Micromobility vehicles are powered by green energy and their<br />
batteries are charged by solar panels. Over the years, e-micromobility<br />
vehicles have seen major advancements which include fastcharging<br />
batteries with increased performance and decreasing<br />
cost. Innovations in mobile computing enable micromobility to be<br />
a shared mode of transport which can be booked using apps on<br />
connected smartphones.<br />
This economy model is an incentive to bring about modal shift as<br />
it encourages people to move out of their private cars to use shared<br />
micromobility services. Shared services also provide the opportunity<br />
for transit integration over the city.<br />
Micromobility is aimed at serving short distance travel in cities<br />
where most car trips are less than 8km mainly in the last mile 1 . There<br />
is a necessity to disrupt high private vehicle use for short distance<br />
travel in cities as this causes congestion and contributes to high<br />
carbon emissions. Governments and local authorities can articulate<br />
system-wide benefits of micromobility such as efficiencies and<br />
emission-savings related to moving people around. There is the<br />
increased access to mobility as a public service in local areas and<br />
between regions of a city.<br />
In supply chain management and transportation planning, the last mile is the last leg of a journey comprising the movement of people and goods from a transportation hub to a destination.<br />
Cities around the world need systems and technologies to improve public transit ridership,<br />
improve city congestion, encourage rideshare systems and reduce dependence upon fossil<br />
fuel-powered vehicles especially for single riders. The move towards micromobility has become<br />
a hot topic.<br />
A white paper for the Rosebank e-Micromobility Pilot Project by CityConsolidator.Africa and Mobility Centre for Africa | [April 2023]<br />
Micromobility is a call to collaborate<br />
for the common goal of transforming<br />
burgeoning African metropolises.<br />
C<br />
ities across the globe are on leveraging technology to increase<br />
sustainability and to transform their municipalities around<br />
improved transit flow. The benefits for residents of these smart<br />
cities will be better traffic flow as well as having practical options to<br />
get to destinations regardless of their ability to walk, bike or drive<br />
and much more. The by-products of doing this successfully is that<br />
city residents and users benefit from cleaner air and convenient<br />
options for moving themselves and their goods around. Improving<br />
the lives of citizens while simultaneously benefiting the municipality<br />
in reducing traffic congestion and vehicle emissions is the goal of the<br />
renewed focus on mobility in general and micromobility.<br />
Globally, micromobility solutions are surging in popularity as<br />
owning a vehicle in many urban areas can be impractical, and relying<br />
on schedule-based public transportation is not always convenient.<br />
Between the cost of vehicle ownership, rising insurance costs and a<br />
lack of convenient parking, many residents are opting to not purchase<br />
a traditional car.<br />
Notably, cities like Barcelona (Spain); Los Angeles, Oakland, San<br />
Francisco and New York City (USA); Paris (France) and many others<br />
have already experienced significant micromobility market growth or<br />
have performed important pilot projects.<br />
It has become critical to explore what value this trend and these<br />
emerging modes of transport have for African cities. Africa is in dire<br />
need for modern infrastructure developments that reduce carbon<br />
emissions while boosting economic growth and job creation.<br />
36<br />
While the world is making strides in adopting the use of clean<br />
energy, the African transport sector still relies substantially on<br />
fossil fuels. And many African city governments, alongside state or<br />
provincial governments are tasked with collaborating to transform<br />
their burgeoning metropolises.<br />
Micromobility is seen as a potential solution to moving people<br />
more efficiently around cities, an opportunity to match local transport<br />
modes to need and develop physical infrastructures that offer options<br />
for Africans to move around. Focusing on micromobility offers part<br />
of the solution to African transportation sector challenges as it is a<br />
narrative of change through innovation, associated with lower carbon<br />
footprint and energy efficiency. In the African context, there is still a<br />
search for how this focus on mobility can also contribute to addressing<br />
poverty, unemployment and inequality.<br />
However, in the current absence of complete smart micromobility<br />
ecosystems and supportive policy, African cities show slow adoption of<br />
this new mode of transport which has already gained vast momentum<br />
in most global metropolises.<br />
WHAT IS MICROMOBILITY?<br />
Whereas micromobility captures an array of lightweight vehicle<br />
types that generally have mass of less than 500kg, speed lower<br />
than 25km/h and are operated by one person, e-Micromobility<br />
vehicles specifically have motorised powertrains and are electric.<br />
These include standard bicycles, e-bikes, electric scooters, electric<br />
BENEFITS FOR THE USER<br />
• Renting a micromobility vehicle is more cost-effective than<br />
purchasing and maintaining a full-sized vehicle. Driving for<br />
the development of micromobility in a city creates the<br />
legal environment for freeing up citizens’ revenue. Viewing<br />
mobility as a service is critical to bring affordability to moving<br />
people and their goods around in African cities. Mobility as a<br />
service through micromobility vehicles creates new jobs such<br />
as drivers, equipment suppliers, vehicle maintenance as well<br />
as repair and battery swapping businesses electrification<br />
of micromobility is developed to scale this greener mode<br />
of transport.<br />
• Globally, the micromobility model has shown itself to be<br />
extremely sustainable, especially as e-scooters, the internet of<br />
things (IoT) and edge computing technologies evolve.<br />
• A micromobility network is highly efficient when compared to<br />
other public transportation solutions. Once a network has been<br />
implemented, a city can reduce the burden on other types of<br />
public transit.<br />
• In developed economies, convenience is represented as a<br />
micromobility device’s availability for rent on many city street<br />
corners, for example, rental bikes or scooters.<br />
Dungs, J. 2021. Electric Micromobility: how to cut emissions, create jobs and transform urban transport.<br />
International Energy Agency (IEA). Tracking Transport 2020 Report. 2020.<br />
Locke, J. What is Micromobility and What is the Market for Developers? DIGI; [20 March 2022].<br />
Sellmansberger, L. Boda-Bodas: Kampala’s Most Efficient Form of Transportation, for Better or for Worse. Kiva: KF19.<br />
Sengül, B. and Mostofi, H. 2021. Impacts of E-Micromobility on the Sustainability of Urban Transportation – A Systematic Review. Applied Sciences.<br />
VALUE IN AFRICAN CITIES<br />
Micromobility provides the opportunity for transit integration<br />
and for transforming ailing and constrained transport networks<br />
as well as movement infrastructure in African cities. Repairing,<br />
reinvesting and building more robust transport networks and<br />
movement infrastructure in the last mile is where most African<br />
cities require support.<br />
As an emerging focus of transport planning, e-micromobility<br />
can expand the view of mobility as a service and transforming<br />
African cities to be more responsive to prevailing challenges.<br />
This can be done with an ecosystem that makes operating<br />
e-micromobility vehicles economically viable through supportive<br />
legislation and policies developed in collaboration with the private<br />
sector.<br />
The task falls in the mandate and ambit of city and local<br />
authorities alongside state or provincial governments. In most<br />
contexts, one organ of state cannot unlock the benefits of<br />
micromobility, e-micromobility and mobility as a service alone or<br />
in isolation. Thus, micromobility is a call to collaborate for the<br />
common goal of transforming nascent African municipalities and<br />
serving citizens with mobility options enabled by government and<br />
provided by the private and informal sectors.<br />
37
MOBILITY<br />
e-Micromobility can<br />
DRIVE SA CITIES INTO THE FUTURE,<br />
starting in Rosebank, Joburg<br />
While other countries are leading the charge with electric vehicles and renewable energy,<br />
South Africa languishes in a power crisis and EVs on a mass scale seems like a pipe dream.<br />
BY ANDILE SKOSANA, CITYCONSOLIDATOR.AFRICA<br />
The revolution is coming and South Africa will have no choice<br />
but to keep up. The ideal is a country, and cities, that are built<br />
around sustainability and e-mobility, and, we would strongly<br />
argue, e-micromobility. But the question is how do we get there?<br />
This is how the Rosebank e-Micromobility Pilot Project was born<br />
– a small public-private partnership that goes down to the most<br />
granular level. Fifteen electric delivery bikes working within the<br />
Rosebank Management District precinct, sharing the same solarpowered<br />
charging kiosk that doubles as a battery-swapping centre.<br />
But why e-bikes, why e-micromobility? South Africa’s roads are<br />
built for cars and trucks. It would be no exaggeration to proclaim that<br />
they are unsafe for e-bikes. Despite the proliferation of delivery bikes<br />
in our suburbs. However, this is where we are, not where we want to<br />
be. It should not be that one 75kg person starts up a two-ton internal<br />
combustion vehicle to travel 3km to buy a litre of milk. Two-wheelers<br />
take up less space, they are more environmentally friendly, more<br />
manoeuvrable, more cost-effective and ultimately quicker because<br />
of their convenience. Most importantly, they are more inclusive in<br />
bringing more people into mobility generally. Introduced sustainably,<br />
an e-micromobility ecosystem will make for friendlier streets.<br />
Delivery bikes present a solid anchor point from which to enter<br />
the e-micromobility discussion. Since Covid-19, e-commerce has<br />
skyrocketed and will grow by 40% through 2025. This is one of the<br />
only growing segments in the economy now, and yet there is policy<br />
silence around the use of delivery e-bikes in cities. Where should they<br />
park? What are the rules for training drivers? What are the set standards<br />
and regulations? None of these questions can be answered, yet these<br />
e-bikes are integral to our suburban and inner-city lives. There needs<br />
to be rigorous thinking and planning around influencing policy<br />
for the sector because we can shape the growth of the sector to<br />
deliver convenience to other parts of the city and even the townships.<br />
The pilot project talks directly to this glaring need. If we can build a<br />
viable and safe e-micromobility ecosystem for delivery bikes, the next<br />
step is to add commuter and personal recreational mobility to the<br />
same ecosystem.<br />
A project like this cannot exist without massive buy-in. The private<br />
sector-led project has the support of the Rosebank Management<br />
District, Transport Authority Gauteng, the City of Johannesburg<br />
represented by transport, development and planning, the JRA<br />
and the Smart Cities office. The Gauteng Department of Economic<br />
Development is interested in issuing riders from Alexandra. The<br />
private sector has been equally welcoming in the form of secondlife<br />
storage battery business REVOV, SeeSayDo, Solid<strong>Green</strong>, Mzansi<br />
Aerospace Technologies as an accelerator, and Evo Motors will<br />
provide e-bikes and <strong>Green</strong> Riders e-bikes and training. The list of<br />
stakeholders grows daily.<br />
The outcome will be an applied research case study that delves<br />
into metrics to do with every aspect of the ecosystem, as well as<br />
concept notes to influence policy. Gauging the performance of<br />
the pilot will generate insights into e-bike and rider performance,<br />
delivery metrics, carbon savings and much more. The concept<br />
notes will include submissions to support the Transport Authority<br />
Gauteng’s 2030 Smart Mobility strategy, a concept note on a green<br />
mobility credentials and universally-standard swappable battery<br />
ecosystems as well as precinct infrastructure and management<br />
protocols for e-micromobility.<br />
e-Micromobility provides South Africa with an opportunity to<br />
catapult our cities into this new world, where they are not only more<br />
economically viable but also more inclusive of people’s needs. Building<br />
a world-class African city is the objective which will be achieved with<br />
a bottom-up approach that lays the foundation for scale, responsive<br />
policy and ultimately mass buy-in. This bottom-up approach might<br />
start small but will grow to make “rands and sense”, changing the face<br />
of our cities together.<br />
WHAT<br />
WE DO<br />
Local<br />
Procurement<br />
International<br />
Chemical<br />
Procurement<br />
Local Logistics<br />
Cross Border<br />
Logistics<br />
End to End Logistics<br />
of Copper Concentrate<br />
through Africa<br />
Sea Freight<br />
We are a Zijin owned subsidiary, with multiple mining clients mainly in the Democratic<br />
Republic of the Congo.<br />
Our company specialises in supplying mining equipment, steel, and<br />
consumables to our clients<br />
We specialise in cross-border logistics throughout Africa<br />
38<br />
20 Woodlands Dr, Woodmead, Johannesburg, 2191 | 010 449 2272
WATER<br />
WATER<br />
South Africa’s<br />
WATER UPDATE<br />
The South African water sector is facing all kinds of crises with an ill-equipped and sorely resourcedepleted<br />
government that seeks to correct over a decade’s inactions. While this phenomenon<br />
is not unique to the sector; without water security we have no hope of reviving the economy.<br />
So, let’s take stock of where we are and what our options are going forward.<br />
OPINION PIECE BY BENOÎT LE ROY, SA WATER CHAMBER<br />
NATIONAL GOVERNMENT INITIATIVES<br />
• National Water and Sanitation Master Plan published in 2018.<br />
• National water security framework for South Africa updated.<br />
• Water Summit held in Pretoria, March 2022.<br />
• National Infrastructure Plan (NIP) 2050 published in 2022.<br />
• National Water Resource Strategy 4 draft for public comment<br />
published in 2022.<br />
• Blue and <strong>Green</strong> Drop Reports published in 2022.<br />
SOUTH AFRICAN REALITY<br />
• Main themes out of the Master Plan such as non-revenue<br />
water, reuse and desalination have not yet been implemented<br />
in an overt and convincing manner at local government level<br />
as mandated by legislation.<br />
• Pollution of our water resources given the 97% sewage plants<br />
not complying to <strong>Green</strong> Drop standards remain unchanged<br />
with no visible mitigation actions made by local government.<br />
Many court cases have been won by NGOs but there has been<br />
no impactful enforcement of the court orders owing to the<br />
lack of state capacity.<br />
• Nelson Mandela Bay faces ongoing water shortages despite<br />
government interventions to support new water initiatives.<br />
• eThekwini suffered devastating floods in 2022 leaving much<br />
of the metro’s water and sewage infrastructure damaged<br />
on account of its poor state and consequent vulnerability.<br />
The December holidaymakers failed to materialise because<br />
of ongoing beach pollution by illegal sewage discharges that,<br />
to this day, remain reportedly largely unchanged.<br />
• Gauteng metros face weekly water disconnections owing to<br />
failing municipal water assets and Rand Water outages, all<br />
worsened by severe loadshedding.<br />
One would easily surmise that the reality resembles a war<br />
zone depiction but no, it’s not Ukraine or Sudan but South<br />
Africa where society seems to take it on the chin and accept<br />
that failing government services are here to stay and the new<br />
normal. Most of the water-related problems we face have one root<br />
cause, failed economic policy at all levels of government exacerbated<br />
by severe governance failures resulting in reduced institutional<br />
capacity to rebuild South Africa’s water security.<br />
South Africa has a rounded-off population of 60-million and is ranked<br />
as 25th in the world and fifth continentally by population size. We<br />
simply cannot be ignored with such a significant population and a<br />
relatively high GDP per capita on the continent. This means to me that<br />
Loadshedding is<br />
not a normal design<br />
input anywhere in<br />
the world.<br />
we must sort out the water security as one of the continent’s top five<br />
population and economic powers for the sake of all those around us<br />
that invariably depend on us.<br />
Water security is a fundamental economic lubricator, and the rollout<br />
of the infrastructure upgrades and extensions are key developers of<br />
crucial skills and a significant job creator. The implementation of the<br />
Water and Sanitation Plan with a price tag of R900-billion in 2018<br />
would generate at least R3.6-trillion in GDP triggering a multitude of<br />
skills, supply chain and technology opportunities.<br />
Many of the water value chain inputs are now imported due to<br />
deindustrialisation and government in collaboration with the private<br />
sector seeks to reverse this terminal trend with the adoption of the<br />
Water and Sanitation Reindustrialisation Plan published in 2022. The<br />
SA Water Chamber was established to catalyse the required publicprivate<br />
collaboration to unlock these master plans and this principal,<br />
loosely termed Private Sector Participation (PSP) is embedded in all<br />
recent policies including the latest NIP 2050 phases one and two.<br />
The chasm between national policy and local government<br />
implementation is so stark that the former has embarked on<br />
establishing the Water Partnership Office (WPO) in the Development<br />
Bank of Southern Africa and the National Water Infrastructure Agency<br />
within the Department of Water and Sanitation (DWS) to effectively<br />
replace the Trans Caledon Water Authority (TCWA) and the DWS<br />
construction entity.<br />
These two initiatives are intended to provide project preparation<br />
funding and implementation solutions on a programmatic basis with<br />
the required skills in a semi-centralised supporting mechanism.<br />
These entities would initially focus on reducing non-revenue water,<br />
implementing reuse schemes and desalination plants along the coast<br />
as espoused in the Water and Sanitation Master Plan.<br />
We are now five years down the track of the Master Plan timeline of<br />
10 years, so we have a decade’s worth of infrastructure to roll out by<br />
2028. This is an extraordinary opportunity for South Africa, so we need<br />
to start now!<br />
Loadshedding is a daily problem for all South Africans. And when<br />
it comes to water security, it’s a complex issue with very little that<br />
municipalities can do to alleviate the stress – apart from alternative<br />
energy sources that are generally far too expensive, as they are not<br />
possible at utility scale in the towns. Metros in South Africa have<br />
anything from 100 to 500 pump stations to provide water and evacuate<br />
sewage. Cities are designed to operate with 24/7 electricity supply<br />
feeding into these systems. Loadshedding is not a normal design input<br />
anywhere in the world.<br />
The result is that all electrical demands are being fed from a<br />
single supply system, so loadshed the area and all consumers are<br />
switched off from houses to shops, government buildings, clinics,<br />
hospitals, police stations, schools as well as water and sewage<br />
pump stations. Cities generally have 24 to 48 hours water storage in<br />
reservoirs which are designed to be fed continuously by electrically<br />
driven pump stations to keep them at adequate levels for the<br />
required pressures in the system.<br />
Periodic outages are catered for by the system’s embedded storage<br />
capacity, but ongoing outages result in systems unable to keep<br />
wet and they run dry. This leads to extraordinary damage when<br />
refilling the pipelines due to excessive water hammer, especially<br />
in the old vulnerable and dated systems in South Africa. Sewage<br />
systems only have around four hours of storage time as the<br />
maturation of the sewage can lead to odours as well as methane<br />
and hydrogen sulphide emissions that are potentially lethal.<br />
So, we sit on an additional time bomb on our aging and collapsing<br />
water infrastructure that we are ill-equipped to mitigate. We must<br />
not only capacitate local government in implementing the Water<br />
and Sanitation Master Plan, but also do it without energy security<br />
that serves to complicate and delay matters that will be costing us all<br />
more. What an own goal.<br />
It is very difficult to be positive about our country given the<br />
progressive collapse of our basic services such as water, electricity<br />
and logistics but “WE” have to mobilise a rather apathetic society to<br />
embrace their duties and each with their own capacity contribute to<br />
the inculcation of water security in our country. So, active citizenry<br />
is a powerful tool and is starting to mobilise in the water sector, but<br />
it has been unable to make any real dent in the rolling out of water<br />
security, yet. This landscape is a complex decentralised one that needs<br />
better governance, co-ordination and major PSP to unlock our water<br />
required water security.<br />
Water security is<br />
a fundamental<br />
economic lubricator.<br />
In the next issue, I will uncover any major updates and share my<br />
views on:<br />
• Municipal budgets in the South African metropolitians for<br />
water infrastructure<br />
• Decentralised/package plant options<br />
• Digitisation and digitalisation<br />
• Desalination news<br />
40<br />
41
THOUGHT LEADERSHIP<br />
THOUGHT LEADERSHIP<br />
and that it has granted to the Asian regions for example, “enviable<br />
record on growth and poverty reduction” (Asian Development Bank,<br />
2005). What is not clear, however, is how much economic growth is<br />
needed to afford the increased capital investment in infrastructure and<br />
the associated ongoing long-term maintenance and operation costs?<br />
Infrastructure impacts on ecosystems<br />
that are already stressed by<br />
climate change impacts.<br />
The Cost-Benefit Gap<br />
Many claims are made of the role infrastructure plays in economic<br />
growth. What is not examined is the cost benefit, particularly who<br />
carries the cost (including maintenance) and who benefits. A good<br />
example here is the construction of new government buildings in<br />
Pretoria. I still do not understand why ministerial offices must look like<br />
presidential suites in a five-star hotel.<br />
QUO VADIS<br />
Infrastructure Development: Part Two<br />
As expressed in the think-piece published in <strong>Issue</strong> 57, infrastructure backlogs and failures remain<br />
high in many countries. Countless arguments have been made to explain this, with the most popular<br />
one being under-investment.<br />
BY LLEWELLYN VAN WYK, B. ARCH; MSC (APPLIED), URBAN ANALYST<br />
In this think-piece, infrastructure condition reports are reviewed to<br />
assess whether there might be reasons other than those typically<br />
articulated – a systemic fault line perhaps – that might explain why<br />
infrastructure quality continues to lag despite investment.<br />
COUNTRY INFRASTRUCTURE ASSESSMENT REPORTS<br />
Infrastructure diagnostic reviews collect comprehensive data on the<br />
infrastructure sectors of a country and provide a holistic analysis of<br />
the challenges they face. Most reports adopt a sectoral approach,<br />
usually including typical bulk infrastructure services like energy,<br />
water, sanitation, transport and waste. The reports covered include<br />
Australia, Canada, New Zealand, Singapore, South Africa, USA and the<br />
UK. The period covers 1998 to 2021. The reports consulted are listed<br />
in the references.<br />
Other reports use a different narrative to the more conventional<br />
engineering approach, as in the Asian Development Bank (2005) that<br />
uses “stories” as a stock-taking basis. The narrative includes an economic<br />
story (levels of expenditure, stocks of infrastructure assets, access<br />
to infrastructure services and competitiveness); a spatial and demographic<br />
story (the demands on infrastructure of rapid urban growth, linking<br />
the rural poor to growth poles as well as the regional dimension of<br />
infrastructure supporting trade and spreading the benefits across<br />
borders); the environmental story (air quality, emissions, sanitation as<br />
well as the functioning of ecological goods and services); the political<br />
story (who captures the benefits of infrastructure, who provides, to<br />
whom at what price and at whose cost); and lastly the funding story<br />
(the scale of infrastructure needs and how to resource them).<br />
These are crucial questions and were used in this think-piece to<br />
frame a narrative around “systemic infrastructure gaps”. The emergence<br />
of the word “gap” surprised me: in all my research in this field the search<br />
had been predicated on identifying issues, but the more reading that<br />
was done the more the notion of gaps bedded in.<br />
MIND THE GAP<br />
Based on an extensive reading of these reports, the<br />
following main findings emerged.<br />
The Growth Gap<br />
The core argument is that infrastructure is an<br />
essential part of an enabling environment for<br />
investment and livelihood thus promoting economic<br />
advancement, reducing poverty and improving delivery<br />
of health and other services (World Bank, 2014). Almost all reports argue<br />
that infrastructure is a “bedrock for development” (Mitullah, 2016)<br />
High levels of investment do not necessarily<br />
translate into efficient investment.<br />
The Service Gap<br />
Despite investment, access to infrastructure<br />
services remains uneven. The Asian Development<br />
Bank (ADB) acknowledges that infrastructure<br />
plays a dual role: meeting the needs of the<br />
poor and providing the underpinnings for the<br />
region’s growth. The recognition of this dual<br />
role is fundamental to a proper understanding of<br />
sustainable infrastructure design. More critically, the<br />
ADB also notes that the “complexity of responding to these demands<br />
is greater than ever, and the cost of getting things wrong is very<br />
high. Poorly-conceived infrastructure investments today would<br />
have a huge environmental, economic and social impact – and be<br />
very costly to fix later” (Asian Development Bank, 2005).<br />
In many countries infrastructure networks increasingly lag demand<br />
and are characterised by missing regional links and stagnant<br />
household access. In most African countries, universal access to<br />
household services is more than 50 years away (Sudeshna, 2008).<br />
More critically, even where infrastructure networks exist, Sudeshna<br />
(2008) notes that a significant percentage of households remain<br />
unconnected, suggesting that demand-side barriers persist and<br />
that universal access entails more than physical rollouts of networks.<br />
Not unexpectedly, access to infrastructure in rural areas is only a<br />
fraction of that in urban areas (Sudeshna 2008).<br />
The point is made (Foster, 2010) that achieving universal access<br />
will call for greater attention to removing barriers that prevent<br />
the uptake of services and offering practical alternative solutions.<br />
The Network Gap<br />
Understanding that infrastructure is a system of systems is key to<br />
future strategic planning. The development of infrastructure networks<br />
needs to be strategically informed by the spatial distribution of<br />
economic activities and by economies of agglomeration (Foster and<br />
Briceno-Garmendia, 2010). A challenging aspect in this regard is the<br />
infrastructure choices/land-use pattern nexus, especially where those<br />
land-use patterns are not well established and/or the expansion of<br />
those land-use patterns are not accounted for. Often this results in<br />
expensive infrastructure retrofitting.<br />
Difficult economic geography may also present a significant<br />
challenge for infrastructure development: striking the balance<br />
between urban and rural infrastructure design is particularly<br />
challenging, not least because the unit costs of delivering rural<br />
infrastructure is often higher than similar urban infrastructure<br />
(Asian Development Bank, 2005).<br />
In this regard, Infrastructure Australia advocates adopting a placebased<br />
approach which creates a synergistic link between assets<br />
and networks of assets, local and context-specific characteristics<br />
and is beneficial to users of infrastructure services (Infrastructure<br />
Australia, 2021).<br />
The Affordability Gap<br />
Affordability gaps are reported across urban<br />
sectors, and these gaps tend most often to<br />
affect the poor who are often found in periurban,<br />
informal settlements. In developing<br />
economies infrastructure services may be<br />
twice as expensive in some countries, reflecting<br />
both diseconomies of scale in production and<br />
high-profit margins caused by lack of competition<br />
(Foster and Briceno-Garmendia, 2010).<br />
The Basic Services Gap<br />
The provision of basic services<br />
stays uneven: access to water and<br />
sanitation remains low in lowand<br />
middle-income countries. A<br />
reliable electricity supply remains<br />
the predominant infrastructure<br />
challenge, with many countries<br />
facing regular power shortages<br />
and many paying high premiums<br />
for emergency power.<br />
The Funding Gap<br />
In most cases the funding needs exceed the<br />
available revenues. The cost of addressing<br />
infrastructure needs is many billions of<br />
dollars a year, about one-third of which is<br />
for maintenance (Briceno-Garmendia, 2008).<br />
However, due to the large infrastructure<br />
spending backlog, the estimated spending<br />
needs contain a strong component of<br />
refurbishment and replacement. The challenge<br />
varies by country type – fragile states face an<br />
42<br />
43
Strive for Net Zero<br />
while saving money<br />
at the same time!<br />
Rooftop, solar carports, ground-mounted solar, and<br />
agri-voltaics represent the best value energy available to<br />
the energy customer in South Africa.<br />
Blue Sky Energy are experts in the design, procurement<br />
and construction of such plants.<br />
Battery energy storage installations provide access to solar<br />
energy daily during peak hours when the sun is not shining<br />
and enable users to bridge their primary energy needs<br />
through grid interruptions.<br />
While the levelised cost of hybrid solar and battery storage<br />
installations is significantly greater than solar PV only,<br />
appropriately sized solutions can be commercially feasible.<br />
Would you like to know if your property or business can<br />
achieve energy security at the same cost or less than what<br />
you are paying currently?<br />
impossible burden and resource-rich countries lag in spite of<br />
their wealth. It is argued that infrastructure provides best outcomes<br />
when it is delivered within robust, well-regulated market structures<br />
and funded through an equitable balance of user and taxpayers’<br />
revenues (Infrastructure Australia, 2016).<br />
The Maintenance Gap<br />
Infrastructure assets in many countries are nearing<br />
and/or are at their end of life. Ageing infrastructure<br />
networks are a simple consequence of when they<br />
were built. The inadequate maintenance of existing<br />
infrastructure exacerbates the dilapidation – and in<br />
some cases the destruction – of already overburdened<br />
infrastructure systems. The rehabilitation backlog<br />
reflects a legacy of under-funded maintenance, a major<br />
waste given that the cost of rehabilitation is several times higher<br />
than the cumulative cost of sound preventative maintenance (Foster<br />
and Bricendo-Garmendia, 2010).<br />
The Financing Gap<br />
There are two funding sources from which infrastructure can<br />
be funded: consumers (via user charges) and public sector (via<br />
taxpayers). A large share of infrastructure investment is domestically<br />
financed, with the central government budget being the main<br />
driver of infrastructure investment. Public investment is largely<br />
tax-financed and executed through central government budgets,<br />
whereas the operating and maintenance expenditure is largely<br />
financed from user charges and executed through state-owned<br />
entities or municipalities.<br />
THOUGHT LEADERSHIP<br />
the private sector could provide funding, like<br />
ICT. Many countries are mostly spending only<br />
about two-thirds of the budget allocated to public<br />
investment in infrastructure. This means that public<br />
spending could increase by 30% without an increase<br />
in funding if institutional bottlenecks that inhibit capital<br />
budget execution could be overcome. Challenges include better<br />
planning of projects, earlier completion of feasibility studies,<br />
more efficient procurement processes as well as better project<br />
management and execution.<br />
The Technology Gap<br />
The ability of users to choose from a range of infrastructure<br />
services can be improved with new technologies, which can enable<br />
substantial improvements to user experiences and quality of life<br />
outcomes. This is especially true in rural areas, and for people from<br />
lower socio-economic and diverse backgrounds. However, local<br />
by-laws and building regulations can prohibit the implementation<br />
of alternative technologies and major public infrastructure delivery<br />
entities can prohibit local authorities from implementing alternative<br />
and competing infrastructure services to the detriment of users as<br />
has been the case recently in South Africa. A clear knowledge gap<br />
exists among infrastructure designers around using innovation and<br />
emerging technologies to find new solutions to old problems (Wilczek,<br />
2015). I am reminded by Einstein’s comment “Insanity is doing the<br />
same thing over and over and expecting different results”.<br />
123RF<br />
Did you know that Section 12B of the Tax Act<br />
allows for the accelerated depreciation<br />
of your power generation capex resulting<br />
in a 27.5% saving on your project installation?<br />
Agri-Voltaics and Solar Carports<br />
Blue Sky Energy works with leading light steel frame<br />
construction suppliers to offer a range of innovative<br />
solutions such as agrivoltaics and solar carports.<br />
Have you considered putting your spare space to work?<br />
Whether you have low-value land or large parking spaces,<br />
bring them to life through solar PV installations that create<br />
energy and high-value spaces such as shade for parking<br />
or tunnels for agriculture.<br />
Website: www.blue-sky.energy Email: enquiries@blue-sky.energy<br />
CONTACT THE EXPERTS AT BLUE SKY ENERGY RIGHT NOW!<br />
123RF<br />
The Payment Gap<br />
Rarely are user charges sufficient enough to cover<br />
the maintenance and operation of the service.<br />
The contribution level of consumers is impacted<br />
by the prevailing economic conditions. In a highinflation<br />
environment (like the global economy<br />
is now facing) the ability of consumers to<br />
pay for services becomes challenging of itself,<br />
let alone including a contribution to future<br />
development or meeting maintenance needs. Thus,<br />
many local authorities limit their budget increases to be equal to<br />
Asian Development Arcadis. (2016). Global Infrastructure Investment Index. Arcadis.<br />
or below the current inflation rate, which then precludes asset<br />
maintenance or expansion. The lack of formal access to public<br />
infrastructure Foster, V. B.-G. (2010). services Africa’s Infrastructure: and/or non-payment A Time for Transformation. those Washington: services World Bank. becomes<br />
Global Infrastructure Hub. (2021). Singapore. Global Infrastructure Hub.<br />
an expression of political dissatisfaction.<br />
Asian Development Bank. (2005). Connecting East Asia: A New Framework for Infrastructure. Tokyo: Asian Development Bank.<br />
Briceno-Garmendia, C. S. (2008). Financing public infrastructure in Sub-Saharan Africa: Patterns, <strong>Issue</strong>s, and Options. Washington: World Bank.<br />
Han, G. (2023, February 9). Govt spending may hit 20% of GDP by FY2030, GST hike and tax moves were needed to fund growing needs: MOF. The Straits Times.<br />
Infrastructure Australia. (2016). Australia Infrastructure Plan. Infrastructure Australia.<br />
The Efficiency Gap<br />
The Infrastructure lack of Australia. long-term (2021). planning, A Pathway to Infrastructure coordination Resilience. and Infrastructure cooperation Australia. between<br />
levels of government remains a severe constraint on infrastructure<br />
development. High levels of investment do not translate into efficient<br />
investment. Rathbone, M. A. (2021). Even Singapore if major ranks #1. potential Singapore: CMS. efficiency gains are achieved,<br />
many countries would still face an infrastructure funding gap of<br />
billions Tomer, A. of K. (2021). dollars Rebuild a year, with purpose. mainly Brookings: power. Metropolitan Policy Program.<br />
Wilczek, F. (2015, September 23). Einstein’s Parable of Quantum Insanity. Scientific America.<br />
Briceno-Garmendia, Smits and Foster (2008) note that in some<br />
World Bank. (2014). Logistics performance index. Washington: World Bank.<br />
instances countries allocate more resources to some areas of<br />
World Data. (2023). Transport and infrastructure in Singapore. Washington: World Bank.<br />
infrastructure than seem to be warranted, often in areas where<br />
Infrastructure Australia. (2019). An Assessment of Australia’s Future Infrastructure Needs. Infrastructure Australia.<br />
Jay, S. J. (2007). Environmental Impact Assessment: Retrospect and Prospect. Environmental Impact Assessment Review. Elsevier. 27 (4), 289-300.<br />
The Ecological Gap<br />
Infrastructure investment and climate action are urgently needed.<br />
With the right approach it’s possible to achieve both goals<br />
simultaneously. The planet’s climate crisis requires a<br />
resilient built environment to protect and support<br />
communities (Tomer, 2021). Infrastructure impacts on<br />
ecosystems that are already stressed by climate change<br />
impacts. Where infrastructure is built, and what<br />
resources are used for its construction and operation<br />
become key considerations to deal with both threats.<br />
Infrastructure choices play a critical role in addressing<br />
the contributory role of infrastructure to biodiversity<br />
loss and climate change. Achieving resilience requires a shift<br />
in focus from the resilience of assets themselves to the contribution<br />
of assets to the resilience of the system (Infrastructure Australia, 2021).<br />
Assets that do this include blue and green infrastructure and naturebased<br />
solutions.<br />
In this regard, national, regional and local policymaking agendas<br />
and project level interventions have a critical role to play. Typical<br />
approaches in the past relied on environmental impact assessments<br />
(EIAs) with a view to minimising impacts through mitigation measures<br />
or environmental safeguards. However, EIAs are criticised for being<br />
used more as a decision-aiding tool rather than a decision-making<br />
tool (Jay, 2007) thereby limiting their influence on decisions. In<br />
practice, almost all EIAs address only direct and immediate on-site<br />
effects (Lenzen, 2003).<br />
Lenzen, M. M. (2003). Environmental impact assessment including indirect effects - a case study using input-output analysis. Environmental Impact Assessment Review. Elsevier. 23(3), 263-282.<br />
Mitullah, W. S. (2016). Building on progress: Infrastructure development still a major challenge in Africa. Nairobi: Afrobarometer.<br />
Sudeshna, B. W. (2008). Access, Affordability, and Alternatives: Modern Infrastructure Services in Africa. Washington: World Bank.<br />
45
THOUGHT LEADERSHIP<br />
THOUGHT LEADERSHIP<br />
THE CURIOUS CASE OF SINGAPORE<br />
Throughout the many country infrastructure reports read for this<br />
think-piece, one country stood out – Singapore. Singapore has jumped<br />
up two places to claim the number one spot on the 2021 Infrastructure<br />
Index (Rathbone, 2021) and retained its position as the world’s most<br />
attractive market for the third edition of the Global Infrastructure<br />
Investment Index (Arcadis, 2016). This despite investing around 5%<br />
of its Gross Domestic Product (GDP) on infrastructure in 2015 and 1%<br />
in 2021 (Global Infrastructure Hub, 2021), a level many commentors<br />
would argue is insufficient. Singapore aims to spend 4.4% of GDP by<br />
FY2026 to FY2030 (Han, 2023). Yet, as shown in Table 1, its infrastructure<br />
quality rates at 95 and its infrastructure gap at 0.<br />
Global Infrastructure Hub, May 2023<br />
Metric Singapore High-income<br />
countries<br />
GDP per capita (USD) 72 795 47 887<br />
Population (million persons) 5 1 241<br />
Infrastructure quality 95 84<br />
Infrastructure investment (% of GDP) 1 2.7<br />
Infrastructure gap (% of GDP) 0 0.3<br />
Singapore South Beach.<br />
Merlion Park, Singapore.<br />
Lotus Night, Singapore.<br />
Marina Bay Sands.<br />
Table 1. Infrastructure market overview of Singapore.<br />
Notes to Table<br />
1. GDP per capita and population data as of 2021.<br />
2. All other data as of 2019.<br />
3. Infrastructure quality rating on a scale from 0 (worst) to 100 (best).<br />
This begs the question: how can Singapore retain its leading position<br />
at this level of investment? Perhaps the answer is that it is a city state<br />
with an area of 719km² and a population density of 7 <strong>58</strong>5 inhabitants<br />
per km² (World Data, 2023). If this is the case, the factors making a city<br />
state successful need to be identified and tested for replicability in<br />
other countries.<br />
Hong Lim, Singapore.<br />
CONCLUSION<br />
In starting this series of analyses I had in mind the opportunity of<br />
finding some systemic reason(s) for the poor state of infrastructure<br />
globally. The collective readings have however given rise to a)<br />
the notion of gaps and b) the success of infrastructure services in<br />
Singapore. I have long argued that the design of a city state may<br />
well be the key to a well-functioning and sustainable infrastructure<br />
sector, and there is now some evidence to support this hypothesis. In<br />
the next think-piece, I will explore this notion further.<br />
Hong Lim.<br />
Changi Airport, Singapore.<br />
Singapore cable cars.<br />
Singapore Super Trees.<br />
ASCE 2021. A Comprehensive Assessment of America’s Infrastructure. Virginia: American Society of Civil Engineers.<br />
ASCE 2013. 2013 US Report Card for America’s Infrastructure. Virginia: American Society of Civil Engineers.<br />
Canada Infrastructure 2016. Informing the Future: Canadian Infrastructure Report Card 2016. Canadian Construction Association, Canadian Public Works Association, Canadian Society for Civiol Engineering, and the<br />
Federation of Canadian Municipalities.<br />
CBI/AECOM 2016. Thinking Globally Delivering Locally: CBI/AECOM Infrastructure Survey 2016. United Kingdom: CBI.<br />
Coulibaly, B. (ed), 2019. Foresight Africa. Washington, Brookings Institution.<br />
ISPI 2019. Infrastructure and Development: The Case of Infrastructure Asia. Italian Institute for International Political Studies.<br />
ICE 2014. State of the Nation Infrastructure. Institution of Civil Engineers.<br />
IPA 2017. Transforming Infrastructure Performance. United Kingdom: Infrastructure and Projects Authority.<br />
Engineers Australia 2010. Australian Infrastructure Report Card 2010. Engineers Australia, November 2010.<br />
Infrastructure Australia 2015. Australia Infrastructure Audit. Infrastructure Australia April 2015.<br />
Infrastructure New Zealand 2020. Infrastructure Priorities for 2020-2023 Government. Infrastructure New Zealand, Auckland.<br />
Lim, H. 2008. Infrastructure Development in Singapore. In Kumar, N. (ed.), International Infrastructure Development in East Asia – Towards Balanced Regional Development and Integration, ERIA Research Project Report<br />
2007-2, Chiba: IDE_JETRO, pp.228-262.<br />
Miller, J. (ed.), 2007. Infrastructure 2007: A Global Perspective. Urban Land Institute and Ernst & Young.<br />
National Infrastructure Commission 2018. National Infrastructure Assessment. United Kingdom: National Infrastructure Commission.<br />
New Zealand Government 2015. The Thirty Year New Zealand Infrastructure Plan. New Zealand Government: Wellington.<br />
SAICE 2011. Infrastructure Report Card for South Africa. Halfway House: The South African Institution of Civil Engineering.<br />
SAICE 2017. Infrastructure Report Card for South Africa. Halfway House: The South African Institution of Civil Engineering.<br />
SAICE Singapore 2022. Infrastructure at night. Report Card for South Africa. Halfway House: The South African Institution of Civil Engineering.<br />
Singapore city skyline.<br />
Tuas Link MRT station in<br />
western Singapore.<br />
Gardens by the Bay.<br />
Gardens by the Bay East.<br />
Park Royal Hotel.<br />
46<br />
47
ENERGY<br />
ENERGY<br />
A Gόnzales Segura, D Molina Fernández and I Sánchez Almazo, University of Granada, Spain.<br />
opening a new research facility for just this purpose. The plan is to<br />
bring together materials scientists, chemical engineers and digital<br />
transformation professionals to drive nanotechnology advances using<br />
materials informatics and computational chemistry.<br />
* Written by Sam Dale, technology analyst, IDTechEx<br />
ECOSYSTEM DIVERSITY<br />
TOWARDS THE BATTERY OF THE FUTURE<br />
A Kopp, Aalen University, Germany<br />
ENERGY MATERIALS<br />
research is<br />
DRIVING CHANGE<br />
Materials informatics is the application of data-driven methods to the field of materials science<br />
and has wide-ranging benefits, but the ability to enhance the sustainability of materials could be<br />
the most impactful of these.<br />
BY IDTechEx*<br />
Decarbonisation efforts are a growing driver for adopting these<br />
technologies and processes. This, alongside the fact that<br />
materials informatics helps organisations to save money<br />
while accelerating materials innovation, is a contributing factor to<br />
IDTechEx’s prediction that the market for the provision of external<br />
materials informatics services will grow at 13.7% CAGR to 2033.<br />
Players from the AI industry are seeing materials informatics’<br />
ability to contribute to solving the climate crisis. Meta AI (of Facebook<br />
parent Meta) and Carnegie Mellon University’s Open Catalyst Project<br />
aims to identify catalysts that aid the production of fuels using<br />
excess renewable energy. This project open sources the discovery<br />
process, making the results of 260-million density functional theory<br />
calculations publicly available for researchers to train their own<br />
surrogate models on.<br />
Alongside the project’s initiators, universities, including Munich<br />
Technical University and other AI giants, including Tencent AI, have<br />
published results calculated from the dataset. Applications of “AI for<br />
good” in sustainability of this sort will likely become a major part<br />
of the ESG toolboxes of machine learning industry titans. These<br />
surrogate models could aid in decreasing the energy requirements<br />
to produce, for example, green hydrogen.<br />
Solar photovoltaics (PV) are another fruitful area for materials<br />
informatics to make an impact. AI can facilitate many areas of PV<br />
development, including accelerated lifetime testing.<br />
The materials industry itself is acting on the need for in-house data<br />
Some key application areas for materials informatics and their potential<br />
sustainability impacts. Main image: Phytoplankton: regulators of<br />
atmospheric CO2, ocean acidification and global carbon cycle.<br />
science expertise as its importance continues to grow, including in<br />
facilitating sustainable manufacturing. In February 2023, materials<br />
industry giant Toray Industries announced that it would be<br />
IDTechEx<br />
Cobus Visagie, University of Pretoria, South Africa<br />
READ REPORT<br />
Professor Cobus Visagie’s microscopy image of fungi shows a new<br />
Talaromyces species found in South Africa, growing on oatmeal.<br />
Visagie is a mycologist, Forestry and Agricultural Biotechnology<br />
Institute at the University of Pretoria, working on the taxonomy of<br />
moulds from the natural and built environment.<br />
THOUGHT [ECO]NOMY<br />
greeneconomy/report recycle<br />
In this image of fluorides on an anode surface of a Li-ion battery,<br />
the growth of nearly perfect cubes is directly linked to the crystal<br />
system of the materials. ZEISS light and electron microscopes were<br />
used to assess the quality of Li-ion batteries. The demand for these<br />
energy suppliers and storage devices continues to increase, as do<br />
the requirements.<br />
Players from across the AI industry<br />
are seeing materials informatics’ ability to<br />
contribute to solving the climate crisis.<br />
ENERGY MATERIALS RESEARCH | Wiley-VCH Verlag GmbH & Co. KGaA | Carl Zeiss Microscopy GmbH<br />
As natural resources become increasingly scarce and the demand grows for more portable, reliable,<br />
safe and sustainable forms of energy, scientists face new challenges in materials research. Solar cells,<br />
batteries, fuel cells and next-generation nuclear reactors – and the often highly heterogeneous materials<br />
they contain – present a paradigm shift in shaping the way energy is generated, stored and converted.<br />
Multi-scale, multi-modal imaging and analysis approaches lead to a comprehensive understanding of<br />
the links between structure, chemistry and performance. This deep understanding paves the way towards<br />
designing novel materials and devices.<br />
In lithium-ion batteries (LiBs), for example, material features spanning across many orders affect the<br />
battery’s ultimate performance: measuring the LiB’s geometric architecture, inspecting the package of intact<br />
LiBs, quantifying particles, voids and porosity as well as mapping the chemical composition and reactivity<br />
on a micro or nanometer scale.<br />
Kerr microscopy allows for visualisation of magnetic domains in materials for new EV motors. For even<br />
higher magnifications, eg to characterise micro and nanometer scaled defects in battery electrode materials<br />
or when imaging sensitive material like graphite or polymers, an SEM with outstanding low-voltage<br />
performance provides robust information. Materials researchers profit from non-destructive inspection of<br />
the whole, intact battery when performing large-scale inspection in 3D or even 4D. Particle and void sizes or<br />
tortuosity inside of the battery can also be quantified with a high-resolution X-ray microscopy.<br />
48<br />
49
WASTE<br />
WASTE NOT<br />
WANT NOT<br />
USE-IT, a registered non-profit founded on the principle of a circular economy, creates jobs<br />
through waste recycling, reduction and diversion. <strong>Green</strong> <strong>Economy</strong> <strong>Journal</strong> caught up with them<br />
and learnt that one man’s trash is indeed another man’s treasure.<br />
Please outline the organisation’s background and how it is fulfils<br />
its stated objective.<br />
Located in Hammarsdale, the organisation is funded in part by the<br />
eThekwini Economic Development Unit (EDU). The priority of the<br />
EDU is job creation and while this aligns with USE-IT goals, it remains<br />
critical that relationships with other partners and funders are fostered<br />
to ensure the development and ongoing implementation of projects<br />
that align with the principles of the circular green economy.<br />
Job creation and entrepreneurship through waste diversion and<br />
beneficiation have become the key priorities, and USE-IT leverages<br />
resources to build opportunities in the green economy.<br />
How do you establish enterprise development for companies in<br />
South Africa?<br />
As an NPO/NGO, USE-IT operates in a collaborative environment,<br />
forming partnerships with organisations with synergistic objectives as<br />
well as sharing knowledge and resources.<br />
USE-IT would identify the opportunity or entrepreneur and help<br />
create a business that would utilise waste as a source of material<br />
within in their operation, either through beneficiation or upcycling or<br />
recycling. Once the product is developed and the business is established,<br />
we partner with Niya Consulting who are a multi-faceted organisation<br />
and business incubation that facilitates business strategies in the<br />
interest of growing the organisation. Niya provides clients, including<br />
start-ups and SMEs, with a platform to manage their processes<br />
effectively through best practice, staying abreast with ongoing changes<br />
in the sector landscape for sustainable future economies.<br />
This is done through an incubation programme housed at the<br />
Hammarsdale Waste Beneficiation Site. Each of these projects fall<br />
under our incubation program, we provide the technical assistance,<br />
operational space and administrative support. The aim is to incubate<br />
the business until it is a financially viable venture where they can then<br />
apply for finance to expand their operations off site.<br />
What are your current flagship projects?<br />
We have the following incubation programme:<br />
1. Owethu Umgele Sewing (funded through the Do More Foundation)<br />
who utilises waste textiles to make shopping bags, school backpacks<br />
and gym bags. Most of this material waste is derived from corporates<br />
through old banners and conference display materials. Once they<br />
are no longer of use to the corporates, the materials are donated to<br />
Owethu who use this waste to make new products.<br />
2. Home Deco Tech is a woodworking project that uses waste wood<br />
as its materials to manufacture custom-made furniture. Home<br />
Deco Tech is also sponsored by CHEP to supply educational toys<br />
made from its waste wood that are then in turn sponsored to Early<br />
Childhood Development Centres.<br />
3. KEY Bricks is an innovation that will manufacture an eco-block<br />
consisting of recycled materials such as glass and building rubble.<br />
This project will aim to create opportunities for local block<br />
manufacture close to the build site as the units are small-scale and<br />
easy to transport.<br />
We lend credibility to our funders<br />
through robust reporting and<br />
financial accountability.<br />
Where do you see the sector going within the upcoming five?<br />
How does USE-IT fit into this future?<br />
This is a long conversation … loadshedding is having a severe impact<br />
on the industry. Please read Detrimental effects of rolling blackouts<br />
on SA’s plastics industry on <strong>Green</strong><strong>Economy</strong>.Media<br />
The impact is felt especially by the waste collectors, we have been<br />
working together with the informal waste sector to integrate them<br />
into the formal sector. They remain at the lowest end of the value chain<br />
yet are responsible for 80% of what ends up being recycled. We have<br />
been establishing networks of waste collectors and setting up buyback<br />
centres close to them so that they can trade.<br />
An example of the benefits of this, previously a waste collector based<br />
in Hammarsdale would need to travel to Pinetown to sell their waste.<br />
That trip would cost R60. They could sell their waste for R140 (a full<br />
bulk bag of PET) and take home R80. By cutting out that cost of<br />
transport we have directly impacted the earning potential of that<br />
waste collector. It might seem like a small amount but it makes a huge<br />
difference in the lives of collectors.<br />
To try and change the big picture is overwhelming, so we focus<br />
on where we can make small changes that will have big impact and<br />
improve the lives of the people we work with.<br />
Is there anything that you would like to add?<br />
By working with an NPO like USE-IT, we lend credibility to our funders<br />
through robust reporting and financial accountability. Our track record<br />
has secured us funding for the past 10 years and we continue to provide<br />
impact for our funders.<br />
51
WASTE<br />
The role of asset managers in<br />
EFFECTIVE WASTE MANAGEMENT<br />
According to estimates, global waste generation will reach 2.2-billion tons by 2025. Shockingly,<br />
high-income countries, which account for 16% of global population, produce 34% of the world’s<br />
waste. And, only 15% to 20% of waste generated globally is recycled.<br />
BY SANLAM INVESTMENTS*<br />
One of the leading causes of waste pollution is inefficient<br />
production processes, product design and improper waste<br />
disposal practices, such as illegal dumping and ineffective<br />
waste collection services. Manufacturers need to understand<br />
and incorporate principles of circular economy in their design to<br />
ensure that their products maintain a level of value post use.<br />
It is estimated that South Africa alone generates about 122-million<br />
tons of waste a year, 90% of which still goes to landfills. Waste products<br />
that end up in landfills become an environmental and social cost<br />
to society, with little accountability from manufactures. We should<br />
move towards the principle of cradle-to-cradle, where there is greater<br />
accountability for product manufacturers in the waste value chain.<br />
Considering the impact of waste pollution on the environment,<br />
society and governance practices, what actions can investors take to<br />
mitigate these challenges?<br />
At Sanlam Investments, our approach has recognised investing<br />
in waste management as a core part of our sustainability strategy.<br />
Investing in innovative technologies a crucial role in improving<br />
waste management. This could include investing in companies that<br />
are developing new materials, technologies or business models that<br />
support a circular economy and reduce waste.<br />
To show Sanlam Investments’ commitment towards sustainable<br />
investments, SkipWaste recently became the private equity division’s<br />
fourth acquisition in the fund, following that of Cavalier Group,<br />
Absolute Pets and Q Link. SkipWaste has an integrated business model,<br />
spanning onsite waste management, primary storage, waste logistics,<br />
recycling and recovery as well as alternative disposal and conversion.<br />
With more than 1 000 clients and 3 000 sites primarily in Gauteng,<br />
SkipWaste is well-positioned to sustain its access to waste-at-source<br />
and the company’s ability to redirect more waste towards alternative<br />
forms of disposal.<br />
In addition to investing for impact, asset owners can engage with<br />
investee companies to encourage them to adopt sustainable practices,<br />
such as reducing waste, improving recycling and increasing their use<br />
of renewable energy. One practical measure is for companies to set<br />
specific, science-based and well-thought-out targets so that investors<br />
can track the company’s performance and hold management<br />
accountable. This not only has a positive impact on the environment<br />
but also influences the long-term financial performance of companies.<br />
Waste management contributes to achieving several United<br />
Nations Sustainable Development Goals (SDGs), including SDG 8,<br />
which focuses on promoting inclusive and continuous economic<br />
growth, full and productive employment as well as decent work<br />
for all.<br />
Waste management creates employment opportunities, particularly<br />
in low-income communities. According to Plastics SA the plastic<br />
industry provides some 60 000 informal jobs, many of whom are<br />
waste-pickers and collectors. This, in turn, helps to reduce poverty<br />
and increase economic growth.<br />
Viable waste management practices contribute to achieving SDG 12,<br />
which aims to ensure responsible consumption and production patterns.<br />
By reducing the amount of waste that ends up in landfills, waste<br />
management reduces greenhouse gas emissions and environmental<br />
pollution, thereby promoting a more sustainable future.<br />
Waste management contributes to the development of resilient<br />
infrastructure, which is critical for sustainable economic growth.<br />
Proper waste management helps to prevent environmental degradation<br />
and health hazards.<br />
Innovation is crucial in the fight for sustainability amidst the<br />
increasing environmental challenges worldwide. Entrepreneurs,<br />
innovators and researchers are developing new technologies,<br />
processes and products that reduce our impact on the planet. By<br />
supporting innovation and investment in waste management, asset<br />
managers drive progress towards a brighter and greener future.<br />
* Written by Johan Griesel, ESG and impact analyst, Sanlam Investments.<br />
ESG | MINING<br />
WATER | ENERGY<br />
INFRASTRUCTURE<br />
52
ENQUIRIES<br />
Contact Alexis Knipe: alexis@greeneconomy.media<br />
www.greeneconomy.media