Green Economy Journal Issue 58

Create successful ePaper yourself
Turn your PDF publications into a flip-book with our unique Google optimized e-Paper software.
ENERGY<br />
ENERGY<br />
Boosting the growth of the South African<br />
PPA market could alleviate pressure on<br />
Eskom to supply demand.<br />
• Reactive energy charges (c/kVArh) supplied more than 30% (0.96<br />
power factor or less) of the kWh recorded during peak and standard<br />
periods. The excess reactive energy is determined per 30-minute<br />
integrating period and is accumulated for the month applicable<br />
during the high-demand season.<br />
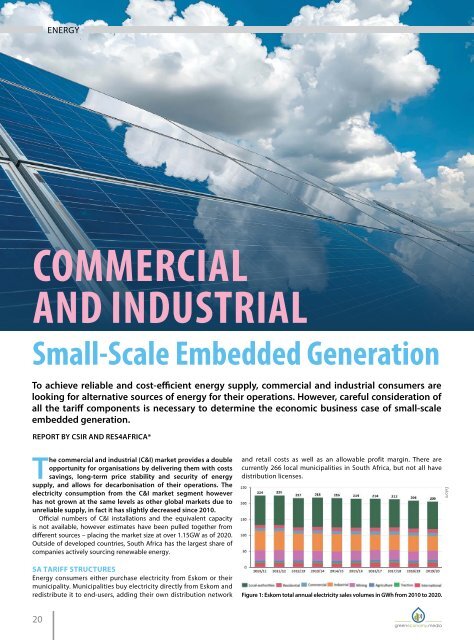
COMMERCIAL<br />
AND INDUSTRIAL<br />
Small-Scale Embedded Generation<br />
To achieve reliable and cost-efficient energy supply, commercial and industrial consumers are<br />
looking for alternative sources of energy for their operations. However, careful consideration of<br />
all the tariff components is necessary to determine the economic business case of small-scale<br />
embedded generation.<br />
Eskom<br />
Eskom C&I customers with a notified maximum demand (NMD)<br />
greater than 1MVA are typically on a time-of-use (TOU) tariff structure,<br />
namely the Megaflex tariff, while municipal licensees apply their own<br />
tariffs. All other customer segments who install small-scale embedded<br />
generation (SSEG) are required to move to a TOU structure.<br />
C&I customers who have installed grid-tied generation are moved<br />
to the Megaflex-Gen tariff (>22 kVA connections). On the Megaflex-<br />
Gen tariff, any excess energy fed into the grid that is not wheeled to<br />
another Eskom customer is credited at the Gen-offset tariff. If energy<br />
is wheeled to another Eskom customer (the off-taker), then the offtaker<br />
is credited at the Gen-wheeling tariff. The Megaflex tariff varies<br />
according to transmission zone, network connection size, maximum<br />
instantaneous demand and time of use (hour and season).<br />
Megaflex tariff components<br />
• Fixed charges (R/month) to recover overhead costs and prices<br />
that vary with customer-base size. These charges are based on<br />
the sum of the monthly utilised capacity at each point of delivery<br />
(POD) and administration charges.<br />
• Transmission, network and distribution demand charges<br />
(R/kW/month) to recover long-run marginal investments required<br />
to meet peak demand. These charges are based on the supply<br />
voltage, transmission zone and annual utilised capacity measured<br />
at the POD at all time periods. Excess network capacity charges<br />
are payable.<br />
• Energy charges (R/kWh) recover variable costs to meet the<br />
customer load. These are TOU differentiated active energy charges<br />
including losses based on supply voltage and the transmission<br />
zone of the customer. There are three TOU periods namely peak,<br />
standard and off-peak.<br />
• Ancillary service charges (c/kWh) based on the voltage of the<br />
supply applicable during all time periods.<br />
WEEKDAY TARIFF STRUCTURE<br />
Eskom and CSIR<br />
The Megaflex tariff incorporates three transparent cross-subsidies:<br />
i. The affordability subsidy funded by Eskom’s direct industrial and<br />
business customers and is calculated using the end-user’s total<br />
active energy demand.<br />
ii. The electrification and rural subsidy funded by Eskom’s direct<br />
industrial and business customers as well as municipalities and is<br />
calculated using the end-user’s total active energy demand.<br />
iii. The urban low voltage subsidy funded by all Eskom’s customers<br />
on urban tariffs that take supply at 66kV or higher. This cost is based<br />
on the voltage of the supply and charged on the annual utilised<br />
capacity measured at the POD applicable during all time periods.<br />
The actual revenue split between variable and fixed costs was<br />
determined in a cost-of-supply study (see figure 3) and demonstrates<br />
Eskom’s financial risk to declining energy volume sales. The average<br />
Figure 3. Eskom cost of supply and revenue share.<br />
ENERGY CHARGE (R/kWh)<br />
REPORT BY CSIR AND RES4AFRICA*<br />
The commercial and industrial (C&I) market provides a double<br />
opportunity for organisations by delivering them with costs<br />
savings, long-term price stability and security of energy<br />
supply, and allows for decarbonisation of their operations. The<br />
electricity consumption from the C&I market segment however<br />
has not grown at the same levels as other global markets due to<br />
unreliable supply, in fact it has slightly decreased since 2010.<br />
Official numbers of C&I installations and the equivalent capacity<br />
is not available, however estimates have been pulled together from<br />
different sources – placing the market size at over 1.15GW as of 2020.<br />
Outside of developed countries, South Africa has the largest share of<br />
companies actively sourcing renewable energy.<br />
SA TARIFF STRUCTURES<br />
Energy consumers either purchase electricity from Eskom or their<br />
municipality. Municipalities buy electricity directly from Eskom and<br />
redistribute it to end-users, adding their own distribution network<br />
and retail costs as well as an allowable profit margin. There are<br />
currently 266 local municipalities in South Africa, but not all have<br />
distribution licenses.<br />
Figure 1: Eskom total annual electricity sales volumes in GWh from 2010 to 2020.<br />
Eskom<br />
Figure 2. The Megaflex tariff. Notes: Megaflex Non-Local Authority tariff; transmission zone 66kV and 132kV. High season = Jun-Aug; low season =<br />
Sep-May. Notes: Megaflex Non-Local Authority tariff; transmission zone 66kV and 132kV. High season = Jun-Aug; low season = Sep-May.<br />
20<br />
21