Green Economy Journal Issue 58

You also want an ePaper? Increase the reach of your titles
YUMPU automatically turns print PDFs into web optimized ePapers that Google loves.
ENERGY<br />
ENERGY<br />
HIS Markit, Global Wind Energy Council, International Energy Agency, BloombergNEF, Kearney Analysis<br />
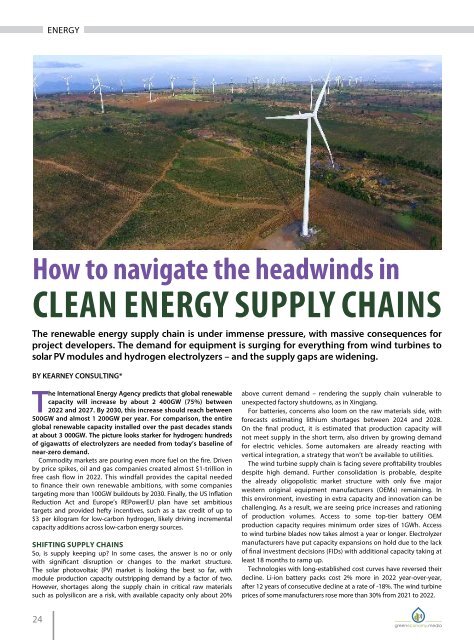
How to navigate the headwinds in<br />
CLEAN ENERGY SUPPLY CHAINS<br />
The renewable energy supply chain is under immense pressure, with massive consequences for<br />
project developers. The demand for equipment is surging for everything from wind turbines to<br />
solar PV modules and hydrogen electrolyzers – and the supply gaps are widening.<br />
BY KEARNEY CONSULTING*<br />
The International Energy Agency predicts that global renewable<br />
capacity will increase by about 2 400GW (75%) between<br />
2022 and 2027. By 2030, this increase should reach between<br />
500GW and almost 1 200GW per year. For comparison, the entire<br />
global renewable capacity installed over the past decades stands<br />
at about 3 000GW. The picture looks starker for hydrogen: hundreds<br />
of gigawatts of electrolyzers are needed from today’s baseline of<br />
near-zero demand.<br />
Commodity markets are pouring even more fuel on the fire. Driven<br />
by price spikes, oil and gas companies created almost $1-trillion in<br />
free cash flow in 2022. This windfall provides the capital needed<br />
to finance their own renewable ambitions, with some companies<br />
targeting more than 100GW buildouts by 2030. Finally, the US Inflation<br />
Reduction Act and Europe’s REPowerEU plan have set ambitious<br />
targets and provided hefty incentives, such as a tax credit of up to<br />
$3 per kilogram for low-carbon hydrogen, likely driving incremental<br />
capacity additions across low-carbon energy sources.<br />
SHIFTING SUPPLY CHAINS<br />
So, is supply keeping up? In some cases, the answer is no or only<br />
with significant disruption or changes to the market structure.<br />
The solar photovoltaic (PV) market is looking the best so far, with<br />
module production capacity outstripping demand by a factor of two.<br />
However, shortages along the supply chain in critical raw materials<br />
such as polysilicon are a risk, with available capacity only about 20%<br />
above current demand – rendering the supply chain vulnerable to<br />
unexpected factory shutdowns, as in Xingjang.<br />
For batteries, concerns also loom on the raw materials side, with<br />
forecasts estimating lithium shortages between 2024 and 2028.<br />
On the final product, it is estimated that production capacity will<br />
not meet supply in the short term, also driven by growing demand<br />
for electric vehicles. Some automakers are already reacting with<br />
vertical integration, a strategy that won’t be available to utilities.<br />
The wind turbine supply chain is facing severe profitability troubles<br />
despite high demand. Further consolidation is probable, despite<br />
the already oligopolistic market structure with only five major<br />
western original equipment manufacturers (OEMs) remaining. In<br />
this environment, investing in extra capacity and innovation can be<br />
challenging. As a result, we are seeing price increases and rationing<br />
of production volumes. Access to some top-tier battery OEM<br />
production capacity requires minimum order sizes of 1GWh. Access<br />
to wind turbine blades now takes almost a year or longer. Electrolyzer<br />
manufacturers have put capacity expansions on hold due to the lack<br />
of final investment decisions (FIDs) with additional capacity taking at<br />
least 18 months to ramp up.<br />
Technologies with long-established cost curves have reversed their<br />
decline. Li-ion battery packs cost 2% more in 2022 year-over-year,<br />
after 12 years of consecutive decline at a rate of -18%. The wind turbine<br />
prices of some manufacturers rose more than 30% from 2021 to 2022.<br />
www.zeiss.com<br />
Figure 1. The outlook for supply and demand differs depending on the type of renewable equipment. Note: PEM is polymer electrolyte membrane.<br />
Segmented 3D volume of a polymer electrolyte fuel cell membrane<br />
electrode assembly. Gas diffusion layer fibre weaves are visible in green<br />
and magenta, microporous layer in blue, catalyst in yellow and electrolyte<br />
membrane in red.<br />
ADAPTING TO CHANGE<br />
What will all this mean for renewable players, such as project<br />
developers? Without adapting your supply chain approach, it will<br />
be difficult to secure access to new technologies and volumes of<br />
renewable equipment on time and at cost. In this environment, the<br />
procurement approach will need to be tailored to the supply-demand<br />
dynamics in the respective technologies and markets (see figure 1).<br />
In wind energy, which is an already-concentrated industry, the<br />
balance of power will likely shift further toward the supply side, driven<br />
by additional OEM consolidation and more entrants fragmenting<br />
the demand side, such as oil and gas companies. Similarly in solar<br />
PV, additional concentration on the supply side is probable, while<br />
the already heavily-distributed demand will continue to fragment.<br />
The demand for ESG-conforming panels is surging in Europe,<br />
with the EU proposing a directive for corporate sustainability due<br />
diligence along value chains.<br />
The dynamics are harder to assess for hydrogen electrolyzers, a<br />
more nascent industry. In the short term, a few OEMs have already<br />
committed to or executed capacity expansions. Therefore, they will<br />
likely make up a large share of the supply potential in the next three<br />
to five years, giving them some power to allocate scarce volumes<br />
to the highest bidder. The demand side also has some power thanks<br />
to early-mover benefits. Firm FID-backed order commitments or equity<br />
investments are valuable to OEMs, allowing them to scale production<br />
and potentially build a cost leadership position as they move down<br />
the cost curve faster than other OEMs. Flagship projects with publicly<br />
announced OEMs might also mobilise more customers. This demandside<br />
benefit could wane in the medium term.<br />
Supply and demand dynamics provide a valuable indicator for<br />
24<br />
25