International Aquafeed Directory 2023-24
Welcome to the 27th edition of the International Aquafeed Directory & Buyers’ Guide 2023/24, the essential guide for everyone involved in the global aquafeed industry. Last year I wrote about the effects of the war, and the challenges resulting from rising fuel costs, but the industry showed great resilience. The impact of inflation and reduced consumer spending dampened growth in the market at the beginning of the year, but an expected increase in aquaculture production will compensate for a mall decline in wild catches. This edition contains information relating to 450+ businesses and over 850 products, coupled with useful and practical information including the extruder and expander guide. We would like to take this opportunity to thank all the businesses that have contributed to the completion of this directory. I also hope that all of our readers across the world remain safe and well.
Welcome to the 27th edition of the International Aquafeed Directory & Buyers’ Guide 2023/24, the essential guide for everyone involved in the global aquafeed industry.
Last year I wrote about the effects of the war, and the challenges resulting from rising fuel costs, but the industry showed great resilience. The impact of inflation and reduced consumer spending dampened growth in the market at the beginning of the year, but an expected increase in aquaculture production will compensate for a mall decline in wild catches.
This edition contains information relating to 450+ businesses and over 850 products, coupled with useful and practical information including the extruder and expander guide.
We would like to take this opportunity to thank all the businesses that have contributed to the completion of this directory. I also hope that all of our readers across the world remain safe and well.

Create successful ePaper yourself
Turn your PDF publications into a flip-book with our unique Google optimized e-Paper software.
10<br />
FAO GLOBAL FISH ECONOMY FAO<br />
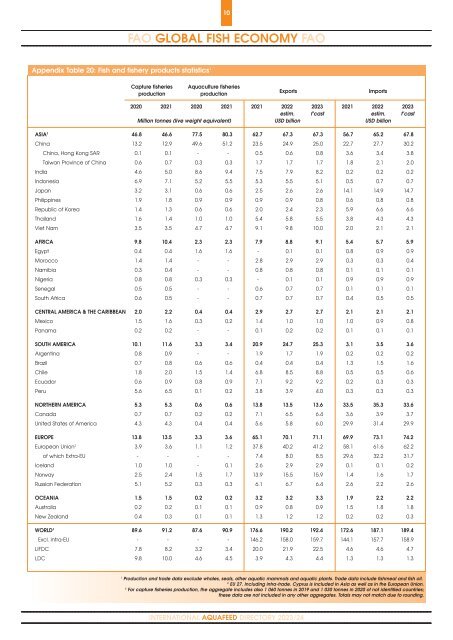
Appendix Table 20: Fish and fishery products statistics 1 Exports Imports<br />
Capture fisheries<br />
production<br />
Aquaculture fisheries<br />
production<br />
2020 2021 2020 2021 2021 2022 <strong>2023</strong> 2021 2022 <strong>2023</strong><br />
estim. fÊcast estim. fÊcast<br />
Million tonnes (live weight equivalent) USD billion USD billion<br />
ASIA 2 46.8 46.6 77.5 80.3 62.7 67.3 67.3 56.7 65.2 67.8<br />
China 13.2 12.9 49.6 51.2 23.5 <strong>24</strong>.9 25.0 22.7 27.7 30.2<br />
China, Hong Kong SAR 0.1 0.1 -D -D 0.5 0.6 0.8 3.6 3.4 3.8<br />
Taiwan Province of China 0.6 0.7 0.3 0.3 1.7 1.7 1.7 1.8 2.1 2.0<br />
India 4.6 5.0 8.6 9.4 7.5 7.9 8.2 0.2 0.2 0.2<br />
Indonesia 6.9 7.1 5.2 5.5 5.3 5.5 5.1 0.5 0.7 0.7<br />
Japan 3.2 3.1 0.6 0.6 2.5 2.6 2.6 14.1 14.9 14.7<br />
Philippines 1.9 1.8 0.9 0.9 0.9 0.9 0.8 0.6 0.8 0.8<br />
Republic of Korea 1.4 1.3 0.6 0.6 2.0 2.4 2.3 5.9 6.6 6.6<br />
Thailand 1.6 1.4 1.0 1.0 5.4 5.8 5.5 3.8 4.3 4.3<br />
Viet Nam 3.5 3.5 4.7 4.7 9.1 9.8 10.0 2.0 2.1 2.1<br />
AFRICA 9.8 10.4 2.3 2.3 7.9 8.8 9.1 5.4 5.7 5.9<br />
Egypt 0.4 0.4 1.6 1.6 -D 0.1 0.1 0.8 0.9 0.9<br />
Morocco 1.4 1.4 -D -D 2.8 2.9 2.9 0.3 0.3 0.4<br />
Namibia 0.3 0.4 -D -D 0.8 0.8 0.8 0.1 0.1 0.1<br />
Nigeria 0.8 0.8 0.3 0.3 -D 0.1 0.1 0.9 0.9 0.9<br />
Senegal 0.5 0.5 -D -D 0.6 0.7 0.7 0.1 0.1 0.1<br />
South Africa 0.6 0.5 -D -D 0.7 0.7 0.7 0.4 0.5 0.5<br />
CENTRAL AMERICA & THE CARIBBEAN 2.0 2.2 0.4 0.4 2.9 2.7 2.7 2.1 2.1 2.1<br />
Mexico 1.5 1.6 0.3 0.2 1.4 1.0 1.0 1.0 0.9 0.8<br />
Panama 0.2 0.2 -D -D 0.1 0.2 0.2 0.1 0.1 0.1<br />
SOUTH AMERICA 10.1 11.6 3.3 3.4 20.9 <strong>24</strong>.7 25.3 3.1 3.5 3.6<br />
Argentina 0.8 0.9 -D -D 1.9 1.7 1.9 0.2 0.2 0.2<br />
Brazil 0.7 0.8 0.6 0.6 0.4 0.4 0.4 1.3 1.5 1.6<br />
Chile 1.8 2.0 1.5 1.4 6.8 8.5 8.8 0.5 0.5 0.6<br />
Ecuador 0.6 0.9 0.8 0.9 7.1 9.2 9.2 0.2 0.3 0.3<br />
Peru 5.6 6.5 0.1 0.2 3.8 3.9 4.0 0.3 0.3 0.3<br />
NORTHERN AMERICA 5.3 5.3 0.6 0.6 13.8 13.5 13.6 33.5 35.3 33.6<br />
Canada 0.7 0.7 0.2 0.2 7.1 6.5 6.4 3.6 3.9 3.7<br />
United States of America 4.3 4.3 0.4 0.4 5.6 5.8 6.0 29.9 31.4 29.9<br />
EUROPE 13.8 13.5 3.3 3.6 65.1 70.1 71.1 69.9 73.1 74.2<br />
European Union 2 3.9 3.6 1.1 1.2 37.8 40.2 41.2 58.1 61.6 62.2<br />
of which Extra-EU -D -D -D -D 7.4 8.0 8.5 29.6 32.2 31.7<br />
Iceland 1.0 1.0 -D 0.1 2.6 2.9 2.9 0.1 0.1 0.2<br />
Norway 2.5 2.4 1.5 1.7 13.9 15.5 15.9 1.4 1.6 1.7<br />
Russian Federation 5.1 5.2 0.3 0.3 6.1 6.7 6.4 2.6 2.2 2.6<br />
OCEANIA 1.5 1.5 0.2 0.2 3.2 3.2 3.3 1.9 2.2 2.2<br />
Australia 0.2 0.2 0.1 0.1 0.9 0.8 0.9 1.5 1.8 1.8<br />
New Zealand 0.4 0.3 0.1 0.1 1.3 1.2 1.2 0.2 0.2 0.3<br />
WORLD 3 89.6 91.2 87.6 90.9 176.6 190.2 192.4 172.6 187.1 189.4<br />
Excl. intra-EU -D -D -D -D 146.2 158.0 159.7 144.1 157.7 158.9<br />
LIFDC 7.8 8.2 3.2 3.4 20.0 21.9 22.5 4.6 4.6 4.7<br />
LDC 9.8 10.0 4.6 4.5 3.9 4.3 4.4 1.3 1.3 1.3<br />
1<br />
Production and trade data exclude whales, seals, other aquatic mammals and aquatic plants. Trade data include fishmeal and fish oil.<br />
2<br />
EU 27. Including intra-trade. Cyprus is included in Asia as well as in the European Union.<br />
3<br />
For capture fisheries production, the aggregate includes also 1 060 tonnes in 2019 and 1 030 tonnes in 2020 of not identified countries;<br />
these data are not included in any other aggregates. Totals may not match due to rounding.<br />
INTERNATIONAL AQUAFEED DIRECTORY <strong>2023</strong>/<strong>24</strong>