An Assessment of Three Portable Peak Flow Meters* - Chest ...
An Assessment of Three Portable Peak Flow Meters* - Chest ...
An Assessment of Three Portable Peak Flow Meters* - Chest ...

Create successful ePaper yourself
Turn your PDF publications into a flip-book with our unique Google optimized e-Paper software.
Table 1-.Mini-Wright Meter<br />
<strong>Flow</strong> (Lpm) 120 180 300 480<br />
Overall 5 D%= -2.7<br />
Percentage <strong>of</strong> Discrepancy (D%)<br />
Instrument<br />
Mean<br />
D%<br />
1 18.1 24.8 11.8 #{149} 1.4 14.0<br />
2 8.1 16.5 7.7 1.9 8.6<br />
3 24.2 30.7 13.8 8.9 19.4<br />
4 26.4 38.3 Malfunctioned 32.4<br />
5 17.3 22.4 11.7 5.2 14.2<br />
Models 18.8 26.5 11.3 4.4<br />
Overall D%= 15.3<br />
Percentage <strong>of</strong> Discrepancy (D%)<br />
Table 2-Pulmonary Monitor<br />
<strong>Flow</strong> (Lpm) 120 180 300 480<br />
Instrument<br />
Mean<br />
D%<br />
1 -27.5 8.2 0.4 5.1 -3.7<br />
2 -45.4 -12.3 13.4 8.2 -9.0<br />
3 -55.7 -6.9 7.7 -2.2 -14.3<br />
4 -54:5 -7.4 2.4 -4.4 -16.0<br />
5 -55.3 -8.1 4.0 1.3 -145<br />
Model -47.7 -5.3 5.4 1.6<br />
Overall D%=-11.5<br />
Percentage <strong>of</strong> Discrepancy (D%)<br />
Table 3-<strong>Peak</strong> <strong>Flow</strong> Meter<br />
<strong>Flow</strong> (Lpm) 120 180 300 480<br />
Instrument<br />
Mean<br />
D%<br />
1 -1.9 -5.1 -1.9 -4.9 -3.5<br />
2 0.5 -1.1 0.0 0.7 0.0<br />
3 -6.4 -2.1 -4.2 -0.6 -3.3<br />
4 -7.4 0.6 1.3 0.4 -1.3<br />
5 -2.9 -4.1 -6.2 -8.3 -5.4<br />
Model -3.6 -2.4 -2.2 -2.5<br />
converted to percentages (percent discrepancy, D%).<br />
Under-readings, thus, were negative values compared to<br />
actual, while over-readings were positive. The mean D%<br />
for each <strong>of</strong> the five measurements at each flow rate for<br />
each instrument was then calculated. The mean D% for<br />
each flow range between instruments (inter-instrument<br />
variability) <strong>of</strong> similar manufacture, as well as the mean<br />
D% for all flows on a single instrument (intra-instrument<br />
20-<br />
10.<br />
w<br />
30.<br />
0<br />
U, -10-<br />
-20-<br />
-30-<br />
-40-<br />
-50-<br />
#{149}a-<br />
I<br />
I<br />
I<br />
I<br />
I<br />
-ARM<br />
10 240 360 480<br />
<strong>Flow</strong> (I/rn)<br />
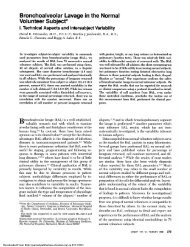
Ficunx 1. Inter-instrument variability, D%.<br />
RESULTS<br />
The percentage <strong>of</strong> discrepancy for each <strong>of</strong> the<br />
Armstrong, Vitalograph, and HealthScan peak flow<br />
meters are depicted in Tables 1-3. Intra-instrument,<br />
as well as inter-instrument means are also displayed.<br />
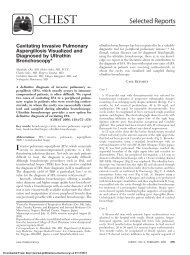
Graphic depictions <strong>of</strong> results are displayed for inter-<br />
instrument D% in Figure 1, and for intra-instrument<br />
D% in Figure 2. As can be seen, only the Health-<br />
Scan peak flow meter had acceptable mean interand<br />
intra-instrument D% <strong>of</strong> less than 5 percent.<br />
In testing the Armstrong Industries’ mini-Wright<br />
peak flow meter, one malfunctioned during the<br />
testing. The diaphragm became displaced from the<br />
cylindrical housing, and could not be manually<br />
replaced. Though the widest recorded ranges were<br />
>-<br />
C.)<br />
z<br />
aw<br />
C.)<br />
Cl)<br />
30-<br />
20’<br />
10<br />
-ARM<br />
-- VIT<br />
-.- HS-O<br />
variability) were then determined. Ficuas 2. Intra-instrument variability, D%.<br />
Downloaded From: http://journal.publications.chestnet.org/ on 01/02/2013<br />
1 __.-1#{149}-..,#{149} -I;_._44.. I<br />