An Assessment of Three Portable Peak Flow Meters* - Chest ...
An Assessment of Three Portable Peak Flow Meters* - Chest ...
An Assessment of Three Portable Peak Flow Meters* - Chest ...

You also want an ePaper? Increase the reach of your titles
YUMPU automatically turns print PDFs into web optimized ePapers that Google loves.
<strong>An</strong> <strong>Assessment</strong> <strong>of</strong> <strong>Three</strong> <strong>Portable</strong> <strong>Peak</strong> <strong>Flow</strong><br />
<strong>Meters*</strong><br />
M. S. Eichenhorn, M.D.; R. K. Beauchamp, R.-C.P.T.;f<br />
P. A. Harper, R.-C.P.T.;t and I. C. Ward, M.D.<br />
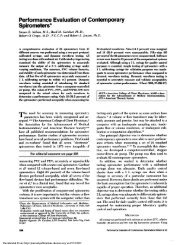
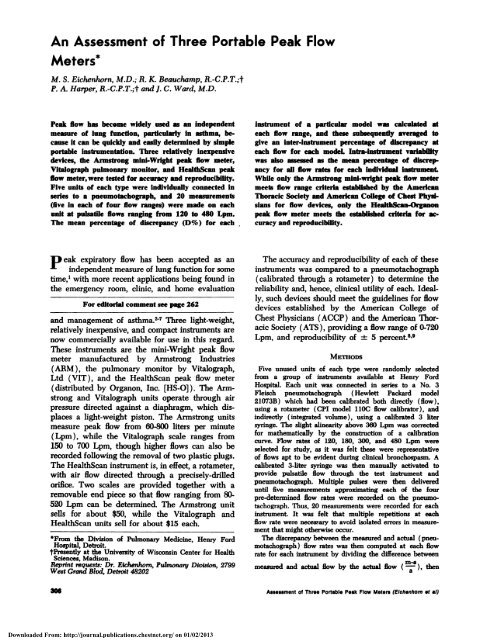
<strong>Peak</strong> flow has become widely used an independent<br />
measure <strong>of</strong> lung function, particularly In asthma, because<br />
It can be quickly and easily determined by simple<br />
portable lnsfrumentaflon. <strong>Three</strong> relatively inexpensive<br />
devices, the Armstrong mini-Wright peak flow meter,<br />
Vitalograph pulmonary monitor, and HealthScan peak<br />
flow meter, were tested for accuracy and reproducibility.<br />
Five units <strong>of</strong> each type were individually connected in<br />
series to a pneumotachograph, and 20 measurements<br />
(five in each <strong>of</strong> four flow ranges) were made on each<br />
unit at pulsatile flows ranging from 120 to 480 Lpm.<br />
The mean percentage <strong>of</strong> discrepancy (D%) for each<br />
P eak expiratory flow has been accepted as an<br />
independent measure <strong>of</strong> lung function for some<br />
time,’ with more recent applications being found in<br />
the emergency room, clinic, and home evaluation<br />
For editorial comment see page 262<br />
and management <strong>of</strong> asthma.27 <strong>Three</strong> light-weight,<br />
relatively inexpensive, and compact instruments are<br />
now commercially available for use in this regard.<br />
These instruments are the mini-Wright peak flow<br />
meter manufactured by Armstrong Industries<br />
(ARM ), the pulmonary monitor by Vitalograph,<br />
Ltd (VIT), and the HealthScan peak flow meter<br />
( distributed by Organon, Inc. [HS-O]). The Arm-<br />
strong and Vitalograph units operate through air<br />
pressure directed ‘against a diaphragm, which dis-<br />
places a light-weight piston. The Armstrong units<br />
measure peak flow from 60-800 liters per minute<br />
( Lpm), while the Vitalograph scale ranges from<br />
150 to 700 Lpm, though higher flows can also be<br />
recorded following the removal <strong>of</strong> two plastic plugs.<br />
The HealthScan instrument is, in effect, a rotameter,<br />
with air flow directed through a precisely-drilled<br />
orifice. Two scales are provided together with a<br />
removable end piece so that flow ranging from 80-<br />
520 Lpm can be determined. The Armstrong unit<br />
sells for about $50, while the Vitalograph and<br />
HealthScan units sell for about $15 each.<br />
#{176}Frornthe Division <strong>of</strong> Pulmonary Medicine, Henry Ford<br />
Hospital, Detroit.<br />
tPresently at the University <strong>of</strong> Wisconsin Center for Health<br />
Sciences. Madison.<br />
Reprint requests: Dr. Eichenhorn, Pulmonary DIVISIOn, 2799<br />
West Grand Blvd, Detroit 48202<br />
instrument <strong>of</strong> a particular model was calculated at<br />
each flow range, and these subsequendy averaged to<br />
give an inter-Instrument percentage <strong>of</strong> discrepancy at<br />
each flow for each modeL Intra-Instrument variability<br />
was also assessed as the mean percentage <strong>of</strong> discrep-<br />
ancy for all flow rates for each individual insfrument.<br />
While only the Armstrong mini-wright peak flow meter<br />
meets flow range criteria established by the American<br />
Thoracic Society and American College <strong>of</strong> <strong>Chest</strong> Physi-<br />
slans for flow devices, only the HealthScan-()rganon<br />
peak flow meter meets the established criteria for accuracy<br />
and reproducibility.<br />
The accuracy and reproducibility <strong>of</strong> each <strong>of</strong> these<br />
instruments was compared to a pneumotachograph<br />
(calibrated through a rotameter) to determine the<br />
reliability and, hence, clinical utility <strong>of</strong> each. Ideal-<br />
ly, such devices should meet the guidelines for flow<br />
devices established by the American College <strong>of</strong><br />
<strong>Chest</strong> Physicians (ACCP) and the American Thoracic<br />
Society (ATS ), providing a flow range <strong>of</strong> 0-720<br />
Lpm, and reproducibility <strong>of</strong> ± 5 percent.8’#{176}<br />
301 Assesament <strong>of</strong> Thre <strong>Portable</strong> <strong>Peak</strong> <strong>Flow</strong> Meters (E!chenhom at a!)<br />
Downloaded From: http://journal.publications.chestnet.org/ on 01/02/2013<br />
Mnmons<br />
Five unused units <strong>of</strong> each type were randomly selected<br />
from a group <strong>of</strong> instruments available at Henry Ford<br />
Hospital. Each unit was connected in series to a No. 3<br />
Fleisch pneumotachograph ( Hewlett Packard model<br />
21073B) which had been calibrated both directly (flow),<br />
using a rotameter (CPI model hOC flow calibrator), and<br />
indirectly ( integrated volume), using a calibrated 3 liter<br />
syringe. The slight alinearity above 360 Lpm was corrected<br />
for mathematically by the construction <strong>of</strong> a calibration<br />
curve. <strong>Flow</strong> rates <strong>of</strong> 120, 180, 300, and 480 Lpm were<br />
selected for study, as it was felt these were representative<br />
<strong>of</strong> flows apt to be evident during clinical bronchospasm. A<br />
calibrated 3-liter syringe was then manually activated to<br />
provide pulsatile flow through the test instrument and<br />
pneumotachograph. Multiple pulses were then delivered<br />
until five measurements approximating each <strong>of</strong> the four<br />
pre-determined flow rates were recorded on the pneumotachograph.<br />
Thus, 20 measurements were recorded for each<br />
instrument. It was felt that multiple repetitions at each<br />
flow rate were necessary to avoid isolated errors in measurement<br />
that might otherwise occur.<br />
The discrepancy between the measured and actual (pneumotachograph)<br />
flow rates was then computed at each flow<br />
rate for each instrument by dividing the difference between<br />
measured and actual flow by the actual flow ( , then
Table 1-.Mini-Wright Meter<br />
<strong>Flow</strong> (Lpm) 120 180 300 480<br />
Overall 5 D%= -2.7<br />
Percentage <strong>of</strong> Discrepancy (D%)<br />
Instrument<br />
Mean<br />
D%<br />
1 18.1 24.8 11.8 #{149} 1.4 14.0<br />
2 8.1 16.5 7.7 1.9 8.6<br />
3 24.2 30.7 13.8 8.9 19.4<br />
4 26.4 38.3 Malfunctioned 32.4<br />
5 17.3 22.4 11.7 5.2 14.2<br />
Models 18.8 26.5 11.3 4.4<br />
Overall D%= 15.3<br />
Percentage <strong>of</strong> Discrepancy (D%)<br />
Table 2-Pulmonary Monitor<br />
<strong>Flow</strong> (Lpm) 120 180 300 480<br />
Instrument<br />
Mean<br />
D%<br />
1 -27.5 8.2 0.4 5.1 -3.7<br />
2 -45.4 -12.3 13.4 8.2 -9.0<br />
3 -55.7 -6.9 7.7 -2.2 -14.3<br />
4 -54:5 -7.4 2.4 -4.4 -16.0<br />
5 -55.3 -8.1 4.0 1.3 -145<br />
Model -47.7 -5.3 5.4 1.6<br />
Overall D%=-11.5<br />
Percentage <strong>of</strong> Discrepancy (D%)<br />
Table 3-<strong>Peak</strong> <strong>Flow</strong> Meter<br />
<strong>Flow</strong> (Lpm) 120 180 300 480<br />
Instrument<br />
Mean<br />
D%<br />
1 -1.9 -5.1 -1.9 -4.9 -3.5<br />
2 0.5 -1.1 0.0 0.7 0.0<br />
3 -6.4 -2.1 -4.2 -0.6 -3.3<br />
4 -7.4 0.6 1.3 0.4 -1.3<br />
5 -2.9 -4.1 -6.2 -8.3 -5.4<br />
Model -3.6 -2.4 -2.2 -2.5<br />
converted to percentages (percent discrepancy, D%).<br />
Under-readings, thus, were negative values compared to<br />
actual, while over-readings were positive. The mean D%<br />
for each <strong>of</strong> the five measurements at each flow rate for<br />
each instrument was then calculated. The mean D% for<br />
each flow range between instruments (inter-instrument<br />
variability) <strong>of</strong> similar manufacture, as well as the mean<br />
D% for all flows on a single instrument (intra-instrument<br />
20-<br />
10.<br />
w<br />
30.<br />
0<br />
U, -10-<br />
-20-<br />
-30-<br />
-40-<br />
-50-<br />
#{149}a-<br />
I<br />
I<br />
I<br />
I<br />
I<br />
-ARM<br />
10 240 360 480<br />
<strong>Flow</strong> (I/rn)<br />
Ficunx 1. Inter-instrument variability, D%.<br />
RESULTS<br />
The percentage <strong>of</strong> discrepancy for each <strong>of</strong> the<br />
Armstrong, Vitalograph, and HealthScan peak flow<br />
meters are depicted in Tables 1-3. Intra-instrument,<br />
as well as inter-instrument means are also displayed.<br />
Graphic depictions <strong>of</strong> results are displayed for inter-<br />
instrument D% in Figure 1, and for intra-instrument<br />
D% in Figure 2. As can be seen, only the Health-<br />
Scan peak flow meter had acceptable mean interand<br />
intra-instrument D% <strong>of</strong> less than 5 percent.<br />
In testing the Armstrong Industries’ mini-Wright<br />
peak flow meter, one malfunctioned during the<br />
testing. The diaphragm became displaced from the<br />
cylindrical housing, and could not be manually<br />
replaced. Though the widest recorded ranges were<br />
>-<br />
C.)<br />
z<br />
aw<br />
C.)<br />
Cl)<br />
30-<br />
20’<br />
10<br />
-ARM<br />
-- VIT<br />
-.- HS-O<br />
variability) were then determined. Ficuas 2. Intra-instrument variability, D%.<br />
Downloaded From: http://journal.publications.chestnet.org/ on 01/02/2013<br />
1 __.-1#{149}-..,#{149} -I;_._44.. I<br />
noted on this particular instrument prior to mal-<br />
function, elimination <strong>of</strong> all data from the defective<br />
instrument would not significantly alter the net<br />
results for the model as a whole.<br />
The Vitalograph pulmonary monitor data are ob-<br />
viously biased by extremely poor performance at the<br />
120 Lpm flow range. The instrument scale begins at<br />
150 Lpm, and hence, results were extrapolated back<br />
to include the 120 Lpm range, assuming the same<br />
linearity <strong>of</strong> scale to apply at flows below, as well as<br />
above the scale minimum. This may not, in fact, be<br />
the case. The length-tension relationship <strong>of</strong> the<br />
spring within the cannister may be such that quite<br />
a large initial force must be directed to overcoming<br />
inertia. Hence, all flow measurements at 120 Lpm<br />
may have little validity.<br />
Ignoring the flows at 120 Lpm, the Vitalograph<br />
pulmonary monitor’s performance improves signifi-<br />
cantly. The instrument tends to underestimate flows<br />
at 180 Lpm, and overestimate flows above this<br />
range. Though inter-instrument and intra-instrument<br />
mean percentages <strong>of</strong> discrepancy meet ACCP and<br />
ATS standards (0.57 and 2.2, respectively), this was<br />
achieved only through wide variation in D% at the<br />
180 Lpm flow range. No single percentage <strong>of</strong> dis-<br />
crepancy met the established standards at this<br />
range, though there were sufficient positive and<br />
negative values so that the mean that resulted was<br />
acceptable. Likewise, though intra-instrument van-<br />
ability was acceptable, this was <strong>of</strong>ten the result <strong>of</strong><br />
averaging significantly varied individual results (in-<br />
struments 2 and 3 especially). This factor limits<br />
model acceptability.<br />
The HealthScan peak flow meter performed more<br />
uniformly. Though some units tended to vary from<br />
actual readings at either high or low flow ranges,<br />
there were no wide swings in results evident as was<br />
the case for the Vitalograph product. HealthScan<br />
instruments generally tended toward slight under-<br />
estimation <strong>of</strong> true values. Overall, both inter- and<br />
intra-instrument accuracy was quite good.<br />
DiscussioN<br />
Results <strong>of</strong> peak flow measurements are now widely<br />
accepted for following the course <strong>of</strong> bronchial<br />
asthma.7 Alterations in peak flow provide an ob-<br />
jective means <strong>of</strong> documenting patient status, and<br />
with the development <strong>of</strong> portable instrumentation<br />
to achieve this purpose, close monitoring <strong>of</strong> pulmo-<br />
nary function at home can be made. <strong>Three</strong> light-<br />
weight, inexpensive devices for peak flow measure-<br />
ment are currently widely marketed as described.<br />
Ideally, these devices should meet ATS and ACCP<br />
standards. The results <strong>of</strong> our studies performed at<br />
varying flow rates for multiple instruments support<br />
the accuracy and reproducibility <strong>of</strong> only the Health-<br />
Scan instrument, though only the Armstrong unit<br />
meets the established criteria for flow range.<br />
Prior documentation <strong>of</strong> performance <strong>of</strong> both the<br />
Armstrong and Vitalograph products have been<br />
previously described. In the original description<br />
<strong>of</strong> the Armstrong mini-Wright device, documentation<br />
<strong>of</strong> an underestimation <strong>of</strong> peak flow <strong>of</strong> 17 per-<br />
cent was made, though allowance for this was pro-<br />
vided in calibration.’#{176} Subsequent studies showed<br />
correlation between the standard Wright and mini-<br />
Wright peak flow meters, but the study design in-<br />
volved the comparison <strong>of</strong> separate maximal efforts<br />
by a trained subject into each device, rather than<br />
recording flow in series into both, as done in our<br />
study.” This may have introduced some variability<br />
in the actual flow delivered, since the studies as-<br />
sumed the subject produced the exact peak flow<br />
each time. Likewise, significant variation between<br />
instruments for presumably similar flows was also<br />
documented. Perks et al’2 also found significant<br />
inter-instrument variability for the mini-Wright<br />
unit, but felt that this difference remained constant<br />
for any given machine so that deviations in measurements<br />
were valid, though exact accuracy was not<br />
necessarily so.<br />
Similar studies are also available for the Vitalo-<br />
graph pulmonary monitor. When initially described,<br />
arbitrary units <strong>of</strong> measurements were used, rather<br />
than liters per minute, which probably limited<br />
clinical utilization.13 When revised to provide read-<br />
lug in Lpm, Perks et al’ found fair correlation with<br />
a standard Wright peak flow meter ( again on suc-<br />
cessive peak flow maneuvers, rather than in series),<br />
but again found significant inter-instrument varia-<br />
bility. They also stated that the inability to meas-<br />
ure flows below 150 Lpm would limit the clinical<br />
utility <strong>of</strong> the unit. This is particularly apt to be<br />
true in management <strong>of</strong> asthma.3<br />
Burns15 compared the Armstrong and Vitalograph<br />
products and found that significant errors <strong>of</strong> estimate<br />
existed for both devices, being larger for the<br />
pulmonary monitor. He concluded that though the<br />
accuracy <strong>of</strong> both devices was low, they could be <strong>of</strong><br />
use in determining discrete peak flow changes from<br />
308 <strong>Assessment</strong> <strong>of</strong> <strong>Three</strong> <strong>Portable</strong> <strong>Peak</strong> <strong>Flow</strong> Meters (E!chenhorn .t a!)<br />
Downloaded From: http://journal.publications.chestnet.org/ on 01/02/2013<br />
baseline.<br />
Our studies support the inter-instrument van-<br />
ability <strong>of</strong> both the Armstrong and Vitalograph de-<br />
vices when compared to a pneumotachograph.<br />
Likewise, significant intra-instrument variability ex-<br />
ists for both devices. Much <strong>of</strong> the problem in accu-<br />
racy and reproducibility may stem from the design<br />
<strong>of</strong> both which utilizes a single expanding spring to<br />
measure flow. Variability <strong>of</strong> the length-tension rela-<br />
tionship for any particular spring might well be
expected.<br />
On the other hand, the HealthScan peak flow<br />
meter operates as a rotameter. Though inaccuracies<br />
could result from imprecision in establishing orifice<br />
size, this does not seem to be the case, as only this<br />
device meets ATS and ACCP standards, both in<br />
inter- and intra-measurement studies. Though removing<br />
the end-piece to permit scale changes may<br />
be an inconvenience, at this time, only the Health-<br />
Scan-Organon instrument seems sufficiently accu-<br />
rate to be recommended for clinical use, recogniz-<br />
ing, however, its inability to record flows greater<br />
than 520 Lpm.<br />
Rmiucs<br />
1 Wright BM, McKerrow CB. Maximum forced expiratory<br />
flow rate as a measure <strong>of</strong> ventilatory capacity. Br Med<br />
J 1959; 2:1041-47<br />
2 Hetzel MR, Clark TJH, Branthwaite MA. Asthma:<br />
<strong>An</strong>alysis <strong>of</strong> sudden deaths and ventilatory arrests in<br />
hospitaL Br Med J 1977; 1:808-11<br />
3 Banner AS, Shah RS, Addington WW. Rapid prediction<br />
<strong>of</strong> need for hospitalization in acute asthma. JAMA 1976;<br />
235:1337-38<br />
4 Nowak RM, Pensler MI, Sarkar DD, <strong>An</strong>derson JA, Kvale<br />
PA, Ortiz AE, et aL Comparison <strong>of</strong> peak expiratory flow<br />
and FEV1 : Admission criteria for acute bronchial asthma.<br />
<strong>An</strong>n Emergency Med 1982; 11:64-69<br />
Downloaded From: http://journal.publications.chestnet.org/ on 01/02/2013<br />
S Murray AB, HardWick DF, Pine GE, Fraser BM. Assessing<br />
severity <strong>of</strong> asthma with Wright peak flow meter.<br />
Lancet 1977; 1:708<br />
6 Taplin PS, Creer TL. A procedure for using peak expiratory<br />
flow rate data to increase the predictability <strong>of</strong><br />
asthma episodes. J Asthma Res 1978; 16:15-19<br />
7 Hetzel MR, Williams IP, Shakespeare RM. Can patients<br />
keep their own peak flow records reliably? Lancet 1979;<br />
1:597-99<br />
8 Permutt S, <strong>Chest</strong>er E, <strong>An</strong>derson W, Cugell D, Petty<br />
TL, Sharp JT. Office spirometry in clinical practice.<br />
<strong>Chest</strong> 1978; 74:298<br />
9 Gardner RM, Baker CD, Broennie AM, Burrows B, Ferris<br />
BG, Gaensler EA, et aL ATS statement-Snowbird workshop<br />
on standardization <strong>of</strong> spirometry. Am Rev Respir<br />
Dis 1979; 119:831-38<br />
10 Wright BM. A miniature Wright-peak flow meter. Br<br />
Med J 1978; 2:1627-28<br />
11 Brown LA, Sly RM. Comparison <strong>of</strong> mini-Wright and<br />
standard Wright peak flow meters. <strong>An</strong>n Allergy 1980;<br />
45:72-74<br />
12 Perks WH, Tams IP, Thompson DA, Prowse K. <strong>An</strong><br />
evaluation <strong>of</strong> the mini-Wright peak flow meter. Thorax<br />
1979; 34:79-81<br />
13 Haydu SP, Chapman Ti’, Hughes DTD. Pulmonary<br />
monitor for assessment <strong>of</strong> airways obstruction. Lancet<br />
1976; 2: 12.25-26<br />
14 Perks WH, Cole M, Steventon 1W, Tams IF, Prowse E<br />
<strong>An</strong> evaluation <strong>of</strong> the Vitalograph pulmonary monitor.<br />
Br J Dis <strong>Chest</strong> 1981; 75:161-64<br />
15 Burns KL. <strong>An</strong> evaluation <strong>of</strong> two instruments for assesslug<br />
airway flow. <strong>An</strong>n Allergy 1979; 43:246-49<br />
CHEST I 82 1 3 I SEPTEMBER, 1982 309