R&D on Hydrogen Production by Autothermal Reforming
R&D on Hydrogen Production by Autothermal Reforming
R&D on Hydrogen Production by Autothermal Reforming

You also want an ePaper? Increase the reach of your titles
YUMPU automatically turns print PDFs into web optimized ePapers that Google loves.
2002.08.sin 2.3<br />
R&D <strong>on</strong> <strong>Hydrogen</strong> Producti<strong>on</strong> <strong>by</strong> <strong>Autothermal</strong> <strong>Reforming</strong><br />
(Shinnen Satte Laboratory)<br />
� Takashi Suzuki, Katsumi Miyamoto, Shuichi Kobayashi,<br />
Noriyuki Aratani, Tomoyuki Yogo<br />
1. R&D Objectives<br />
The purpose of the present R&D is to develop high-efficiency hydrogen producti<strong>on</strong> technology<br />
through reforming of naphtha fracti<strong>on</strong> to kerosene fracti<strong>on</strong>, including GTL oil, etc. Another aim is<br />
to investigate the c<strong>on</strong>stituents that make up the raw material hydrocarb<strong>on</strong>s and reforming<br />
characteristics. The R&D is scheduled to take place over 5 years from JFY2000 to JFY2004. As<br />
part of this R&D program, the Shinnen Satte Laboratory will endeavor to develop technological<br />
processes involving the autothermal reforming method, to investigate the reforming<br />
characteristics of naphtha fracti<strong>on</strong> to kerosene fracti<strong>on</strong>, including GTL oil, etc., and to develop<br />
desulfurizati<strong>on</strong> catalyst and processes essential for removing sulfur compounds in everything<br />
from naphtha to kerosene fracti<strong>on</strong>.<br />
2. R&D C<strong>on</strong>tents<br />
The c<strong>on</strong>tents of R&D c<strong>on</strong>ducted are summarized below.<br />
Design of autothermal reforming process<br />
Basic establishment of <strong>Autothermal</strong> <strong>Reforming</strong> - Fuel Processing System<br />
Development of autothermal reforming catalyst<br />
Investigati<strong>on</strong> of hydrocarb<strong>on</strong> c<strong>on</strong>stituents in fuel and of autothermal reforming<br />
characteristics<br />
Development of catalytic desulfurizati<strong>on</strong> process<br />
3. R&D Results<br />
3.1 Design of <strong>Autothermal</strong> <strong>Reforming</strong> Process<br />
3.1.1 Basic Establishment of <strong>Autothermal</strong> <strong>Reforming</strong> - Fuel Processing System<br />
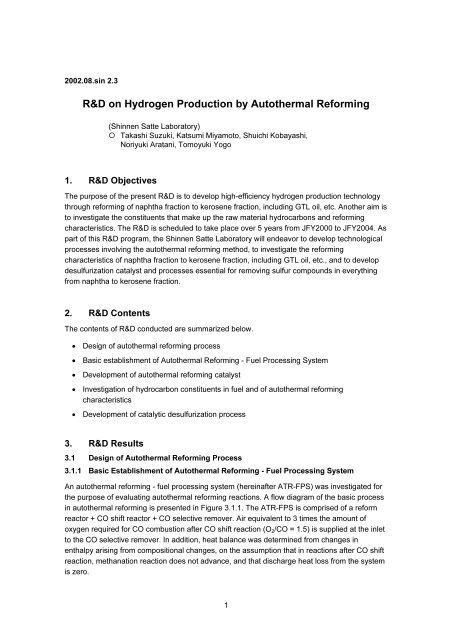
An autothermal reforming - fuel processing system (hereinafter ATR-FPS) was investigated for<br />
the purpose of evaluating autothermal reforming reacti<strong>on</strong>s. A flow diagram of the basic process<br />
in autothermal reforming is presented in Figure 3.1.1. The ATR-FPS is comprised of a reform<br />
reactor + CO shift reactor + CO selective remover. Air equivalent to 3 times the amount of<br />
oxygen required for CO combusti<strong>on</strong> after CO shift reacti<strong>on</strong> (O2/CO = 1.5) is supplied at the inlet<br />
to the CO selective remover. In additi<strong>on</strong>, heat balance was determined from changes in<br />
enthalpy arising from compositi<strong>on</strong>al changes, <strong>on</strong> the assumpti<strong>on</strong> that in reacti<strong>on</strong>s after CO shift<br />
reacti<strong>on</strong>, methanati<strong>on</strong> reacti<strong>on</strong> does not advance, and that discharge heat loss from the system<br />
is zero.<br />
1
Raw<br />
material<br />
Reformer<br />
Shift<br />
2<br />
CO<br />
removal<br />
Figure 3.1.1: Flow Diagram of <strong>Autothermal</strong> <strong>Reforming</strong> Process<br />
3.1.2 Establishment of Oxygen/Carb<strong>on</strong> Ratio and Steam/Carb<strong>on</strong> Ratio<br />
In determining the oxygen/carb<strong>on</strong> (hereinafter O2/C) ratio and the steam/carb<strong>on</strong> (hereinafter<br />
S/C) ratio supplied to ATR-FPS, O2/C and S/C were adjusted <strong>by</strong> equilibrium calculati<strong>on</strong> so that<br />
the total of heat absorpti<strong>on</strong>/generati<strong>on</strong> from each reactor and of heat exchange required for<br />
reaching each reacti<strong>on</strong> temperature becomes 0-1 [kJ/mol-crude oil] in the entire ATR-FPS with<br />
autothermal reforming + CO shift + CO selective removal. System internal pressure is 1.033<br />
kg/cm 2 and each reactor is isothermal. Taking normal decane as an example, the relati<strong>on</strong>ship<br />
between S/C and O2/C obtained <strong>by</strong> equilibrium calculati<strong>on</strong> when the autothermal reforming<br />
reacti<strong>on</strong> temperature was set at 650°C is shown in Figure 3.1.2. In the figure, when O2/C is 0.45,<br />
if S/C is set to 2.37, the heat balance of ATR-FPS as a whole becomes –0.36 kJ/mol-nC10.<br />
In evaluating catalytic activity or comparing the autothermal reforming reactivity of each fuel oil,<br />
standard c<strong>on</strong>diti<strong>on</strong>s of O2/C and S/C must be set up. In making these settings, the following two<br />
setting standards must be satisfied because with the current power generati<strong>on</strong> system, with<br />
PEMFC built in, unless the CO c<strong>on</strong>centrati<strong>on</strong> in gas at the CO shift reactor outlet is less than 0.5<br />
vol%, it will be difficult to have the CO c<strong>on</strong>centrati<strong>on</strong> reach under 10 ppm at the CO selective<br />
remover at a later stage. Another reas<strong>on</strong> is that it is important to have the c<strong>on</strong>centrati<strong>on</strong> of<br />
hydrogen in generated gas as high as possible.<br />
(1) CO c<strong>on</strong>centrati<strong>on</strong> in CO shift outlet gas must be less than 0.5 vol%.<br />
(2) O2/C must be as low as possible.<br />
Taking normal decane as an example, Figure 3.1.3 shows the relati<strong>on</strong>ship between O2/C<br />
obtained <strong>by</strong> equilibrium calculati<strong>on</strong> and CO c<strong>on</strong>centrati<strong>on</strong> at shift reacti<strong>on</strong> outlet when the<br />
autothermal reforming reacti<strong>on</strong> temperature was set at 650°C. It was clarified that when O2/C<br />
was set at 0.45, the two aforesaid standards are satisfied. It was also c<strong>on</strong>firmed that similar<br />
results obtain with raw material hydrocarb<strong>on</strong> other than normal decane.
Figure 3.1.2: O2/C Ratio vs S/C Ratio<br />
Obtained <strong>by</strong> Equilibrium<br />
Calculati<strong>on</strong><br />
(n-decane, 650°C)<br />
3.1.3 Investigati<strong>on</strong> of <strong>Hydrogen</strong> Producti<strong>on</strong> <strong>on</strong> 1 Nm 3 /hr Scale<br />
Total heat balance (kJ/mol-nC10)<br />
3<br />
CO c<strong>on</strong>centrati<strong>on</strong> (vol%) after shift (250°C)<br />
CO c<strong>on</strong>centrati<strong>on</strong><br />
upper limit:<br />
Figure 3.1.3: O2/C Obtained <strong>by</strong><br />
Equilibrium Calculati<strong>on</strong> vs<br />
CO C<strong>on</strong>centrati<strong>on</strong> at Shift<br />
Reacti<strong>on</strong> Outlet<br />
(n-decane, 650°C): CO<br />
C<strong>on</strong>centrati<strong>on</strong> Upper Limit at CO<br />
Selective Remover Inlet After<br />
Shift (estimated value)<br />
With normal decane equivalent to kerosene fracti<strong>on</strong> taken as the raw material, with throughput<br />
at 240 ml/hr, and with O2/C set at 0.45 and S/C at 2.37 as indicated in Secti<strong>on</strong> 3.1.2, hydrogen<br />
producti<strong>on</strong> at 1 Nm 3 /hr was implemented using a fixed-bed, flow-type unit for evaluating the<br />
activity of heat-resistant reactor equipment. Used as the catalyst was autothermal reforming<br />
catalyst A (hereinafter ATR catalyst A), obtained as a result of investigati<strong>on</strong> of partial oxidati<strong>on</strong><br />
reacti<strong>on</strong> and preliminary investigati<strong>on</strong> of autothermal reforming c<strong>on</strong>ducted in the previous fiscal<br />
year. Using for reacti<strong>on</strong>s the gas generated after autothermal reforming reacti<strong>on</strong>, reforming<br />
reactivity was evaluated from the gasificati<strong>on</strong> rate that indicates the percentage of c<strong>on</strong>versi<strong>on</strong> of<br />
normal decane to CO, CO2 and C4 hydrocarb<strong>on</strong> or below, and from the C2-C4 hydrocarb<strong>on</strong><br />
selecti<strong>on</strong> rate that indicates the percentage of c<strong>on</strong>versi<strong>on</strong> to hydrocarb<strong>on</strong> of C4 or below.<br />
Because CO is denatured to H2 of equivalent mol volume in the post-stage shift reactor of an<br />
autothermal reformer, H2 + CO yield and H2 + CO producti<strong>on</strong> volume were used to evaluate<br />
hydrogen producti<strong>on</strong>.<br />
Shown in Figure 3.1.4 is the temperature distributi<strong>on</strong> of catalytic layer in autothermal reform<br />
reacti<strong>on</strong>. Heat generati<strong>on</strong> can be seen at the upper catalytic layer, and it was c<strong>on</strong>firmed that<br />
oxidati<strong>on</strong> reacti<strong>on</strong> progresses <strong>on</strong> the catalyst.<br />
Next, the impact of reacti<strong>on</strong> temperature was investigated. Gasificati<strong>on</strong> rate and C2-C4<br />
hydrocarb<strong>on</strong> selecti<strong>on</strong> rate are shown in Figure 3.1.5, while hydrogen yield and hydrogen<br />
producti<strong>on</strong> volume are shown in Figure 3.1.6. Gasificati<strong>on</strong> rate increases as temperature rises,<br />
and with normal decane at around 700°C, gasificati<strong>on</strong> of 97% or more took place. It was also<br />
recognized that when the reacti<strong>on</strong> temperature rises, the types of hydrocarb<strong>on</strong> produced without<br />
complete reforming tend to decrease. In this way it was c<strong>on</strong>firmed that as the reacti<strong>on</strong><br />
temperature rises, hydrogen yield and hydrogen producti<strong>on</strong> volume increase, gradually<br />
approaching the equilibrium value.
Gasificati<strong>on</strong> rate (%)<br />
Temperature (°C)<br />
4<br />
Time (hr)<br />
Upper catalyst<br />
layer<br />
Middle catalyst<br />
layer<br />
Lower catalyst<br />
layer<br />
Figure 3.1.4: Catalyst Layer Temperature Distributi<strong>on</strong> (650°C) in<br />
<strong>Autothermal</strong> <strong>Reforming</strong> Reacti<strong>on</strong> at 1 Nm 3 /hr<br />
Gasificati<strong>on</strong> rate (%)<br />
C2-C4 selecti<strong>on</strong> rate<br />
Reacti<strong>on</strong> temperature (°C)<br />
Figure 3.1.5: Impact of Reacti<strong>on</strong><br />
Temperature <strong>on</strong><br />
Gasificati<strong>on</strong> Rate and<br />
C2-C4 Hydrocarb<strong>on</strong><br />
Selecti<strong>on</strong> Rate<br />
C2-C4 selecti<strong>on</strong> rate (%)<br />
(H2 + CO) yield (%)<br />
Reacti<strong>on</strong> temperature (°C)<br />
Equilibrium<br />
value<br />
Equilibrium<br />
value<br />
Figure 3.1.6: Impact of Reacti<strong>on</strong><br />
Temperature <strong>on</strong> <strong>Hydrogen</strong><br />
Yield and <strong>Hydrogen</strong><br />
Producti<strong>on</strong> Volume<br />
3.2 Basic Design of <strong>Autothermal</strong> <strong>Reforming</strong> - Fuel Processing System<br />
3.2.1 ATR-FPS Basic Design<br />
(1) ATR-FPS outline and design c<strong>on</strong>diti<strong>on</strong>s<br />
ATR-FPS is a hydrogen producti<strong>on</strong> process that uses the autothermal reforming method. In the<br />
latest investigati<strong>on</strong>, two units each of shift and selective oxidati<strong>on</strong> reactor were installed so that<br />
CO shift or selective removal would be accomplished more securely. The ATR-FPS flow<br />
process is shown in Figure 3.2.1.<br />
(H2 + CO) Producti<strong>on</strong> Volume (Nm 3 /hr)
Figure 3.2.1: ATR-FPS Flow Diagram<br />
(2) Raw material specificati<strong>on</strong>s<br />
5<br />
<strong>Autothermal</strong> reform type<br />
hydrogen producti<strong>on</strong><br />
Reactor system<br />
Flow sheet<br />
In the latest investigati<strong>on</strong>, the crude oil compositi<strong>on</strong> ratio used was<br />
n-decane:n-butyl-cyclohexane:diethyl benzene (= 64:16:20 mol%); crude oil molecular formula<br />
was C11.3H22.3; crude oil molecular volume was 158.55; crude oil density (25°C) was 756.6 kg/m 3 ,<br />
and crude oil flow volume was 380 ml/hr (= 287.6 g/hr = 1.813 gmol/hr). Steam and air supplied<br />
for reforming were each set at O2/C = 0.45 and S/C = 2.44, the c<strong>on</strong>diti<strong>on</strong>s for attaining heat<br />
balance. In additi<strong>on</strong>, as opposed to CO c<strong>on</strong>centrati<strong>on</strong> at the shift reactor outlet, O2/CO was set<br />
to 1.5 (3 times the theoretical ratio) at the first CO selective remover and to 0.15 at the sec<strong>on</strong>d<br />
reactor (1/10 the volume at the first reactor).<br />
(3) Substance balance<br />
Table 3.2.1 presents substance balance as calculated based <strong>on</strong> the c<strong>on</strong>diti<strong>on</strong>s given in Secti<strong>on</strong><br />
3.2.1 (2). The following was also clarified.<br />
<strong>Hydrogen</strong> was produced at approximately 950 Nl/hr from raw material kerosene at 380 ml/hr<br />
(approx. 290 g/hr).<br />
The compositi<strong>on</strong> of hydrogen-rich gas product was H2 (42.83 mol%): CH4 (0.015 mol%): CO2<br />
(20.66 mol%): N2 (36.49 mol%), with the ratios of H2, CO2 and N2 at roughly 6:3:5.
Table 3.2.1: ATR-FPS Substance Balance<br />
(4) Heat Balance<br />
Kerosene<br />
(a) Heat recovery system<br />
6<br />
Kerosene + Steam + Air<br />
Optimizati<strong>on</strong> of ATR-FPS heat recovery was attempted using pinch technology. It was<br />
c<strong>on</strong>firmed that all the heat required (e.g., raw material vaporizati<strong>on</strong>, steam vaporizati<strong>on</strong>)<br />
could not be replenished <strong>by</strong> means of waste heat recovery. The heat balance obtained<br />
is shown in Table 3.2.2 and heat recovery for ATR-FPS is given in Figure 3.2.2. As<br />
Table 3.2.2 indicates, whereas the total of received heat is 962.2 kcal/hr, that of heat<br />
given off is 1140.7 kcal/hr, and since the volume of heat given off is greater than that of<br />
heat received, it is apparent that heating <strong>by</strong> an outside source is not required.<br />
According to pinch technology shown in Figure in 3.2.2, however, when a temperature<br />
differential (10°C) has been secured at pinch point (60°C), some 34.0 kcal/hr of heat,<br />
equivalent to roughly 4% of the total heat volume from heating (962.2 kcal/hr), is<br />
required from an external source.
Table 3.2.2: Heat Balance<br />
Received<br />
heat<br />
Emitted<br />
heat<br />
Heat exchanger Inlet<br />
temperature<br />
(°C)<br />
7<br />
Outlet<br />
temperature<br />
(°C)<br />
Heat<br />
volume<br />
(kcal/hr)<br />
Crude oil vaporizati<strong>on</strong> 25 202 56.8<br />
Steam vaporizati<strong>on</strong> 25 102 555.8<br />
Fuel oil + steam +<br />
heated air<br />
102 450 349.6<br />
Total 962.2<br />
ATR to LTS-1 750 250 577.4<br />
LTS-1 to LTS-2 320 200 126.6<br />
LTS-2 to PROX-1 205 150 56.8<br />
PROX-1 to PROX-2 192 150 43.9<br />
From PROX-2 154 40 336.0<br />
Total 1,140.7<br />
Figure 3.2.2: ATR-FPS Heat Recovery<br />
3.3 Development of <strong>Autothermal</strong> <strong>Reforming</strong> Catalyst<br />
3.3.1 Experiment Method<br />
A fixed-bed, flow-type micro reactor was used for reacti<strong>on</strong>s. Deep desulfurized kerosene (Sf <<br />
0.5 ppm) was used as raw material oil. At prescribed volumes, calculated in accordance with<br />
Secti<strong>on</strong> 3.1.2, deep desulfurized kerosene and water were supplied via fluid feed pump, and air<br />
was supplied <strong>by</strong> thermal mass flow. Used as reactor was an electric oven heated to a<br />
prescribed temperature. ATR catalyst A served as the standard catalyst. In the current fiscal<br />
year, plans call for preparati<strong>on</strong> of ATR catalysts B-E, to which tertiary ingredients have been<br />
added to ATR catalyst A in order to have catalyst that offers greater steam reforming activity, in<br />
an effort to achieve autothermal reforming at high activity. Carrier was obtained <strong>by</strong> kneading two<br />
types of oxide with binder, and then after molding, <strong>by</strong> sintering at a prescribed temperature<br />
under air flow. The carriers obtained were globular in shape, measuring 2-4 mm in diameter and<br />
90-110 m 2 /g in surface area. For active metal retenti<strong>on</strong>, metallic salt water soluti<strong>on</strong> was<br />
impregnated in obtained carrier, dried and adjusted. Prior to reacti<strong>on</strong>, pretreatment took place<br />
for 3 hrs at 700°C under hydrogen current. Used in evaluating the reacti<strong>on</strong> was CO + CO2<br />
selecti<strong>on</strong> rate, which gives the percentage of carb<strong>on</strong> in raw material hydrocarb<strong>on</strong>s that has been<br />
transformed into CO and CO2.
The gas obtained was analyzed using TCD or FID gas chromatogram; an oxygen combusti<strong>on</strong><br />
type carb<strong>on</strong> analyzer was used to analyze the volume of carb<strong>on</strong> accumulated <strong>on</strong> catalyst after<br />
the reacti<strong>on</strong>.<br />
3.3.2 <strong>Autothermal</strong> <strong>Reforming</strong> Reacti<strong>on</strong> with Each Type of Catalyst<br />
Figure 3.3.1 presents the results of a comparis<strong>on</strong> of the dependency <strong>on</strong> reacti<strong>on</strong> temperature of<br />
autothermal reforming reacti<strong>on</strong> activity with each type of catalyst. The catalysts can be arranged<br />
in sequence as follows.<br />
Catalyst B > Catalyst C > Catalyst A (standard) > Catalyst D > Catalyst E<br />
At 750°C or above, a CO + CO2 selecti<strong>on</strong> rate of virtually 100% was exhibited with all the<br />
catalysts.<br />
The temperature distributi<strong>on</strong> of each catalytic layer at this time is shown in Figure 3.3.2, with<br />
600°C taken as sample reacti<strong>on</strong> temperature. With all the catalysts, it was c<strong>on</strong>firmed that the<br />
temperature rises sharply near the inlet and declines as you go to the lower layers. Dissanayake<br />
et al. 1) and Groote et al. 2) report that in autothermal reforming reacti<strong>on</strong> with methane, a complete<br />
oxidati<strong>on</strong> reacti<strong>on</strong> of methane takes place first, followed <strong>by</strong> water vapor reforming, CO2<br />
reforming, and aqueous gas shift reacti<strong>on</strong>. It is believed that in the latest results as well,<br />
oxidati<strong>on</strong> reacti<strong>on</strong> advanced over the upper catalyst layer. When the catalysts are arranged in<br />
order of highest temperature at the catalyst layer inlet, the following sequence obtains.<br />
Catalyst E > Catalyst D > Catalyst C > Catalyst A (standard) > Catalyst B<br />
This sequence manifests a trend virtually opposite that of the activity sequence. It shows that<br />
when the catalyst inlet temperature is high (that is when the heat given off is great), the<br />
complete oxidati<strong>on</strong> reacti<strong>on</strong> takes precedence over the reforming reacti<strong>on</strong> (steam reforming<br />
reacti<strong>on</strong> or CO2 reforming reacti<strong>on</strong>). In catalyst with low autothermal reforming activity, the<br />
reforming reacti<strong>on</strong> tends to advance less easily than the complete oxidati<strong>on</strong> reacti<strong>on</strong>.<br />
C<strong>on</strong>versely, in catalyst with high autothermal reforming activity, the complete oxidati<strong>on</strong> reacti<strong>on</strong><br />
and reforming reacti<strong>on</strong> both advance easily. The fact that the complete oxidati<strong>on</strong> reacti<strong>on</strong> and<br />
reforming reacti<strong>on</strong> take place at near<strong>by</strong> locati<strong>on</strong>s <strong>on</strong> the catalyst suggests that the temperature<br />
at catalyst inlet is kept relatively low. With catalyst A (standard) and catalyst C, however, this<br />
trend is reversed, and the factors determining catalyst layer temperature distributi<strong>on</strong> are not just<br />
the catalyst’s complete oxidati<strong>on</strong> activity or reforming activity. Such things as thermal<br />
c<strong>on</strong>ductivity and filling density are also c<strong>on</strong>tributing factors.<br />
In the development of autothermal reforming catalyst, it is not <strong>on</strong>ly high activity that is important<br />
but also curtailment of carb<strong>on</strong> precipitati<strong>on</strong>. Of the catalysts c<strong>on</strong>sidered in Figure 3.3.1, ATR<br />
catalyst A and ATR catalysts B and C, which manifest higher activity than ATR catalyst A, were<br />
used in reacti<strong>on</strong>s that took place for 16 hrs at 600°C and the volumes of precipitated carb<strong>on</strong><br />
thereafter were compared as shown in<br />
8
Figure 3.3.3. It was recognized that the volume of precipitated carb<strong>on</strong> with ATR catalyst B,<br />
which exhibited the highest activity am<strong>on</strong>g the catalysts compared, was the smallest, and it<br />
became evident that the volume of precipitated carb<strong>on</strong> with ATR catalyst A can be reduced <strong>by</strong><br />
about 35%. With ATR catalyst C, which manifested higher activity than ART catalyst A,<br />
approximately 1.2 times greater carb<strong>on</strong> precipitati<strong>on</strong> was noted as compared to ATR catalyst A.<br />
This shows that escalati<strong>on</strong> of activity <strong>by</strong> the additi<strong>on</strong> of tertiary c<strong>on</strong>stituents does not always<br />
match with curtailment of carb<strong>on</strong> precipitati<strong>on</strong>. It is c<strong>on</strong>jectured that in the design of autothermal<br />
reforming catalyst, escalati<strong>on</strong> of activity and curtailment of carb<strong>on</strong> precipitati<strong>on</strong> must be<br />
c<strong>on</strong>sidered from separate standpoints.<br />
CO + CO2 selecti<strong>on</strong> rate (%)<br />
Catalyst layer outlet temperature (°C)<br />
(Deep desulfurized kerosene,<br />
LHSV = 1,O2/C = 0.45, S/C = 2.437)<br />
Catalyst A<br />
Catalyst B<br />
Catalyst C<br />
Catalyst D<br />
Catalyst E<br />
Figure 3.3.1: Comparis<strong>on</strong> of<br />
<strong>Autothermal</strong> <strong>Reforming</strong><br />
Reactivity with Each Type<br />
of Catalyst<br />
Precipitated carb<strong>on</strong> volume (mass%)<br />
9<br />
Catalyst layer temperature (°C)<br />
Outlet<br />
Inlet<br />
Distance (cm) from catalyst layer outlet<br />
Catalyst A<br />
Catalyst B<br />
Catalyst C<br />
Catalyst D<br />
Catalyst E<br />
Figure 3.3.2: Catalyst Layer Temperature<br />
Distributi<strong>on</strong> in <strong>Autothermal</strong><br />
<strong>Reforming</strong> Reacti<strong>on</strong> with<br />
Each Type of Catalyst<br />
Catalyst A Catalyst B Catalyst C<br />
Figure 3.3.3: Comparis<strong>on</strong> of Precipitated Carb<strong>on</strong> Volume after<br />
Reacti<strong>on</strong> with Each Type of Catalyst (600°C, 16 hrs)
3.4 Investigati<strong>on</strong> of Hydrocarb<strong>on</strong> C<strong>on</strong>stituents in Fuel and of <strong>Autothermal</strong> <strong>Reforming</strong><br />
Characteristics<br />
3.4.1 Experiment Method<br />
A fixed-bed, flow-type micro reactor was used for reacti<strong>on</strong>s. The hydrocarb<strong>on</strong> compounds<br />
shown in Table 3.4.1 were used as raw material, together with standard ATR catalyst A. So as<br />
to compare the autothermal reforming reacti<strong>on</strong> characteristics am<strong>on</strong>g each hydrocarb<strong>on</strong>, the<br />
most ideal reacti<strong>on</strong> temperature was <strong>on</strong>e at which side reacti<strong>on</strong>s such as combusti<strong>on</strong> or<br />
decompositi<strong>on</strong> could be suppressed as much as possible. Representative of each hydrocarb<strong>on</strong>,<br />
deep desulfurized kerosene and normal hexane were taken as raw materials. Reacti<strong>on</strong> was<br />
initiated under the same c<strong>on</strong>diti<strong>on</strong>s as for autothermal reforming reacti<strong>on</strong>, using a micro-reactor<br />
without catalyst, and the presence of side reacti<strong>on</strong>s in the reactor was c<strong>on</strong>firmed. As shown in<br />
Figure 3.4.1, because the C2-C4 hydrocarb<strong>on</strong> selecti<strong>on</strong> rate is zero at 600°C or below, it was<br />
c<strong>on</strong>firmed that no side reacti<strong>on</strong>s take place inside the reactor. C<strong>on</strong>sequently, autothermal<br />
reforming reacti<strong>on</strong> was implemented at 600°C, where there would be no side reacti<strong>on</strong>s. Taking<br />
the carb<strong>on</strong> mol flow volume included in the raw material hydrocarb<strong>on</strong>s as standard, the rate was<br />
0.71 mol/hr-C. O2/C and S/C were determined in accordance with Secti<strong>on</strong> 3.1.2. <strong>Reforming</strong><br />
reactivity was evaluated using a virtual speed c<strong>on</strong>stant k (CO + CO2) covering CO + CO2<br />
producti<strong>on</strong>, determined <strong>on</strong> the assumpti<strong>on</strong> of a primary reacti<strong>on</strong> and CO + CO2 selecti<strong>on</strong> rate<br />
that correlates with the hydrogen selecti<strong>on</strong> rate targeted.<br />
Table 3.4.1: Model Hydrocarb<strong>on</strong> Compounds Equivalent to Naphtha -<br />
Kerosene Fracti<strong>on</strong>s Used<br />
Hydrocarb<strong>on</strong><br />
count<br />
n-P i-P O N A<br />
LN 6 n-hexane 2,2<br />
dimethylbutane<br />
1-hexane cyclohexane benzene<br />
HN 8 n-octane 2,2,4-trimethylp 1-octane ethylcyclohexane m-xylene<br />
entane<br />
ethylbenzene<br />
KERO 10 n-decane n-butylcyclohexane diethylbenzene<br />
Other n-dodecane,<br />
n-hexadecane<br />
C2-C4 selecti<strong>on</strong> rate (%)<br />
10<br />
Desulfurized kerosene<br />
Reacti<strong>on</strong> temperature (°C)<br />
(Reacti<strong>on</strong> c<strong>on</strong>diti<strong>on</strong>s: O2/C = 0.45, S/C heat balance c<strong>on</strong>diti<strong>on</strong>s, LHSV = 1.0 to 1.6)<br />
Figure 3.4.1: Temperature Dependency vs Side Reacti<strong>on</strong> in Reactor<br />
1,2,4-trimethylbenzene
3.4.2 <strong>Reforming</strong> Reactivity of Normal Paraffin Due to Differences in Carb<strong>on</strong> Number<br />
Figure 3.4.2 presents a comparis<strong>on</strong> of relative reforming activities for normal paraffin due to<br />
differences in carb<strong>on</strong> number. It can be seen that as carb<strong>on</strong> number increases, relative<br />
reforming activity declines. A comparis<strong>on</strong> of precipitated carb<strong>on</strong> volume at this time is shown in<br />
Figure 3.4.3. Because the precipitated carb<strong>on</strong> volume increased together with an increase in<br />
carb<strong>on</strong> number, relative reforming activity and precipitated carb<strong>on</strong> volume exhibited similar<br />
trends with ATR catalyst A. Figure 3.4.4 gives the selecti<strong>on</strong> rates of C2-C4 hydrocarb<strong>on</strong>s<br />
produced at this time. It can be seen that the C2-C4 hydrocarb<strong>on</strong> selecti<strong>on</strong> rates become greater<br />
as the carb<strong>on</strong> number increases. This fact suggests that when the carb<strong>on</strong> chain becomes large,<br />
even though it decomposes midway, unreformed hydrocarb<strong>on</strong> increases. What is more, the bulk<br />
of unreformed hydrocarb<strong>on</strong>s are olefins. That precipitated carb<strong>on</strong> volume increases together<br />
with an increase in carb<strong>on</strong> number can be ascribed to the fact that unreformed olefins c<strong>on</strong>dense<br />
<strong>on</strong> catalyst surface, making it easy for carb<strong>on</strong>s to be formed.<br />
Relative activity k (CO + CO2) /-<br />
C number<br />
Figure 3.4.2: Comparis<strong>on</strong> of<br />
<strong>Autothermal</strong> <strong>Reforming</strong><br />
Reactivity of Normal<br />
Paraffin Due to<br />
Differences in Carb<strong>on</strong><br />
Number<br />
C2-C4 selecti<strong>on</strong> rate (%)<br />
11<br />
C depositi<strong>on</strong> weight (mass%)<br />
C number<br />
Figure 3.4.3: Comparis<strong>on</strong> of Precipitated<br />
Carb<strong>on</strong> Magnitude <strong>on</strong><br />
Catalyst Due to Differences<br />
in Carb<strong>on</strong> Number<br />
C number<br />
Figure 3.4.4: Selecti<strong>on</strong> Rate of C2-C4 Hydrocarb<strong>on</strong> in Normal Paraffin<br />
Due to Differences in Carb<strong>on</strong> Number
3.4.3 <strong>Reforming</strong> Reactivity of Model Hydrocarb<strong>on</strong>s Equivalent to Gasoline Fracti<strong>on</strong><br />
Figure 3.4.5 presents a comparis<strong>on</strong> of relative reforming activity for each model hydrocarb<strong>on</strong><br />
compound of normal paraffin, isoparaffin, olefin, naphthene and aroma; the carb<strong>on</strong> number of<br />
model hydrocarb<strong>on</strong> equivalent to gasoline fracti<strong>on</strong> was taken as 8. A comparis<strong>on</strong> of precipitated<br />
carb<strong>on</strong> volume at this time is shown in Figure 3.4.6. In each case, the sequence of relative<br />
reforming activity and precipitated carb<strong>on</strong> volume becomes as follows.<br />
Isoparaffin = Naphthene = Normal paraffin > Aromatic > Olefin<br />
It is believed that factors due to hydrocarb<strong>on</strong> structure play a large role in these sequences, but<br />
the details will have to be further investigated in the future.<br />
Relative activity k (CO + CO2) /-<br />
Figure 3.4.5: Comparis<strong>on</strong> of<br />
<strong>Autothermal</strong> <strong>Reforming</strong><br />
Reactivity Due to<br />
Differences in<br />
Hydrocarb<strong>on</strong> Type<br />
(Carb<strong>on</strong> No.: 8)<br />
12<br />
C depositi<strong>on</strong> weight (mass%)<br />
Figure 3.4.6: Comparis<strong>on</strong> of Precipitated<br />
Carb<strong>on</strong> Volume <strong>on</strong> Catalyst<br />
Due to Differences in<br />
Hydrocarb<strong>on</strong> Type (Carb<strong>on</strong><br />
No.: 8)
3.4.4 <strong>Reforming</strong> Reactivity of Each Model Hydrocarb<strong>on</strong> Type Equivalent from Naphtha<br />
to Kerosene Fracti<strong>on</strong><br />
Respecting the reforming reactivity of each model hydrocarb<strong>on</strong> equivalent to fracti<strong>on</strong>s from<br />
naphtha to kerosene, Figure 3.4.7 presents a comparis<strong>on</strong> of relative reforming activity,<br />
organized <strong>by</strong> carb<strong>on</strong> number, and Figure 3.4.8 gives a comparis<strong>on</strong> of carb<strong>on</strong> depositi<strong>on</strong> weight.<br />
The relative reforming activity of normal paraffin is relatively high at low class but at high class, it<br />
tends to become lower than that of other hydrocarb<strong>on</strong>s. Regardless of the carb<strong>on</strong> number, the<br />
reforming activity of naphthene was high in comparis<strong>on</strong> to other hydrocarb<strong>on</strong>s. With aromatic<br />
compounds, a clear correlati<strong>on</strong> with carb<strong>on</strong> number could not be c<strong>on</strong>firmed. On the c<strong>on</strong>trary,<br />
structural factors such as substituent positi<strong>on</strong> or chain length are suspected. For isoparaffin and<br />
olefin, the trends in relative reforming activity could not be determined. Carb<strong>on</strong> depositi<strong>on</strong><br />
weight was small with naphthene and isoparaffin, but large with olefin. The deposited carb<strong>on</strong><br />
weight with normal paraffin was small in comparis<strong>on</strong> to other hydrocarb<strong>on</strong>s at low class, the<br />
same as relative reforming activity, and large at high class. Am<strong>on</strong>g aromatic compounds, the<br />
deposited carb<strong>on</strong> weight did not exhibit a clear correlati<strong>on</strong> with carb<strong>on</strong> number, because of<br />
substituent reactivity or structural factors such as electr<strong>on</strong> polarizati<strong>on</strong> in aromatic rings.<br />
Relative reforming activity also exhibited different trends. These results indicate that am<strong>on</strong>g the<br />
hydrocarb<strong>on</strong>s equivalent to fracti<strong>on</strong>s from naphtha to kerosene, the reforming reactivity is<br />
dependent up<strong>on</strong> carb<strong>on</strong> number in some cases, as in normal paraffin, but this factor is not<br />
adequate for explaining all hydrocarb<strong>on</strong>s. To explore the details in greater depth, such things as<br />
hydrocarb<strong>on</strong> physical properties, chemical properties and interacti<strong>on</strong>s with catalyst will have to<br />
be further investigated.<br />
Relative activity k (CO + CO2) /-<br />
C number<br />
n-paraffin<br />
Naphthene<br />
Aroma<br />
Olefin<br />
i-paraffin<br />
Figure 3.4.7: Carb<strong>on</strong> No. vs Relative<br />
Reactivity<br />
3.5 Development of Catalytic Desulfurizati<strong>on</strong> Process<br />
3.5.1 Experiment Method<br />
C depositi<strong>on</strong> weight (mass%)<br />
13<br />
C number<br />
n-paraffin<br />
Naphthene<br />
Aroma<br />
Olefin<br />
i-paraffin<br />
Figure 3.4.8: Carb<strong>on</strong> No. vs Precipitated<br />
Carb<strong>on</strong> Magnitude<br />
Almost all the kerosene in circulati<strong>on</strong> in the market c<strong>on</strong>tains a sulfur comp<strong>on</strong>ent at the level of<br />
20-60 massppm. As a sample for desulfurizati<strong>on</strong> reacti<strong>on</strong>, kerosene <strong>on</strong> the market at 50<br />
massppm was prepared. Properties are indicated in Table 3.5.1.
At the oil refinery, the hydrodesulfurizati<strong>on</strong> reactor operates with hydrogen partial pressure at<br />
2.0-3.0 MPa for light fracti<strong>on</strong> and at a high pressure of 10.0 MPa or greater for heavy fracti<strong>on</strong>.<br />
Nevertheless, with the small-scale fuel cell power generati<strong>on</strong> system, including power for<br />
household use, atmospheric pressure must be c<strong>on</strong>sidered in terms of the High-Pressure Gas<br />
C<strong>on</strong>trol Law, the Electric Utility Law, and so <strong>on</strong>. In the present research, therefore, the following<br />
two points were assumed for desulfurizati<strong>on</strong> reacti<strong>on</strong>.<br />
1. The raw material is kerosene <strong>on</strong> the market (with 50 massppm sulfur comp<strong>on</strong>ent).<br />
2. The reacti<strong>on</strong> pressure is atmospheric pressure.<br />
The purpose of the initial investigati<strong>on</strong>, therefore, was to determine desulfurizati<strong>on</strong> performance<br />
of active metals at atmospheric pressure. The c<strong>on</strong>stituents and c<strong>on</strong>figurati<strong>on</strong>s of catalysts used<br />
in evaluating activity are listed in Table 3.5.2. Desulfurizati<strong>on</strong> catalyst A is a regular<br />
extrusi<strong>on</strong>-mold-type hydrodesulfurizati<strong>on</strong> catalyst. Desulfurizati<strong>on</strong> catalyst B was prepared <strong>by</strong><br />
having precious metal, the active metal, retained in globular-shaped alumina, the carrier.<br />
Desulfurizati<strong>on</strong> catalyst C was obtained <strong>by</strong> molding base metal and zinc oxide in<br />
columnar-shaped tablets.<br />
A microreactor was used in evaluating the hydrodesulfurizati<strong>on</strong> activity of these three catalysts.<br />
Prior to the hydrodesulfurizati<strong>on</strong> reacti<strong>on</strong>, desulfurizati<strong>on</strong> catalyst A filled in the reactor<br />
underwent preliminary sulfurizati<strong>on</strong> for 2 hrs at 350°C via 5% hydrogen sulfide/hydrogen gas;<br />
desulfurizati<strong>on</strong> catalysts B and C underwent hydrogenati<strong>on</strong> pretreatment reducti<strong>on</strong> for 2 hrs at<br />
350°C under c<strong>on</strong>diti<strong>on</strong>s of hydrogen flow.<br />
3.5.2 Impact of Catalytically Active Metals<br />
Figure 3.5.1 presents the results of an evaluati<strong>on</strong> of the hydrodesulfurizati<strong>on</strong> activity of each<br />
catalyst in kerosene <strong>on</strong> the market with the H2/oil ratio at 100 and the reacti<strong>on</strong> temperature at<br />
250°C. The desulfurizati<strong>on</strong> activity of these three catalysts with LHSV = 10 can be expressed in<br />
relative terms from reacti<strong>on</strong> speed c<strong>on</strong>stant. When the activity of desulfurizati<strong>on</strong> catalyst A is<br />
taken as 100, that of desulfurizati<strong>on</strong> catalyst B becomes 250 and that of desulfurizati<strong>on</strong> catalyst<br />
C, 773, revealing that the activity of desulfurizati<strong>on</strong> catalyst C is the highest.<br />
Table 3.5.1: Properties of Raw Material Kerosene Used<br />
Distillati<strong>on</strong> (°C)<br />
IBP 152 Density g/cm 3 0.791<br />
10% 170 Compositi<strong>on</strong> Aroma % 22.4<br />
20% 177 Olefin % 0.2<br />
30% 185<br />
14<br />
Saturati<strong>on</strong> % 77.4<br />
40% 192 Sulfur comp<strong>on</strong>ent massppm 50<br />
50% 201<br />
60% 210<br />
70% 221<br />
80% 234<br />
90% 248<br />
EP 275
Table 3.5.2: List of Catalysts for Investigati<strong>on</strong> of Kerosene Hydrodesulfurizati<strong>on</strong><br />
Catalyst C<strong>on</strong>stituent C<strong>on</strong>figurati<strong>on</strong><br />
Catalyst A Hydrodesulfuizati<strong>on</strong> catalyst<br />
<strong>on</strong> market<br />
Extrusi<strong>on</strong> molded products<br />
Catalyst B Precious metals Globular shape<br />
Catalyst C Base metals Columnar shaped tablets<br />
Relative activity value<br />
Catalyst A Catalyst B Catalyst C<br />
Figure 3.5.1: Evaluati<strong>on</strong> Results for Hydrodesulfurizati<strong>on</strong> Activity<br />
3.5.3 Impact of Catalyst Adjustment C<strong>on</strong>diti<strong>on</strong>s<br />
Desulfurizati<strong>on</strong> catalyst C is catalyst in which base metal comp<strong>on</strong>ents and metal oxides have<br />
been molded into columnar tablets. In order to investigate the impact of catalyst preparati<strong>on</strong><br />
c<strong>on</strong>diti<strong>on</strong>s <strong>on</strong> hydrodesulfurizati<strong>on</strong> activity, four types of catalyst (Table 3.5.3) with different<br />
active metal load weight were prepared <strong>by</strong> means of the impregnati<strong>on</strong> and co-precipitati<strong>on</strong><br />
methods. Using these catalysts, tests to evaluate activity were c<strong>on</strong>ducted with LHSV = 0.25 and<br />
reacti<strong>on</strong> temperature at 300°C so as to clarify initial deteriorati<strong>on</strong> in activity. The results are<br />
shown in Figure 3.5.2. The performance of catalyst prepared <strong>by</strong> the impregnati<strong>on</strong> method was<br />
such that the Sp value exceeded 0.2 massppm in catalyst with low metal retenti<strong>on</strong> magnitude<br />
for about 100 hrs and in catalyst with high metal load weight, for about 450 hrs. In catalyst<br />
prepared <strong>by</strong> the co-precipitati<strong>on</strong> method, <strong>on</strong> the other hand, the Sp value did not exceed 0.2<br />
massppm for up to 500 hrs irrespective of the active metal magnitude. In order to determine the<br />
amount of hydrogen required for reacti<strong>on</strong> in the catalyst system, an investigati<strong>on</strong> was made in<br />
which the hydrogen supply volume was modified over 100 hrs after reacti<strong>on</strong> startup. The results<br />
are shown in Figure 3.5.3. With the H2/oil ratio at 50 or above, the Sp value was low irrespective<br />
of catalyst preparati<strong>on</strong> method, but when the ratio fell below 50, it was found that the catalyst’s<br />
desulfurizati<strong>on</strong> activity drops sharply. Given this fact, it is c<strong>on</strong>jectured that the H2/oil ratio must<br />
be at least 50 in this catalyst system.<br />
Table 3.5.3: List of C-type Catalysts<br />
Catalyst name Preparati<strong>on</strong> method Metal load weight<br />
Catalyst C-1 Impregnati<strong>on</strong> Low<br />
Catalyst C-2 Impregnati<strong>on</strong> High<br />
Catalyst C-3 Co-precipitati<strong>on</strong> Low<br />
Catalyst C-4 Co-precipitati<strong>on</strong> High<br />
15
4. Synopsis<br />
Catalyst C-1 Catalyst C-2 Catalyst C-3 Catalyst C-4<br />
Figure 3.5.2: Evaluative Tests of Hydrodesulfurizati<strong>on</strong> Reacti<strong>on</strong> Life<br />
Catalyst C-2 Catalyst C-4<br />
Figure 3.5.3: Impact of H2/Oil Ratio <strong>on</strong> <strong>Hydrogen</strong>ati<strong>on</strong> Desulfurizati<strong>on</strong><br />
Reacti<strong>on</strong><br />
4.1 Design of <strong>Autothermal</strong> <strong>Reforming</strong> Process<br />
(1) Basic Establishment of <strong>Autothermal</strong> <strong>Reforming</strong> Type <strong>Hydrogen</strong> Producti<strong>on</strong> System<br />
An autothermal reforming - fuel processing system (ATR-FPS) was set up from supply of<br />
raw materials to after selective removal of CO. On the assumpti<strong>on</strong> that there is no<br />
discharge heat loss, a method was established for calculating reacti<strong>on</strong> c<strong>on</strong>diti<strong>on</strong>s so that<br />
the system as a whole achieves heat balance.<br />
(2) Investigati<strong>on</strong> of <strong>Hydrogen</strong> Producti<strong>on</strong> <strong>on</strong> 1 Nm 3 /hr Scale<br />
<strong>Hydrogen</strong> producti<strong>on</strong> <strong>on</strong> the 1 Nm 3 /hr scale <strong>by</strong> the autothermal reforming method was<br />
c<strong>on</strong>firmed, as was the impact of reacti<strong>on</strong> temperature <strong>on</strong> the autothermal reforming<br />
reacti<strong>on</strong>.<br />
4.2 Basic Design of <strong>Autothermal</strong> <strong>Reforming</strong> - Fuel Processing System<br />
The basic design of the autothermal reforming - fuel processing system (ATR-FPS) was<br />
completed in c<strong>on</strong>siderati<strong>on</strong> of raw material specificati<strong>on</strong>s, substance balance and heat balance.<br />
16
4.3 Development of <strong>Autothermal</strong> <strong>Reforming</strong> Catalyst<br />
<strong>Autothermal</strong> reforming catalyst B, superior to the current autothermal reforming catalyst A in<br />
activity and in coking resistance, was discovered.<br />
4.4 Investigati<strong>on</strong> of Hydrocarb<strong>on</strong> C<strong>on</strong>stituents in Fuel and of <strong>Autothermal</strong> <strong>Reforming</strong><br />
Characteristics<br />
Comparis<strong>on</strong>s were made of the autothermal reforming characteristics of typical c<strong>on</strong>stituents<br />
comprised of naphtha to kerosene fracti<strong>on</strong>. It was c<strong>on</strong>firmed that the reforming reactivity is<br />
higher, the lower the class of hydrocarb<strong>on</strong>. In additi<strong>on</strong>, with naphtha fracti<strong>on</strong>, the reforming<br />
reactivity of saturated hydrocarb<strong>on</strong> is the highest, followed in sequence <strong>by</strong> that of aroma and<br />
olefin.<br />
4.5 Development of Catalytic Desulfurizati<strong>on</strong> Process<br />
The reacti<strong>on</strong> c<strong>on</strong>diti<strong>on</strong>s required for hydrodesulfurizati<strong>on</strong> were established, and desulfurizati<strong>on</strong><br />
catalyst B-2 was developed. This catalyst exhibits high activity such that the sulfur c<strong>on</strong>centrati<strong>on</strong><br />
in produced oil is 0.2 massppm or less. Service life evaluati<strong>on</strong> tests c<strong>on</strong>firmed that the durability<br />
of catalyst B-2 is 500 hrs.<br />
5. Bibliography<br />
1. D. Dissanayake et al., J. Catal., 132 (1991) 117<br />
2. A. M. D. Groote et al., Appl. Catal. A, 138 (1996) 245<br />
Copyright 2002 Petroleum Energy Center. All rights reserved.<br />
17