case studies - Dresser-Rand
case studies - Dresser-Rand
case studies - Dresser-Rand

You also want an ePaper? Increase the reach of your titles
YUMPU automatically turns print PDFs into web optimized ePapers that Google loves.
TABLE OF CONTENTS<br />
Overview<br />
<strong>Dresser</strong>-<strong>Rand</strong> at a Glance ...............................IFC<br />
Overview ........................................................... 1<br />
CEO Letter ......................................................... 2<br />
Corporate Vision, Mission,<br />
Guiding Principles, and Values ........................... 3<br />
Our Approach to Sustainability ......................... 4<br />
Our Sustainability Principles .............................. 5<br />
Stakeholder Engagement .................................... 6<br />
Key Issues ............................................................ 7<br />
Environment .................................................... 10<br />
Climate Change ................................................ 12<br />
Driving Efficiency in<br />
Our Clients’ Operations ................................... 14<br />
Operational Excellence in<br />
Our Operations ................................................. 16<br />
Society .............................................................. 18<br />
Localization ......................................................20<br />
People ................................................................22<br />
Health & Safety ................................................24<br />
Community ......................................................26<br />
Suppliers ............................................................ 29<br />
Using Technology to Improve Lives .................30<br />
Governance ...................................................... 32<br />
Our Approach to Governance ..........................34<br />
Global Reporting Initiative (GRI) Index .........38<br />
DRESSER-RAND<br />
SUSTAINABILITY COUNCIL<br />
Asier Alea<br />
Business Development Manager—<br />
Environmental Solutions<br />
Blaise Derrico<br />
Vice President, Investor Relations<br />
Brad Dickson<br />
Vice President, Chief Marketing Officer<br />
Mark Mai<br />
Vice President, General Counsel & Secretary<br />
Ken Marcia<br />
Vice President, Worldwide Supply Chain<br />
& Process Innovation<br />
Jim Methven<br />
Director, Global Singular Processes<br />
Gustavo Nechar<br />
Vice President, Human Resources<br />
Jesus Pacheco<br />
Executive Vice President, New Equipment<br />
Worldwide<br />
Peter Salvatore<br />
Vice President, Chief Safety Officer<br />
Greg Stubbs<br />
Senior Manager, Sustainability &<br />
HSE Process Innovation<br />
The <strong>Dresser</strong>-<strong>Rand</strong> Sustainability Council represents a<br />
cross-functional team of senior managers and executive<br />
leaders chartered by our CEO with board oversight. The<br />
council is charged with developing a sustainability strategy<br />
of competitive advantage that engages opportunities of<br />
shared value for <strong>Dresser</strong>-<strong>Rand</strong> and its stakeholders. We wish<br />
to thank Jim Methven, Ken Marcia and Jesus Pacheco for<br />
their valuable input over the last three years, and welcome<br />
Ann Ackerson, vice president, Supply Chain, and Scott Wisler,<br />
director, Centers of Technical Excellence, to the Council.<br />
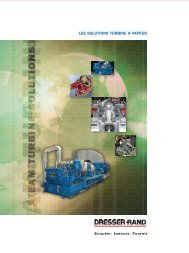
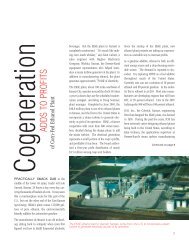
On the cover: <strong>Dresser</strong>-<strong>Rand</strong> supplied this<br />
turbine generator set to Portugal in 2007.<br />
The plant burns 13 tonnes/hr of a forestry<br />
residue/cork dust biomass mixture,<br />
producing power for the grid.<br />
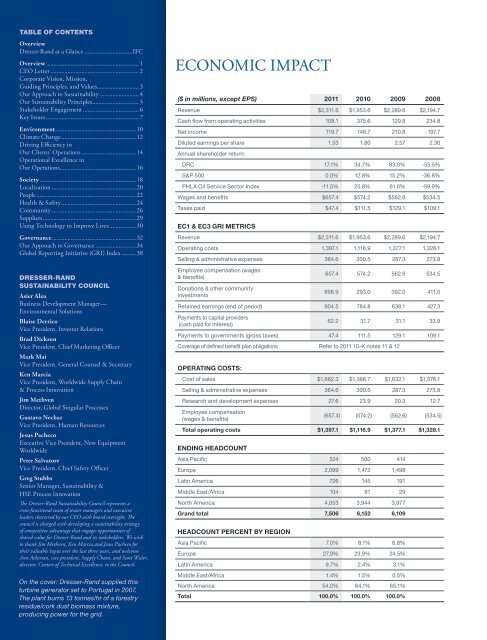
ECONOMIC IMPACT<br />
($ in millions, except EPS) 2011 2010 2009 2008<br />
Revenue $2,311.6 $1,953.6 $2,289.6 $2,194.7<br />
Cash flow from operating activities 108.1 375.6 129.8 234.8<br />
Net income 119.7 146.7 210.8 197.7<br />
Diluted earnings per share 1.53 1.80 2.57 2.36<br />
Annual shareholder return:<br />
DRC 17.1% 34.7% 83.0% -55.5%<br />
S&P 500 0.0% 12.8% 15.2% -36.8%<br />
PHLX Oil Service Sector Index -11.5% 25.8% 61.6% -59.9%<br />
Wages and benefits $657.4 $574.2 $562.6 $534.5<br />
Taxes paid $47.4 $111.5 $129.1 $109.1<br />
EC1 & EC3 GRI METRICS<br />
Revenue $2,311.6 $1,953.6 $2,289.6 $2,194.7<br />
Operating costs 1,397.1 1,116.9 1,377.1 1,328.1<br />
Selling & administrative expenses 364.6 300.5 287.3 273.8<br />
Employee compensation (wages<br />
& benefits)<br />
657.4 574.2 562.6 534.5<br />
Donations & other community<br />
investments<br />
698.9 293.0 392.0 411.0<br />
Retained earnings (end of period) 904.5 784.8 638.1 427.3<br />
Payments to capital providers<br />
(cash paid for interest)<br />
62.2 31.7 31.1 33.9<br />
Payments to governments (gross taxes) 47.4 111.5 129.1 109.1<br />
Coverage of defined benefit plan obligations Refer to 2011 10-K notes 11 & 12<br />
OPERATING COSTS:<br />
Cost of sales $1,662.3 $1,366.7 $1,632.1 $1,576.1<br />
Selling & administrative expenses 364.6 300.5 287.3 273.8<br />
Research and development expenses 27.6 23.9 20.3 12.7<br />
Employee compensation<br />
(wages & benefits)<br />
(657.4) (574.2) (562.6) (534.5)<br />
Total operating costs $1,397.1 $1,116.9 $1,377.1 $1,328.1<br />
ENDING HEADCOUNT<br />
Asia Pacific 524 500 414<br />
Europe 2,099 1,472 1,498<br />
Latin America 726 145 191<br />
Middle East/Africa 104 91 29<br />
North America 4,053 3,944 3,977<br />
Grand total 7,506 6,152 6,109<br />
HEADCOUNT PERCENT BY REGION<br />
Asia Pacific 7.0% 8.1% 6.8%<br />
Europe 27.9% 23.9% 24.5%<br />
Latin America 9.7% 2.4% 3.1%<br />
Middle East/Africa 1.4% 1.5% 0.5%<br />
North America 54.0% 64.1% 65.1%<br />
Total 100.0% 100.0% 100.0%