Tips and Tricks II: Getting the most from your SAS/Graph Maps
Tips and Tricks II: Getting the most from your SAS/Graph Maps
Tips and Tricks II: Getting the most from your SAS/Graph Maps
You also want an ePaper? Increase the reach of your titles
YUMPU automatically turns print PDFs into web optimized ePapers that Google loves.
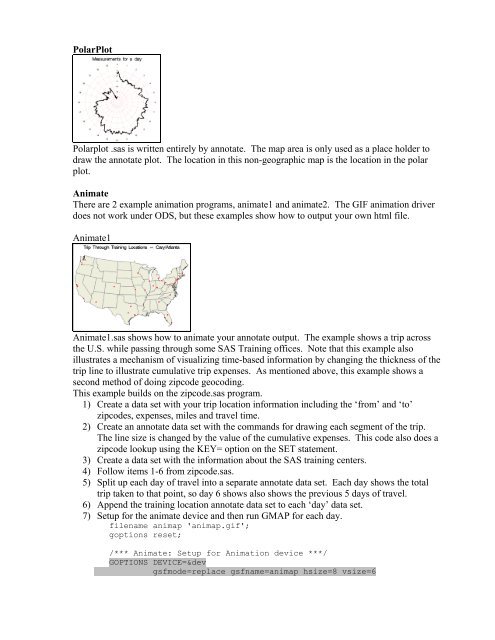
PolarPlot<br />
Polarplot .sas is written entirely by annotate. The map area is only used as a place holder to<br />
draw <strong>the</strong> annotate plot. The location in this non-geographic map is <strong>the</strong> location in <strong>the</strong> polar<br />
plot.<br />
Animate<br />
There are 2 example animation programs, animate1 <strong>and</strong> animate2. The GIF animation driver<br />
does not work under ODS, but <strong>the</strong>se examples show how to output <strong>your</strong> own html file.<br />
Animate1<br />
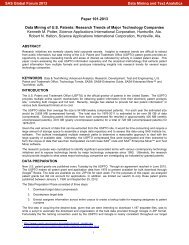
Animate1.sas shows how to animate <strong>your</strong> annotate output. The example shows a trip across<br />
<strong>the</strong> U.S. while passing through some <strong>SAS</strong> Training offices. Note that this example also<br />
illustrates a mechanism of visualizing time-based information by changing <strong>the</strong> thickness of <strong>the</strong><br />
trip line to illustrate cumulative trip expenses. As mentioned above, this example shows a<br />
second method of doing zipcode geocoding.<br />
This example builds on <strong>the</strong> zipcode.sas program.<br />
1) Create a data set with <strong>your</strong> trip location information including <strong>the</strong> ‘<strong>from</strong>’ <strong>and</strong> ‘to’<br />
zipcodes, expenses, miles <strong>and</strong> travel time.<br />
2) Create an annotate data set with <strong>the</strong> comm<strong>and</strong>s for drawing each segment of <strong>the</strong> trip.<br />
The line size is changed by <strong>the</strong> value of <strong>the</strong> cumulative expenses. This code also does a<br />
zipcode lookup using <strong>the</strong> KEY= option on <strong>the</strong> SET statement.<br />
3) Create a data set with <strong>the</strong> information about <strong>the</strong> <strong>SAS</strong> training centers.<br />
4) Follow items 1-6 <strong>from</strong> zipcode.sas.<br />
5) Split up each day of travel into a separate annotate data set. Each day shows <strong>the</strong> total<br />
trip taken to that point, so day 6 shows also shows <strong>the</strong> previous 5 days of travel.<br />
6) Append <strong>the</strong> training location annotate data set to each ‘day’ data set.<br />
7) Setup for <strong>the</strong> animate device <strong>and</strong> <strong>the</strong>n run GMAP for each day.<br />
filename animap 'animap.gif';<br />
goptions reset;<br />
/*** Animate: Setup for Animation device ***/<br />
GOPTIONS DEVICE=&dev<br />
gsfmode=replace gsfname=animap hsize=8 vsize=6


