

Tips and Tricks II: Getting the most from your SAS/Graph Maps
Tips and Tricks II: Getting the most from your SAS/Graph Maps
Tips and Tricks II: Getting the most from your SAS/Graph Maps

You also want an ePaper? Increase the reach of your titles
YUMPU automatically turns print PDFs into web optimized ePapers that Google loves.
State drill-down.<br />
data responsedata; /* add to <strong>the</strong> response data set. Faked in this case*/<br />
length htmlvar $1024; /* Make sure it is long enough */<br />
do state = 1 to 56;/* just loop thru <strong>and</strong> create one for each state */<br />
statename=fipstate(state);<br />
/*take only valid states*/<br />
if statename ^= '' <strong>the</strong>n do;<br />
htmlvar= 'alt='||quote( trim(left('State: '||<br />
trim(left(fipnamel(state))) ))) ||<br />
'href='||quote('http://www.wunderground.com/US/'||<br />
trim(left(statename))) ||<br />
'target=_new_'<br />
;<br />
output;<br />
end;<br />
end;<br />
run;<br />
Changes to GMAP statement.<br />
proc gmap map=work.states data=work.responsedata anno=work.trainloc;<br />
id state;<br />
choro state / coutline=black name="&name" html=htmlvar nolegend;<br />
run;<br />
quit;<br />
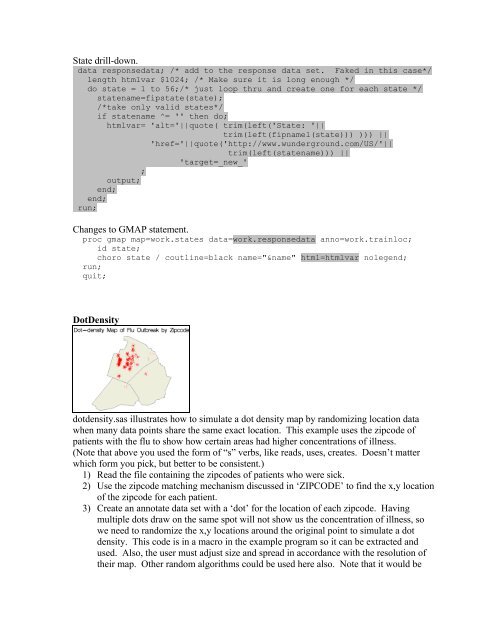
DotDensity<br />
dotdensity.sas illustrates how to simulate a dot density map by r<strong>and</strong>omizing location data<br />
when many data points share <strong>the</strong> same exact location. This example uses <strong>the</strong> zipcode of<br />
patients with <strong>the</strong> flu to show how certain areas had higher concentrations of illness.<br />
(Note that above you used <strong>the</strong> form of “s” verbs, like reads, uses, creates. Doesn’t matter<br />
which form you pick, but better to be consistent.)<br />
1) Read <strong>the</strong> file containing <strong>the</strong> zipcodes of patients who were sick.<br />
2) Use <strong>the</strong> zipcode matching mechanism discussed in ‘ZIPCODE’ to find <strong>the</strong> x,y location<br />
of <strong>the</strong> zipcode for each patient.<br />
3) Create an annotate data set with a ‘dot’ for <strong>the</strong> location of each zipcode. Having<br />
multiple dots draw on <strong>the</strong> same spot will not show us <strong>the</strong> concentration of illness, so<br />
we need to r<strong>and</strong>omize <strong>the</strong> x,y locations around <strong>the</strong> original point to simulate a dot<br />
density. This code is in a macro in <strong>the</strong> example program so it can be extracted <strong>and</strong><br />
used. Also, <strong>the</strong> user must adjust size <strong>and</strong> spread in accordance with <strong>the</strong> resolution of<br />
<strong>the</strong>ir map. O<strong>the</strong>r r<strong>and</strong>om algorithms could be used here also. Note that it would be


