English - Rohde & Schwarz
English - Rohde & Schwarz
English - Rohde & Schwarz

You also want an ePaper? Increase the reach of your titles
YUMPU automatically turns print PDFs into web optimized ePapers that Google loves.
Software<br />
Hardware Software<br />
RS-232-C<br />
IEEE<br />
USB<br />
EtherNet<br />
PCI<br />
ISA<br />
Driver<br />
Driver<br />
ASCII<br />
Dependent on device<br />
Independent of devices and technology<br />
Dependent on technology<br />
User-configurable<br />
Export Export<br />
Result files<br />
Core<br />
from measurements in mobile-radio<br />
and DAB/DVB networks through to<br />
almost any kind of exotic application.<br />
The modular concept enables the implementation<br />
of very small systems and<br />
high-performance test systems alike.<br />
And it makes the software future-proof,<br />
as it can easily be extended to accommodate<br />
upcoming technologies (eg<br />
W-CDMA).<br />
The core of the application can handle<br />
any kind of data and routes the incoming<br />
data stream to the appropriate<br />
software modules. All signals detected<br />
are stored on hard disk immediately on<br />
arrival at the core and visualized in a<br />
form meeting the user’s requirements.<br />
Apart from the core, there are numerous<br />
modules by which software can<br />
be extended to suit a given application.<br />
The modules are all available as<br />
options, so custom solutions can be<br />
confi gured fast. For example, different<br />
transmission technologies can be<br />
combined and/or multiply provided in<br />
a measurement system (eg a CDMA,<br />
two GSM and an ETACS mobile, a<br />
test receiver and GPS).<br />
30 News from <strong>Rohde</strong> & <strong>Schwarz</strong> Number 166 (2000/I)<br />
ROMES 3<br />
data format<br />
Technology<br />
X<br />
Alphanumeric values<br />
General<br />
GSS<br />
Special<br />
GSS<br />
Technology<br />
Y<br />
2D<br />
chart<br />
Map<br />
view<br />
Meas.<br />
report<br />
Layer<br />
3<br />
GSS: graphical subsystem<br />
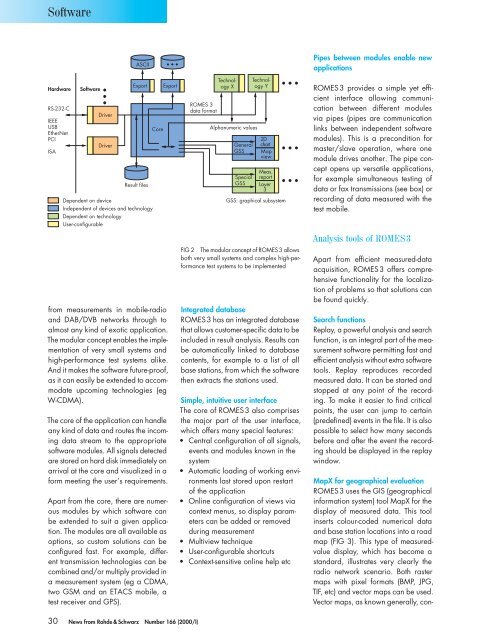
FIG 2 The modular concept of ROMES 3 allows<br />
both very small systems and complex high-performance<br />
test systems to be implemented<br />
Integrated database<br />
ROMES 3 has an integrated database<br />
that allows customer-specifi c data to be<br />
included in result analysis. Results can<br />
be automatically linked to database<br />
contents, for example to a list of all<br />
base stations, from which the software<br />
then extracts the stations used.<br />
Simple, intuitive user interface<br />
The core of ROMES 3 also comprises<br />
the major part of the user interface,<br />
which offers many special features:<br />
• Central confi guration of all signals,<br />
events and modules known in the<br />
system<br />
• Automatic loading of working environments<br />
last stored upon restart<br />
of the application<br />
• Online confi guration of views via<br />
context menus, so display parameters<br />
can be added or removed<br />
during measurement<br />
• Multiview technique<br />
• User-confi gurable shortcuts<br />
• Context-sensitive online help etc<br />
Pipes between modules enable new<br />
applications<br />
ROMES 3 provides a simple yet effi -<br />
cient interface allowing communication<br />
between different modules<br />
via pipes (pipes are communication<br />
links between independent software<br />
modules). This is a precondition for<br />
master/slave operation, where one<br />
module drives another. The pipe concept<br />
opens up versatile applications,<br />
for example simultaneous testing of<br />
data or fax transmissions (see box) or<br />
recording of data measured with the<br />
test mobile.<br />
Analysis tools of ROMES 3<br />
Apart from effi cient measured-data<br />
acquisition, ROMES 3 offers comprehensive<br />
functionality for the localization<br />
of problems so that solutions can<br />
be found quickly.<br />
Search functions<br />
Replay, a powerful analysis and search<br />
function, is an integral part of the measurement<br />
software permitting fast and<br />
effi cient analysis without extra software<br />
tools. Replay reproduces recorded<br />
measured data. It can be started and<br />
stopped at any point of the recording.<br />
To make it easier to fi nd critical<br />
points, the user can jump to certain<br />
(predefi ned) events in the fi le. It is also<br />
possible to select how many seconds<br />
before and after the event the recording<br />
should be displayed in the replay<br />
window.<br />
MapX for geographical evaluation<br />
ROMES 3 uses the GIS (geographical<br />
information system) tool MapX for the<br />
display of measured data. This tool<br />
inserts colour-coded numerical data<br />
and base station locations into a road<br />
map (FIG 3). This type of measuredvalue<br />
display, which has become a<br />
standard, illustrates very clearly the<br />
radio network scenario. Both raster<br />
maps with pixel formats (BMP, JPG,<br />
TIF, etc) and vector maps can be used.<br />
Vector maps, as known generally, con-