English - Rohde & Schwarz
English - Rohde & Schwarz
English - Rohde & Schwarz

You also want an ePaper? Increase the reach of your titles
YUMPU automatically turns print PDFs into web optimized ePapers that Google loves.
Use of pipes<br />
Example: simultaneous testing of data<br />
or fax transmission with recording of<br />
signalling<br />
Network operators will in future have<br />
to test not only voice but, to an increasing<br />
extent, also data and fax transmission.<br />
Signalling is recorded along<br />
with data transmission, and time and<br />
location information is added. Since<br />
ROMES 3 stores all this information in<br />
one fi le correlated in time and location,<br />
analysis can be carried out immediately<br />
and effi ciently without the need<br />
for combining the data fi rst.<br />
This is possible through the use of<br />
pipes. The test mobile acts as a master.<br />
It is connected with the slave, ie the<br />
fax or data driver, via a pipe (FIG 4).<br />
During measurement the test-mobile<br />
driver signals to the slave via the pipe<br />
when it is available for fax and data<br />
functionality. The slave can store data<br />
during measurement and route them to<br />
the test-mobile driver in analog form.<br />
ROMES 3 displays the results in a clearcut<br />
representation (FIG 5).<br />
FIG 5 Test results of fax transmission<br />
with layer 3 information<br />
tain position information allocated to<br />
the individual objects, whereas raster<br />
maps have to be adjusted fi rst. For this,<br />
ROMES 3 offers a simple procedure:<br />
the unreferenced raster map is set up<br />
with reference to the test tour, ie specifi<br />
c points of the tour are assigned to<br />
specifi c points on the map. The rest is<br />
done by the referencing tool.<br />
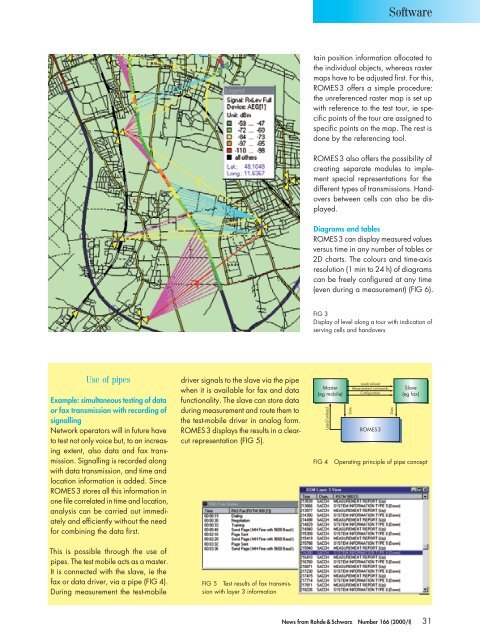
ROMES 3 also offers the possibility of<br />
creating separate modules to implement<br />
special representations for the<br />
different types of transmissions. Handovers<br />
between cells can also be displayed.<br />
Diagrams and tables<br />
ROMES 3 can display measured values<br />
versus time in any number of tables or<br />
2D charts. The colours and time-axis<br />
resolution (1 min to 24 h) of diagrams<br />
can be freely confi gured at any time<br />
(even during a measurement) (FIG 6).<br />
FIG 3<br />
Display of level along a tour with indication of<br />
serving cells and handovers<br />
Master<br />
(eg mobile)<br />
Load/unload<br />
Data<br />
Load/unload<br />
Measurement commands<br />
Configuration<br />
ROMES3<br />
Software<br />
Data<br />
Slave<br />
(eg fax)<br />
FIG 4 Operating principle of pipe concept<br />
News from <strong>Rohde</strong> & <strong>Schwarz</strong> Number 166 (2000/I) 31