Pro-Inflammatory CD11c CD206 Adipose Tissue ... - Diabetes
Pro-Inflammatory CD11c CD206 Adipose Tissue ... - Diabetes
Pro-Inflammatory CD11c CD206 Adipose Tissue ... - Diabetes

You also want an ePaper? Increase the reach of your titles
YUMPU automatically turns print PDFs into web optimized ePapers that Google loves.
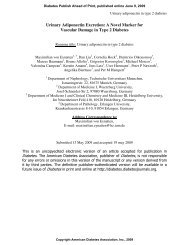
TABLE 1<br />
Clinical characteristics of the FOb, Ob, and ObMS women studied*<br />
FOb (n � 5)<br />
Obese Lean<br />
Ob (n � 12) ObMS (n � 12)<br />
Age (years) 35 � 5 (20–52) 39 � 6 (21–54)† 46 � 2 (28–55) 47 � 3 (30–61)†<br />
BMI (kg/m 2 ) 40 � 3 (34–46) 26 � 1 (23–30)‡ 46 � 1 (39–53) 44 � 1 (39–56)<br />
Waist-to-hip ratio<br />
Fasting glucose<br />
0.85 � 0.01 (0.82–0.87) 0.80 � 0.01 (0.76–0.82)‡ 0.85 � 0.02 (0.75–0.98) 0.93 � 0.02 (0.86–1.1)‡§<br />
(mmol/l)<br />
Fasting insulin<br />
4.6 � 0.3 (3.8–5.5) 4.5 � 0.2 (4.1–5.0) 5.0 � 0.1 (4.7–5.5) 6.4 � 0.5 (5.0–10.0)†§<br />
(mIU/l) 12 � 1 (8–15) 4 � 0.4 (3–5)‡ 13 � 2 (4–26) 24 � 3 (13–47)§<br />
HOMA-IR<br />
Fasting triglycerides<br />
1.5 � 0.2 (1.0–2.0) 0.46 � 0.05 (0.4–0.6)‡ 1.6 � 0.3 (0.5–3.3) 3.2 � 0.4 (1.7–6.3)‡§<br />
(mmol/l) 1.4 � 0.3 (0.8–2.5) 1.0 � 0.2 (0.7–1.7) 1.4 � 0.1 (0.6–2.5) 2.4 � 0.4 (1.1–6.2)†�<br />
HDL (mmol/l)<br />
Alanine transaminase<br />
1.5 � 0.1 (1.4–1.7) 1.4 � 0.1 (1.1–1.7) 1.5 � 0.1 (1.2–2.0) 1.1 � 0.1 (0.7–1.7)†�<br />
(IU/l) 25 � 7 (12–53) 17 � 2 (14–22) 20 � 2 (14–35) 44 � 10 (16–144)§<br />
Hypertension 1/5 1/5 2/12 5/9<br />
Type 2 diabetes<br />
Metabolic syndrome<br />
0/5 0/5 0/12 3/12<br />
score<br />
Fasting adiponectin<br />
1.4 � 0.2 (1–2) 0.2 � 0.2 (0–1)‡ 1.3 � 0.5 (1–2) 3.4 � 0.7 (3–5)‡§<br />
(mg/l)<br />
Fasting HMW<br />
NP 19 � 3 (11–26) 13 � 1 (8–25) 11 � 1 (7–22)<br />
adiponectin (mg/l) NP 15 � 3 (7–25) 9 � 1 (5–21) 7 � 1 (4–15)<br />
Fasting leptin (mg/l) NP 47 � 5 (35–61) 64 � 7 (34–100) 65 � 9 (34–130)<br />
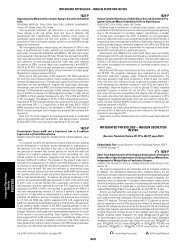
Crown ATMs are markers of insulin resistance. To<br />
determine the relationship between ATM populations and<br />
insulin resistance, ATM density was quantitated in subcutaneous<br />
and omental adipose tissue from three groups of<br />
women: formerly obese (FOb), obese (Ob), and obese with<br />
metabolic syndrome (ObMS) (Table 1). The Ob and ObMS<br />
groups were comparable in age and BMI, two independent<br />
determinants of ATM density in humans (15,17). Histologically,<br />
in both adipose tissue depots, crown ATM density<br />
was usually zero in FOb and higher in ObMS than Ob (Fig.<br />
3A). In addition, in ObMS, crown density was higher in<br />
subcutaneous than omental adipose tissue. The differences<br />
between Ob and ObMS adipose tissue were not<br />
explained by differences in adipocyte size (Fig. 3B).<br />
ATM density was then measured by flow cytometry,<br />
expressed as percent viable cells within the stromovascular<br />
population. None of the omental samples from all 29<br />
women studied contained lymphoid aggregates. Crown<br />
density and <strong>CD11c</strong> � <strong>CD206</strong> � ATM density were significantly<br />
correlated (Fig. 3C), validating flow cytometric<br />
assessment. In both subcutaneous and omental adipose<br />
tissue, obesity was associated with a significant increase<br />
in densities of <strong>CD11c</strong> � <strong>CD206</strong> � (monocyte) (not shown),<br />
<strong>CD11c</strong> � <strong>CD206</strong> � (crown) (Fig. 3D), and <strong>CD11c</strong> � (resident)<br />
(Fig. 3E) ATMs. Insulin resistance was associated with<br />
increased numbers of <strong>CD11c</strong> � <strong>CD206</strong> � ATMs (Fig. 3D) but<br />
similar numbers of <strong>CD11c</strong> � ATMs (Fig. 3E). Accordingly,<br />
the <strong>CD11c</strong> � <strong>CD206</strong> � /<strong>CD11c</strong> � ATM ratio was greater in<br />
ObMS compared with Ob subjects (Fig. 3F). Although the<br />
differences in subcutaneous and omental ATM densities<br />
between FOb, Ob, and ObMS were qualitatively similar,<br />
crown and <strong>CD11c</strong> � <strong>CD206</strong> � ATM densities were lower in<br />
omental adipose tissue. LYM and PA densities were increased<br />
and decreased, respectively, in obesity but were<br />
not significantly different between Ob and ObMS (not<br />
shown).<br />
J.M. WENTWORTH AND ASSOCIATES<br />
Continuous data are means � SE (range). *Metabolic syndrome is defined as three or more of the following: waist �88 cm, blood pressure<br />
�130/85 mmHg, fasting glucose �5.6 mmol/l, HDL �1.2 mmol/l, and triglycerides �1.7 mmol/l. †P � 0.05 cf obese FOb; ‡P � 0.005 cf obese<br />
FOb; §P � 0.005 cf Ob; �P � 0.05 cf Ob. NP, not performed.<br />
In the 24 obese women, the <strong>CD11c</strong> � <strong>CD206</strong> � /<strong>CD11c</strong> �<br />
ATM ratio correlated significantly with insulin resistance<br />
(HOMA of insulin resistance [HOMA-IR]) (Fig. 3G). In<br />
contrast, there was no correlation between HOMA-IR and<br />
<strong>CD11c</strong> � ATM density, age, or BMI. A similar and more<br />
significant correlation between the HOMA-IR and<br />
<strong>CD11c</strong> � <strong>CD206</strong> � /<strong>CD11c</strong> � ATM ratio was confirmed in another<br />
89 obese women, particularly in subcutaneous adipose<br />
tissue (Fig. 3H). These results, together with the<br />
comparison of ATM densities between the Ob and ObMS<br />
above, implicate <strong>CD11c</strong> � <strong>CD206</strong> � ATMs in the pathogenesis<br />
of insulin resistance.<br />
Crown ATMs have an M1 surface phenotype. To<br />
further characterize ATMs, cell surface marker expression<br />
was determined by flow cytometry. Results were similar<br />
for subcutaneous and omental ATMs and are shown<br />
therefore only for subcutaneous ATMs and blood monocytes<br />
(Fig. 4). Expression of the innate immune molecules<br />
CD14, Toll-like receptor (TLR)2, TLR4, and C-C receptor<br />
(CCR)2 was highest on blood monocytes, with variable<br />
expression by ATM subtypes. Expression of integrins was<br />
highest on blood monocytes and progressively declined<br />
from <strong>CD11c</strong> � <strong>CD206</strong> � to <strong>CD11c</strong> � <strong>CD206</strong> � to <strong>CD11c</strong> �<br />
ATMs. In contrast, <strong>CD11c</strong> � ATMs expressed the highest<br />
levels of CD163, a marker of alternative macrophage<br />
activation (24), and CD34, a marker of adipogenic/angiogenic<br />
ATMs (7). Finally, <strong>CD11c</strong> � <strong>CD206</strong> � ATMs expressed<br />
the highest levels of CD45, the antigen-presenting molecules<br />
CD1c and HLA-DR, and the T-cell costimulatory<br />
molecule CD86. This was most striking for CD1c, which is<br />
known to bind and present lipid antigens.<br />
Crown ATMs are the major source of proinflammatory<br />
cytokines and chemokines. To determine their<br />
potential contribution to adipose tissue inflammation,<br />
stromovascular cells were isolated and cultured overnight,<br />
and secreted cytokines and chemokines were measured in<br />
diabetes.diabetesjournals.org DIABETES, VOL. 59, JULY 2010 1651