Mechanisms for the Deterioration in Glucose Tolerance ... - Diabetes
Mechanisms for the Deterioration in Glucose Tolerance ... - Diabetes
Mechanisms for the Deterioration in Glucose Tolerance ... - Diabetes
Create successful ePaper yourself
Turn your PDF publications into a flip-book with our unique Google optimized e-Paper software.
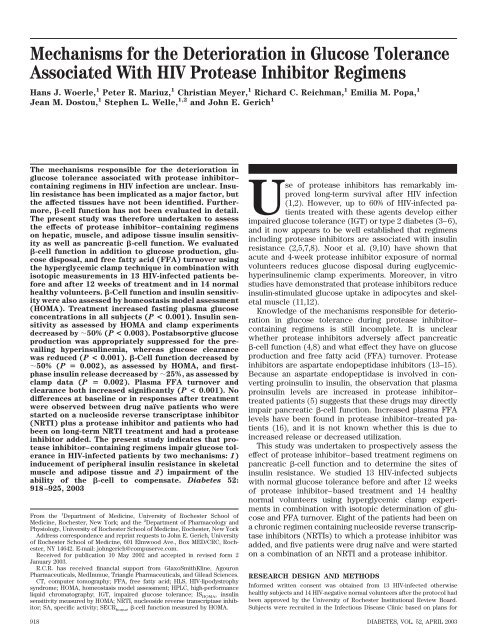
<strong>Mechanisms</strong> <strong>for</strong> <strong>the</strong> <strong>Deterioration</strong> <strong>in</strong> <strong>Glucose</strong> <strong>Tolerance</strong><br />
Associated With HIV Protease Inhibitor Regimens<br />
Hans J. Woerle, 1 Peter R. Mariuz, 1 Christian Meyer, 1 Richard C. Reichman, 1 Emilia M. Popa, 1<br />
Jean M. Dostou, 1 Stephen L. Welle, 1,2 and John E. Gerich 1<br />
The mechanisms responsible <strong>for</strong> <strong>the</strong> deterioration <strong>in</strong><br />
glucose tolerance associated with protease <strong>in</strong>hibitor–<br />
conta<strong>in</strong><strong>in</strong>g regimens <strong>in</strong> HIV <strong>in</strong>fection are unclear. Insul<strong>in</strong><br />
resistance has been implicated as a major factor, but<br />
<strong>the</strong> affected tissues have not been identified. Fur<strong>the</strong>rmore,<br />
-cell function has not been evaluated <strong>in</strong> detail.<br />
The present study was <strong>the</strong>re<strong>for</strong>e undertaken to assess<br />
<strong>the</strong> effects of protease <strong>in</strong>hibitor–conta<strong>in</strong><strong>in</strong>g regimens<br />
on hepatic, muscle, and adipose tissue <strong>in</strong>sul<strong>in</strong> sensitivity<br />
as well as pancreatic -cell function. We evaluated<br />
-cell function <strong>in</strong> addition to glucose production, glucose<br />
disposal, and free fatty acid (FFA) turnover us<strong>in</strong>g<br />
<strong>the</strong> hyperglycemic clamp technique <strong>in</strong> comb<strong>in</strong>ation with<br />
isotopic measurements <strong>in</strong> 13 HIV-<strong>in</strong>fected patients be<strong>for</strong>e<br />
and after 12 weeks of treatment and <strong>in</strong> 14 normal<br />
healthy volunteers. -Cell function and <strong>in</strong>sul<strong>in</strong> sensitivity<br />
were also assessed by homeostasis model assessment<br />
(HOMA). Treatment <strong>in</strong>creased fast<strong>in</strong>g plasma glucose<br />
concentrations <strong>in</strong> all subjects (P < 0.001). Insul<strong>in</strong> sensitivity<br />
as assessed by HOMA and clamp experiments<br />
decreased by 50% (P < 0.003). Postabsorptive glucose<br />
production was appropriately suppressed <strong>for</strong> <strong>the</strong> prevail<strong>in</strong>g<br />
hyper<strong>in</strong>sul<strong>in</strong>emia, whereas glucose clearance<br />
was reduced (P < 0.001). -Cell function decreased by<br />
50% (P 0.002), as assessed by HOMA, and firstphase<br />
<strong>in</strong>sul<strong>in</strong> release decreased by 25%, as assessed by<br />
clamp data (P 0.002). Plasma FFA turnover and<br />
clearance both <strong>in</strong>creased significantly (P < 0.001). No<br />
differences at basel<strong>in</strong>e or <strong>in</strong> responses after treatment<br />
were observed between drug naïve patients who were<br />
started on a nucleoside reverse transcriptase <strong>in</strong>hibitor<br />
(NRTI) plus a protease <strong>in</strong>hibitor and patients who had<br />
been on long-term NRTI treatment and had a protease<br />
<strong>in</strong>hibitor added. The present study <strong>in</strong>dicates that protease<br />
<strong>in</strong>hibitor–conta<strong>in</strong><strong>in</strong>g regimens impair glucose tolerance<br />
<strong>in</strong> HIV-<strong>in</strong>fected patients by two mechanisms: 1)<br />
<strong>in</strong>ducement of peripheral <strong>in</strong>sul<strong>in</strong> resistance <strong>in</strong> skeletal<br />
muscle and adipose tissue and 2) impairment of <strong>the</strong><br />
ability of <strong>the</strong> -cell to compensate. <strong>Diabetes</strong> 52:<br />
918–925, 2003<br />
From <strong>the</strong> 1 Department of Medic<strong>in</strong>e, University of Rochester School of<br />
Medic<strong>in</strong>e, Rochester, New York; and <strong>the</strong> 2 Department of Pharmacology and<br />
Physiology, University of Rochester School of Medic<strong>in</strong>e, Rochester, New York<br />
Address correspondence and repr<strong>in</strong>t requests to John E. Gerich, University<br />
of Rochester School of Medic<strong>in</strong>e, 601 Elmwood Ave., Box MED/CRC, Rochester,<br />
NY 14642. E-mail: johngerich@compuserve.com.<br />
Received <strong>for</strong> publication 10 May 2002 and accepted <strong>in</strong> revised <strong>for</strong>m 2<br />
January 2003.<br />
R.C.R. has received f<strong>in</strong>ancial support from GlaxoSmithKl<strong>in</strong>e, Agouron<br />
Pharmaceuticals, MedImmue, Triangle Pharmaceuticals, and Gilead Sciences.<br />
CT, computer tomography; FFA, free fatty acid; HLS, HIV-lipodystrophy<br />
syndrome; HOMA, homeostasis model assessment; HPLC, high-per<strong>for</strong>mance<br />
liquid chromatography; IGT, impaired glucose tolerance; IS HOMA, <strong>in</strong>sul<strong>in</strong><br />
sensitivity measured by HOMA; NRTI, nucleoside reverse transcriptase <strong>in</strong>hibitor;<br />
SA, specific activity; SECR homa, -cell function measured by HOMA.<br />
Use of protease <strong>in</strong>hibitors has remarkably improved<br />
long-term survival after HIV <strong>in</strong>fection<br />
(1,2). However, up to 60% of HIV-<strong>in</strong>fected patients<br />
treated with <strong>the</strong>se agents develop ei<strong>the</strong>r<br />
impaired glucose tolerance (IGT) or type 2 diabetes (3–6),<br />
and it now appears to be well established that regimens<br />
<strong>in</strong>clud<strong>in</strong>g protease <strong>in</strong>hibitors are associated with <strong>in</strong>sul<strong>in</strong><br />
resistance (2,5,7,8). Noor et al. (9,10) have shown that<br />
acute and 4-week protease <strong>in</strong>hibitor exposure of normal<br />
volunteers reduces glucose disposal dur<strong>in</strong>g euglycemichyper<strong>in</strong>sul<strong>in</strong>emic<br />
clamp experiments. Moreover, <strong>in</strong> vitro<br />
studies have demonstrated that protease <strong>in</strong>hibitors reduce<br />
<strong>in</strong>sul<strong>in</strong>-stimulated glucose uptake <strong>in</strong> adipocytes and skeletal<br />
muscle (11,12).<br />
Knowledge of <strong>the</strong> mechanisms responsible <strong>for</strong> deterioration<br />
<strong>in</strong> glucose tolerance dur<strong>in</strong>g protease <strong>in</strong>hibitor–<br />
conta<strong>in</strong><strong>in</strong>g regimens is still <strong>in</strong>complete. It is unclear<br />
whe<strong>the</strong>r protease <strong>in</strong>hibitors adversely affect pancreatic<br />
-cell function (4,8) and what effect <strong>the</strong>y have on glucose<br />
production and free fatty acid (FFA) turnover. Protease<br />
<strong>in</strong>hibitors are aspartate endopeptidase <strong>in</strong>hibitors (13–15).<br />
Because an aspartate endopeptidase is <strong>in</strong>volved <strong>in</strong> convert<strong>in</strong>g<br />
pro<strong>in</strong>sul<strong>in</strong> to <strong>in</strong>sul<strong>in</strong>, <strong>the</strong> observation that plasma<br />
pro<strong>in</strong>sul<strong>in</strong> levels are <strong>in</strong>creased <strong>in</strong> protease <strong>in</strong>hibitor–<br />
treated patients (5) suggests that <strong>the</strong>se drugs may directly<br />
impair pancreatic -cell function. Increased plasma FFA<br />
levels have been found <strong>in</strong> protease <strong>in</strong>hibitor–treated patients<br />
(16), and it is not known whe<strong>the</strong>r this is due to<br />
<strong>in</strong>creased release or decreased utilization.<br />
This study was undertaken to prospectively assess <strong>the</strong><br />
effect of protease <strong>in</strong>hibitor–based treatment regimens on<br />
pancreatic -cell function and to determ<strong>in</strong>e <strong>the</strong> sites of<br />
<strong>in</strong>sul<strong>in</strong> resistance. We studied 13 HIV-<strong>in</strong>fected subjects<br />
with normal glucose tolerance be<strong>for</strong>e and after 12 weeks<br />
of protease <strong>in</strong>hibitor–based treatment and 14 healthy<br />
normal volunteers us<strong>in</strong>g hyperglycemic clamp experiments<br />
<strong>in</strong> comb<strong>in</strong>ation with isotopic determ<strong>in</strong>ation of glucose<br />
and FFA turnover. Eight of <strong>the</strong> patients had been on<br />
a chronic regimen conta<strong>in</strong><strong>in</strong>g nucleoside reverse transcriptase<br />
<strong>in</strong>hibitors (NRTIs) to which a protease <strong>in</strong>hibitor was<br />
added, and five patients were drug naïve and were started<br />
on a comb<strong>in</strong>ation of an NRTI and a protease <strong>in</strong>hibitor.<br />
RESEARCH DESIGN AND METHODS<br />
In<strong>for</strong>med written consent was obta<strong>in</strong>ed from 13 HIV-<strong>in</strong>fected o<strong>the</strong>rwise<br />
healthy subjects and 14 HIV-negative normal volunteers after <strong>the</strong> protocol had<br />
been approved by <strong>the</strong> University of Rochester Institutional Review Board.<br />
Subjects were recruited <strong>in</strong> <strong>the</strong> Infectious Disease Cl<strong>in</strong>ic based on plans <strong>for</strong><br />
918 DIABETES, VOL. 52, APRIL 2003
TABLE 1<br />
Antiviral <strong>the</strong>rapy be<strong>for</strong>e and after start<strong>in</strong>g protease <strong>in</strong>hibitors<br />
Subject Pre-PI treatment Post-PI treatment Age Sex Race<br />
1 Nevirap<strong>in</strong>e, stavud<strong>in</strong>e, lamivud<strong>in</strong>e Stavud<strong>in</strong>e, lamivud<strong>in</strong>e, nelf<strong>in</strong>avir 53 M AA<br />
2 Efavirenz, abacavir, stavud<strong>in</strong>e Lamivud<strong>in</strong>e, zidovud<strong>in</strong>e, nelf<strong>in</strong>avir 35 F C<br />
3 Nevirap<strong>in</strong>e, stavud<strong>in</strong>e, lamivud<strong>in</strong>e Lamivud<strong>in</strong>e, stavud<strong>in</strong>e, nelf<strong>in</strong>avir 46 F H<br />
4 Nevirap<strong>in</strong>e, stavud<strong>in</strong>e, lamivud<strong>in</strong>e Stavud<strong>in</strong>e, lamivud<strong>in</strong>e, <strong>in</strong>d<strong>in</strong>avir, ritonavir 47 F AA<br />
5 Efavirenz, abacavir, stavud<strong>in</strong>e Abacavir, stavud<strong>in</strong>e, saqu<strong>in</strong>avir 38 F AA<br />
6 Stavud<strong>in</strong>e, lamivud<strong>in</strong>e, nevirap<strong>in</strong>e Stavud<strong>in</strong>e, lamivud<strong>in</strong>e, saqu<strong>in</strong>avir, ritonavir 31 M AA<br />
7 Stavud<strong>in</strong>e, lamivud<strong>in</strong>e, efavirenz Stavud<strong>in</strong>e, lamivud<strong>in</strong>e, nelf<strong>in</strong>avir 40 F C<br />
8 Nevirap<strong>in</strong>e, stavud<strong>in</strong>e, lamivud<strong>in</strong>e Stavud<strong>in</strong>e, lamivud<strong>in</strong>e, nelf<strong>in</strong>avir 50 M C<br />
9 None Stavud<strong>in</strong>e, lamivud<strong>in</strong>e, nelf<strong>in</strong>avir 47 M AA<br />
10 None Stavud<strong>in</strong>e, lamivud<strong>in</strong>e, nelf<strong>in</strong>avir 46 M H<br />
11 None Stavud<strong>in</strong>e, lamivud<strong>in</strong>e, nelf<strong>in</strong>avir 32 F AA<br />
12 None Zidovud<strong>in</strong>e, lamivud<strong>in</strong>e, nelf<strong>in</strong>avir 39 M AA<br />
13<br />
Normal<br />
volunteers<br />
None Lop<strong>in</strong>avir, efavirenz, lamivud<strong>in</strong>e, ritonavir 38 F C<br />
(N 14) — — 42 3 6F/8M 3AA/10C/1H<br />
Data are means SD unless o<strong>the</strong>rwise <strong>in</strong>dicated. AA, African-American; C, Caucasian; H, Hispanic; PI, protease <strong>in</strong>hibitor.<br />
<strong>in</strong>itiation of protease <strong>in</strong>hibitor treatment. All subjects had normal rout<strong>in</strong>e<br />
laboratory screen<strong>in</strong>g results <strong>in</strong>clud<strong>in</strong>g normal liver function tests and ur<strong>in</strong>alysis.<br />
None of <strong>the</strong> subjects had a family history of diabetes. Normal glucose<br />
tolerance had been ascerta<strong>in</strong>ed by fast<strong>in</strong>g plasma glucose levels 6 mmol/l<br />
and plasma glucose levels 7.8 mmol/l 2 h after a 75-g oral glucose load (17).<br />
The drug that patients received was based on <strong>the</strong> cl<strong>in</strong>ical judgment of <strong>the</strong>ir<br />
physician. Table 1 gives <strong>the</strong> drug regimens of <strong>in</strong>dividual patients be<strong>for</strong>e and<br />
after protease <strong>in</strong>hibitor treatment. Eight subjects (NRTI pretreated) had been<br />
on a comb<strong>in</strong>ation <strong>the</strong>rapy of nucleoside analogues and a non-NRTI <strong>for</strong> at least<br />
12 months; <strong>the</strong> NRTIs were cont<strong>in</strong>ued throughout <strong>the</strong> study, <strong>the</strong> non-NRTI was<br />
discont<strong>in</strong>ued, and a protease <strong>in</strong>hibitor was added. Five subjects (NRTI naïve),<br />
who were drug naïve, were started on two NRTIs plus a protease <strong>in</strong>hibitor.<br />
Thus, dur<strong>in</strong>g <strong>the</strong> treatment phase all patients were on a comb<strong>in</strong>ation of a<br />
protease <strong>in</strong>hibitor and NRTIs. None of <strong>the</strong> subjects experienced any subcutaneous<br />
fat wast<strong>in</strong>g be<strong>for</strong>e or throughout <strong>the</strong> study. All were studied on<br />
three occasions: once be<strong>for</strong>e <strong>in</strong>itiation of protease <strong>in</strong>hibitor treatment and at<br />
6 and 12 weeks <strong>the</strong>reafter. Only results of those be<strong>for</strong>e and at 12 weeks are<br />
reported.<br />
Subjects consumed a weight ma<strong>in</strong>tenance diet conta<strong>in</strong><strong>in</strong>g 200–300 g<br />
carbohydrate at least 3 days be<strong>for</strong>e <strong>the</strong> first hyperglycemic clamp experiment<br />
and throughout <strong>the</strong> whole 12-week study period.<br />
On each study occasion subjects were admitted to <strong>the</strong> cl<strong>in</strong>ical research<br />
center at 5:00 P.M. <strong>the</strong> day be<strong>for</strong>e <strong>the</strong> experiment. Between 6:00 P.M. and 7:00<br />
P.M. a standard d<strong>in</strong>ner (10 kcal/kg: 50% carbohydrate, 35% fat, and 15% prote<strong>in</strong>)<br />
was given. At 5:00 A.M. <strong>the</strong> follow<strong>in</strong>g morn<strong>in</strong>g, primed-cont<strong>in</strong>uous <strong>in</strong>fusions<br />
of [6,6- 2 H 2]glucose (24 mol/kg, 0.24 mol kg 1 m<strong>in</strong> 1 ) and [9,10- 3 H]palmitate<br />
(0.8 Ci/m<strong>in</strong>) were started via a <strong>for</strong>earm ve<strong>in</strong>. At 6:00 A.M. a retrograde<br />
venous ca<strong>the</strong>ter was <strong>in</strong>serted <strong>in</strong>to a dorsal hand ve<strong>in</strong> and ma<strong>in</strong>ta<strong>in</strong>ed <strong>in</strong> a<br />
<strong>the</strong>rmoregulated box at 65°C to obta<strong>in</strong> arterialized blood sampl<strong>in</strong>gs (18). After<br />
allow<strong>in</strong>g at least 2htoachieve isotopic steady state, basel<strong>in</strong>e samples <strong>for</strong><br />
substrate enrichments, specific activities, plasma glucose, FFAs, glycerol,<br />
<strong>in</strong>sul<strong>in</strong>, glucagon, C-peptide, and pro<strong>in</strong>sul<strong>in</strong> concentrations were collected at<br />
30, 15, and 0 m<strong>in</strong>. Just be<strong>for</strong>e beg<strong>in</strong>n<strong>in</strong>g <strong>the</strong> clamp, subjects took <strong>the</strong>ir<br />
medications. Subsequently, a primed (150 mg/kg body wt) 20% glucose<br />
<strong>in</strong>fusion was given and plasma glucose levels were clamped at 10 mmol/l (180<br />
mg/dl) <strong>for</strong> 3 h (19).<br />
Plasma <strong>in</strong>sul<strong>in</strong>, pro<strong>in</strong>sul<strong>in</strong>, and C-peptide concentrations were measured at<br />
2.5, 5.0, 7.5, 10, 15, 30, 60, 90, 120, 140, 160, and 180 m<strong>in</strong>. Samples <strong>for</strong> plasma<br />
glucose, FFA, glucagon, glycerol concentrations, enrichments, and specific<br />
activities (SAs) were collected dur<strong>in</strong>g <strong>the</strong> last hour of <strong>the</strong> clamp at 20-m<strong>in</strong><br />
<strong>in</strong>tervals (120, 140, 160, and 180 m<strong>in</strong>). Plasma glucose was measured at 5-m<strong>in</strong><br />
<strong>in</strong>tervals throughout <strong>for</strong> adjustments of glucose <strong>in</strong>fusion rates us<strong>in</strong>g a glucose<br />
analyzer (YSI <strong>Glucose</strong> Analyzer; Yellow Spr<strong>in</strong>gs Instruments). Plasma <strong>in</strong>sul<strong>in</strong><br />
(L<strong>in</strong>co Research), pro<strong>in</strong>sul<strong>in</strong> (L<strong>in</strong>co Research), C-peptide (Diagnostic Product),<br />
and glucagon (L<strong>in</strong>co Research) were measured by standard radioimmunoassays.<br />
Plasma FFA levels were measured by an enzymatic calorimetric<br />
method (NEFAC; Wako Pure Chemical). Plasma glycerol concentrations were<br />
determ<strong>in</strong>ed by standard microfluorometric assays (20). HbA 1c was determ<strong>in</strong>ed<br />
by high-per<strong>for</strong>mance liquid chromatography (HPLC).<br />
Plasma [6,6- 2 H 2]glucose enrichments were measured by gas chromato-<br />
H.J. WOERLE AND ASSOCIATES<br />
graphy mass spectroscopy (21), and plasma palmitate concentrations and SAs<br />
were determ<strong>in</strong>ed by a previously described HPLC technique (22) with<br />
coefficients of variation of 3.8 and 2.3%, respectively. Total body fat and<br />
fat-free mass was determ<strong>in</strong>ed by bioimpedance measurements (23).<br />
Calculations. First-phase <strong>in</strong>sul<strong>in</strong> release was calculated as <strong>the</strong> sum of <strong>the</strong><br />
<strong>in</strong>crements of C-peptide above basel<strong>in</strong>e at 2.5, 5.0, 7.5, and 10 m<strong>in</strong>. Secondphase<br />
<strong>in</strong>sul<strong>in</strong> release was calculated as <strong>the</strong> average C-peptide concentration<br />
dur<strong>in</strong>g <strong>the</strong> last hour of <strong>the</strong> clamp (24). Insul<strong>in</strong> sensitivity <strong>in</strong>dex (25) was<br />
calculated by divid<strong>in</strong>g <strong>the</strong> average glucose <strong>in</strong>fusion rate dur<strong>in</strong>g <strong>the</strong> last hour of<br />
<strong>the</strong> clamp (mol kg 1 m<strong>in</strong> 1 ) by <strong>the</strong> product of <strong>the</strong> average plasma <strong>in</strong>sul<strong>in</strong><br />
(pmol/l) and glucose (mmol/l) concentration dur<strong>in</strong>g <strong>the</strong> same time <strong>in</strong>terval<br />
(25).<br />
-Cell function and <strong>in</strong>sul<strong>in</strong> sensitivity were also assessed by us<strong>in</strong>g HOMA<br />
as previously described (26). Insul<strong>in</strong> sensitivity (IS HOMA) was calculated as<br />
IS HOMA 1/(135 <strong>in</strong>sul<strong>in</strong> glucose), i.e., <strong>the</strong> <strong>in</strong>verse of <strong>in</strong>sul<strong>in</strong> resistance.<br />
-Cell function (SECR homa) was calculated as SECR homa C-peptide <br />
3.33/(GLUC 3.5), where C-peptide (pmol/l) represents <strong>the</strong> average fast<strong>in</strong>g<br />
plasma C-peptide concentration and GLUC (mmol/l) <strong>the</strong> average fast<strong>in</strong>g<br />
plasma glucose concentration (27). C-peptide was used <strong>in</strong> place of<br />
<strong>the</strong> orig<strong>in</strong>ally proposed plasma <strong>in</strong>sul<strong>in</strong> because of changes <strong>in</strong> <strong>in</strong>sul<strong>in</strong> metabolism<br />
<strong>in</strong>duced by protease <strong>in</strong>hibitor treatment as described below. To evaluate<br />
<strong>the</strong> appropriateness of changes <strong>in</strong> -cell function <strong>in</strong> relation to changes <strong>in</strong><br />
<strong>in</strong>sul<strong>in</strong> sensitivity, <strong>the</strong> disposition <strong>in</strong>dex (28) was calculated as <strong>the</strong> product of<br />
-cell function and <strong>in</strong>sul<strong>in</strong> sensitivity determ<strong>in</strong>ed dur<strong>in</strong>g <strong>the</strong> clamp experiments.<br />
Dur<strong>in</strong>g <strong>the</strong> basal state be<strong>for</strong>e <strong>the</strong> clamp, rates of appearance and disappearance<br />
(turnover) of FFA were calculated us<strong>in</strong>g <strong>the</strong> steady-state equation<br />
<strong>for</strong> <strong>the</strong> <strong>in</strong>fusion of radioactive isotopes Ra(Rd) F/SA (29), where Ra<br />
represents <strong>the</strong> rate of appearance, Rd <strong>the</strong> rate of disappearance, F <strong>the</strong> <strong>in</strong>fusion<br />
rate of tracer (dpm m<strong>in</strong> 1 kg 1 ), and SA <strong>the</strong> specific activity (dpm mol 1 ).<br />
For glucose turnover, isotope enrichments (%) were substituted <strong>for</strong> SAs and<br />
corrected <strong>for</strong> <strong>the</strong> proportion of <strong>in</strong>fused [6,6- 2 H 2]glucose by subtract<strong>in</strong>g its<br />
<strong>in</strong>fusion rate from Ra(Rd). <strong>Glucose</strong> enrichments and palmitate SAs were not<br />
significantly different from one ano<strong>the</strong>r, <strong>in</strong>dicat<strong>in</strong>g that isotopic steady state<br />
had been achieved. Because <strong>the</strong>re is evidence that NRTIs may be associated<br />
with <strong>in</strong>sul<strong>in</strong> resistance (30), subjects were divided <strong>in</strong>to two groups. Group 1<br />
(NRTI pretreated, n 8) had been on an NRTI and had a protease <strong>in</strong>hibitor<br />
added; group 2 (NRTI naïve, n 5) had been drug naïve and were started on<br />
an NRTI and a protease <strong>in</strong>hibitor. The data of <strong>the</strong>se groups were compared <strong>in</strong><br />
an attempt to factor out <strong>the</strong> effects of protease <strong>in</strong>hibitors. Fur<strong>the</strong>rmore,<br />
basel<strong>in</strong>e data of NRTI pretreated volunteers was compared with those of 14<br />
healthy subjects to determ<strong>in</strong>e whe<strong>the</strong>r NRTI pretreatment had effects on<br />
<strong>in</strong>sul<strong>in</strong> sensitivity and -cell function. Unless specified o<strong>the</strong>rwise, data are<br />
given as <strong>the</strong> mean SE and were <strong>in</strong>itially evaluated by ANOVA <strong>for</strong> repeated<br />
measurements followed by Wilcoxon’s matched pairs test compar<strong>in</strong>g basel<strong>in</strong>e<br />
data with results after 12 weeks of treatment. Mann-Whitney tests were used<br />
to compare changes between <strong>the</strong> groups dur<strong>in</strong>g <strong>the</strong> treatment period as well<br />
as basel<strong>in</strong>e data. Correlations between variables were per<strong>for</strong>med us<strong>in</strong>g<br />
Spearman’s regression analysis.<br />
DIABETES, VOL. 52, APRIL 2003 919
PROTEASE INHIBITOR–INDUCED GLUCOSE INTOLERANCE<br />
TABLE 2<br />
Body composition, viral load, and CD 4 counts<br />
Basel<strong>in</strong>e 12 weeks<br />
P vs.<br />
basel<strong>in</strong>e<br />
BMI (kg/m 2 )<br />
NRTI pretreated 29.7 2.1 29.9 1.7 0.93<br />
NRTI naïve 26.7 1.6 27.3 2.6 0.92<br />
Both 29.0 1.8 28.9 1.5 0.81<br />
Normal volunteers 28.2 0.8<br />
P vs. groups<br />
Lean body mass (kg)<br />
0.34<br />
NRTI pretreated 56.4 3.8 55.9 3.6<br />
NRTI naïve 58.9 3.1 60.5 4.0<br />
Both 57.4 2.6 57.7 2.7 0.69<br />
Normal volunteers 60.1 4.9<br />
P vs. groups<br />
Body fat (kg)<br />
0.62<br />
NRTI pretreated 33.0 5.6 33.2 5.5<br />
NRTI naïve 16.5 2.9 18.2 3.0<br />
Both 26.7 4.9 27.4 4.0 0.03<br />
Normal volunteers 23.2 2.6<br />
P vs. groups 0.048<br />
CD4 counts<br />
NRTI pretreated 393 50<br />
NRTI naïve 311 51<br />
Both 361 37<br />
P vs. groups<br />
Viral load<br />
0.73<br />
NRTI pretreated 3638 1588 256 119 0.001<br />
NRTI naïve 2814 1267 511 205 0.001<br />
Both 3321 1060 355 108 0.001<br />
P vs. groups 0.82<br />
Data are means SD.<br />
RESULTS<br />
Body composition, waist-to-hip ratio, viral loads, and<br />
CD 4 counts<br />
Basel<strong>in</strong>e characteristics of <strong>the</strong> groups did not differ except<br />
that <strong>the</strong> NRTI-naïve subjects had lower <strong>in</strong>itial body fat.<br />
Dur<strong>in</strong>g 12 weeks of treatment, BMI, total body fat, and lean<br />
body mass did not change <strong>in</strong> ei<strong>the</strong>r group; viral load<br />
decreased by 80% <strong>in</strong> both groups (P 0.001) (Table 2).<br />
HbA 1c, fast<strong>in</strong>g plasma glucose, <strong>in</strong>sul<strong>in</strong>, glucagon, Cpeptide,<br />
pro<strong>in</strong>sul<strong>in</strong>, glycerol, FFAs, and plasma lipids<br />
Basel<strong>in</strong>e values, which were comparable with those of <strong>the</strong><br />
normal volunteers, and responses dur<strong>in</strong>g treatment <strong>in</strong><br />
NRTI-pretreated and NRTI-naïve groups were not significantly<br />
different (Tables 3 and 4).<br />
After 12 weeks of treatment, fast<strong>in</strong>g plasma glucose<br />
<strong>in</strong>creased <strong>in</strong> all subjects (P 0.001). Fast<strong>in</strong>g plasma<br />
<strong>in</strong>sul<strong>in</strong> also <strong>in</strong>creased (P 0.001). In contrast, fast<strong>in</strong>g<br />
plasma C-peptide and pro<strong>in</strong>sul<strong>in</strong> did not change (both P <br />
0.61). Consequently, both <strong>the</strong> plasma C-peptide–to–<strong>in</strong>sul<strong>in</strong><br />
ratio and <strong>the</strong> plasma pro<strong>in</strong>sul<strong>in</strong>–to–<strong>in</strong>sul<strong>in</strong> ratio decreased<br />
(both P 0.007). The plasma C-peptide–to–pro<strong>in</strong>sul<strong>in</strong><br />
ratio and plasma glucagon rema<strong>in</strong>ed unchanged (P 0.59<br />
and 0.69, respectively).<br />
Fast<strong>in</strong>g plasma glycerol <strong>in</strong>creased (P 0.02), whereas<br />
plasma FFAs, triglycerides, and total and HDL cholesterol<br />
rema<strong>in</strong>ed unchanged (all P 0.13). However, plasma LDL<br />
cholesterol <strong>in</strong>creased slightly but significantly (P 0.03).<br />
-Cell function and <strong>in</strong>sul<strong>in</strong> sensitivity<br />
HOMA. Basel<strong>in</strong>e values and responses to treatment were<br />
not significantly different <strong>in</strong> NRTI-pretreated and NRTI-<br />
TABLE 3<br />
HbA 1c, fast<strong>in</strong>g plasma glucose, <strong>in</strong>sul<strong>in</strong>, glucagon, C-peptide, and<br />
pro<strong>in</strong>sul<strong>in</strong><br />
Be<strong>for</strong>e 12 weeks<br />
P vs.<br />
basel<strong>in</strong>e<br />
HbA1c (%)<br />
NRTI pretreated 5.5 0.3 —<br />
NRTI naïve 5.8 0.3 —<br />
Both 5.6 0.2 —<br />
Normal volunteers 5.8 0.3<br />
P vs. groups<br />
<strong>Glucose</strong> (mmol/l)<br />
0.91<br />
NRTI pretreated 4.58 0.23 5.36 0.13<br />
NRTI naïve 4.87 0.25 5.69 0.14<br />
Both 4.69 0.11 5.49 0.11 0.001<br />
Normal volunteers 4.96 0.11<br />
P vs. groups<br />
Plasma <strong>in</strong>sul<strong>in</strong> (pmol/l)<br />
0.59<br />
NRTI pretreated 108 17 125 17<br />
NRTI naïve 61 12 87 9<br />
Both 90 13 111 11 0.001<br />
Normal volunteers 72 12<br />
P vs. groups<br />
Plasma glucagon (pg/ml)<br />
0.08<br />
NRTI pretreated 80 4 805 NRTI naïve 78 7 713 Both 79 3 7740.69 Normal volunteers 70 6<br />
P vs. groups<br />
Plasma C-peptide (nmol/l)<br />
0.98<br />
NRTI pretreated 0.77 0.13 0.73 0.08<br />
NRTI naïve 0.51 0.09 0.61 0.06<br />
Both 0.67 0.09 0.68 0.05 0.84<br />
Normal volunteers 0.54 0.06<br />
P vs. groups<br />
Plasma pro<strong>in</strong>sul<strong>in</strong> (pmol/l)<br />
0.34<br />
NRTI pretreated 13.3 2.1 13.0 1.9<br />
NRTI naïve 11.1 1.6 12.0 1.4<br />
Both 12.4 1.4 12.6 1.2 0.61<br />
Normal volunteers 12.0 1.6<br />
P vs. groups 0.87<br />
Data are means SD.<br />
naïve subjects. At basel<strong>in</strong>e, both groups had comparable<br />
<strong>in</strong>sul<strong>in</strong> sensitivity and -cell function with those of normal<br />
volunteers. After 12 weeks of treatment, both <strong>in</strong>sul<strong>in</strong><br />
sensitivity and pancreatic -cell function decreased significantly<br />
(P 0.002 and 0.003, respectively) (Tables 5 and 6<br />
and Fig. 1).<br />
Hyperglycemic clamp experiments<br />
Insul<strong>in</strong> sensitivity. Plasma glucose, <strong>in</strong>sul<strong>in</strong>, C-peptide,<br />
and pro<strong>in</strong>sul<strong>in</strong> concentrations and glucose <strong>in</strong>fusion rates<br />
are given <strong>in</strong> Fig. 1. Plasma glucose levels were not significantly<br />
different <strong>in</strong> clamps per<strong>for</strong>med at basel<strong>in</strong>e and 12<br />
weeks <strong>in</strong> all groups. The <strong>in</strong>sul<strong>in</strong> sensitivity <strong>in</strong>dex calculated<br />
by divid<strong>in</strong>g <strong>the</strong> glucose <strong>in</strong>fusion rates by <strong>the</strong> product<br />
of plasma glucose and <strong>in</strong>sul<strong>in</strong> concentrations were comparable<br />
with those of <strong>the</strong> normal volunteers, and responses<br />
to treatment were not significantly different <strong>in</strong><br />
NRTI-pretreated and NRTI-naïve subjects. The <strong>in</strong>sul<strong>in</strong> sensitivity<br />
<strong>in</strong>dex decreased significantly after treatment (P <br />
0.001).<br />
-Cell function. At basel<strong>in</strong>e, both first- and second-phase<br />
<strong>in</strong>sul<strong>in</strong> release was normal <strong>in</strong> both patient groups. After<br />
treatment, first-phase <strong>in</strong>sul<strong>in</strong> release decreased signifi-<br />
920 DIABETES, VOL. 52, APRIL 2003
TABLE 4<br />
Plasma glycerol, FFAs, triglycerides, total cholesterol, and LDL<br />
and HDL cholesterol<br />
Be<strong>for</strong>e 12 weeks<br />
P vs.<br />
basel<strong>in</strong>e<br />
Plasma glycerol (mol/l)<br />
NRTI pretreated 86.2 8.4 106 10<br />
NRTI naïve 64.3 8.3 124.6 29<br />
Both 77.7 6.6 113 13 0.02<br />
Normal volunteers 76.2 7.2<br />
P vs. groups<br />
Plasma FFA (mol/l)<br />
0.08<br />
NRTI pretreated 595 54 601 32<br />
NRTI naïve 458 72 664 136<br />
Both 542 46 625 53 0.33<br />
Normal volunteers 474 32<br />
P vs. groups<br />
Total cholesterol (mg/dl)<br />
0.26<br />
NRTI pretreated 123 7 127 8<br />
NRTI naïve 123 12 135 10<br />
Both 123 6 130 6 0.42<br />
P vs. groups<br />
HDL (mg/dl)<br />
0.98<br />
NRTI pretreated 41 5 374 NRTI naïve 37 6 363 Both 39 3 3720.78 P vs. groups<br />
LDL (mg/dl)<br />
0.81<br />
NRTI pretreated 60 5 696 NRTI naïve 74 12 89 9<br />
Both 66 5 7760.03 P vs. groups<br />
Triglycerides (mg/dl)<br />
0.92<br />
NRTI pretreated 103 11 131 18<br />
NRTI naïve 78 9 949 Both 95 8 110 13 0.13<br />
P vs. groups 0.35<br />
Data are means SD.<br />
cantly <strong>in</strong> both groups to a comparable extent (P 0.002).<br />
Second-phase <strong>in</strong>sul<strong>in</strong> release did not change <strong>in</strong> ei<strong>the</strong>r<br />
group. However, <strong>the</strong> disposition <strong>in</strong>dex, calculated from<br />
second-phase <strong>in</strong>sul<strong>in</strong> release, decreased significantly and<br />
to comparable extents <strong>in</strong> both groups (P 0.001), <strong>in</strong>dicat<strong>in</strong>g<br />
lack of appropriate -cell compensation.<br />
Systemic glucose and FFA turnovers and clearances.<br />
Basel<strong>in</strong>e values and responses to treatment did not<br />
TABLE 5<br />
HOMA assessment of -cell function and <strong>in</strong>sul<strong>in</strong> sensitivity<br />
differ among <strong>the</strong> patient groups. Fast<strong>in</strong>g plasma glucose<br />
turnover, which was normal at basel<strong>in</strong>e, decreased significantly<br />
after treatment (P 0.002). The product of basal<br />
plasma <strong>in</strong>sul<strong>in</strong> and glucose turnover, an <strong>in</strong>dex of <strong>the</strong><br />
appropriateness of endogenous glucose production <strong>for</strong> <strong>the</strong><br />
prevail<strong>in</strong>g <strong>in</strong>sul<strong>in</strong>emia, rema<strong>in</strong>ed unchanged <strong>in</strong> both<br />
groups, suggest<strong>in</strong>g appropriate suppression of endogenous<br />
glucose production. <strong>Glucose</strong> clearance, which was<br />
normal at basel<strong>in</strong>e, decreased significantly (P 0.001),<br />
<strong>in</strong>dicat<strong>in</strong>g peripheral <strong>in</strong>sul<strong>in</strong> resistance. Although plasma<br />
FFA concentrations did not change as <strong>in</strong>dicated above,<br />
both fast<strong>in</strong>g plasma FFA turnover and clearance <strong>in</strong>creased<br />
significantly after treatment (both P 0.001) (Table 7).<br />
DISCUSSION<br />
This study was undertaken to assess <strong>the</strong> effect of protease<br />
<strong>in</strong>hibitor–based treatment on pancreatic -cell function<br />
and to determ<strong>in</strong>e mechanisms and sites of <strong>in</strong>sul<strong>in</strong> resistance<br />
<strong>in</strong>duced by <strong>the</strong>se agents. We studied 13 asymptomatic<br />
HIV-<strong>in</strong>fected <strong>in</strong>dividuals be<strong>for</strong>e and after addition of a<br />
protease <strong>in</strong>hibitor, ma<strong>in</strong>ly nelf<strong>in</strong>avir (n 8). Eight of <strong>the</strong><br />
subjects had already been on NRTI-conta<strong>in</strong><strong>in</strong>g antiviral<br />
regimens and <strong>the</strong> rema<strong>in</strong><strong>in</strong>g five had been drug naïve, but<br />
<strong>for</strong> cl<strong>in</strong>ical reasons were started on both a protease<br />
<strong>in</strong>hibitor and NRTI. Some studies have suggested that<br />
NRTIs may cause <strong>in</strong>sul<strong>in</strong> resistance, whereas o<strong>the</strong>rs have<br />
not (30–32). To factor out <strong>the</strong> effect of protease <strong>in</strong>hibitor<br />
and NRTI treatment, we analyzed <strong>the</strong>se groups separately.<br />
At basel<strong>in</strong>e, -cell function and <strong>in</strong>sul<strong>in</strong> sensitivity did not<br />
differ between groups or when compared with a group of<br />
matched normal volunteers. This suggests ei<strong>the</strong>r that <strong>the</strong><br />
previous long-term NRTI treatment had not affected ei<strong>the</strong>r<br />
-cell function or <strong>in</strong>sul<strong>in</strong> sensitivity or that, if it had, its<br />
effect was too small to be detected given <strong>the</strong> number of<br />
subjects studied. Responses dur<strong>in</strong>g treatment with ei<strong>the</strong>r<br />
addition of a protease <strong>in</strong>hibitor alone or with <strong>the</strong> addition<br />
of both a protease <strong>in</strong>hibitor and NRTIs were comparable.<br />
This suggests that <strong>the</strong> effects we observed when add<strong>in</strong>g a<br />
protease <strong>in</strong>hibitor to long-term NRTI treatment or when<br />
start<strong>in</strong>g both types of agents were primarily those of <strong>the</strong><br />
protease <strong>in</strong>hibitors as previously suggested (7).<br />
After 12 weeks of treatment, we found a deterioration <strong>in</strong><br />
glucose tolerance <strong>in</strong> all subjects, as <strong>in</strong>dicated by <strong>in</strong>creased<br />
fast<strong>in</strong>g plasma glucose levels. Insul<strong>in</strong> sensitivity decreased<br />
Basel<strong>in</strong>e 12 weeks P vs. basel<strong>in</strong>e<br />
-Cell function (pmol/l mmol/l)<br />
NRTI pretreated 2,484 375 1,379 189<br />
NRTI naïve 1,352 263 937 77<br />
Both 2,049 291 1,209 132 0.002<br />
Normal volunteers 1,288 123<br />
P vs. groups<br />
Insul<strong>in</strong> sensitivity (pmol/l<br />
0.10<br />
1 mmol/l 1 )<br />
NRTI pretreated 0.49 0.24 0.24 0.05<br />
NRTI naïve 0.56 0.13 0.29 0.04<br />
Both 0.51 0.15 0.26 0.03 0.003<br />
Normal volunteers 0.50 0.07<br />
P vs. groups 0.98<br />
Data are means SD.<br />
H.J. WOERLE AND ASSOCIATES<br />
DIABETES, VOL. 52, APRIL 2003 921
PROTEASE INHIBITOR–INDUCED GLUCOSE INTOLERANCE<br />
TABLE 6<br />
Hyperglycemic clamp assessment of -cell function and <strong>in</strong>sul<strong>in</strong><br />
Basel<strong>in</strong>e 12 weeks<br />
P vs.<br />
basel<strong>in</strong>e<br />
First-phase <strong>in</strong>sul<strong>in</strong> release (nmol/l)<br />
NRTI pretreated 6.4 1.1 5.0 1.0<br />
NRTI naïve 5.2 0.6 3.6 0.4<br />
Both 5.9 0.8 4.5 0.7 0.002<br />
Normal volunteers 4.6 0.6<br />
P vs. groups<br />
Second-phase <strong>in</strong>sul<strong>in</strong> release (nmol/l)<br />
0.85<br />
NRTI pretreated 3.6 0.6 3.8 0.7<br />
NRTI naïve 3.2 0.6 2.9 0.3<br />
Both 3.5 0.5 3.5 0.5 0.98<br />
Normal volunteers 2.8 0.3<br />
P vs. groups<br />
<strong>Glucose</strong> <strong>in</strong>fusion rates (mol kg<br />
0.25<br />
1 m<strong>in</strong> 1 )<br />
NRTI pretreated 44 3 364 NRTI naïve 54 5 376 Both 48 3 363 Normal volunteers 50 6 p 0.001<br />
P vs. groups<br />
Plasma <strong>in</strong>sul<strong>in</strong> (pmol/l)<br />
0.83<br />
NRTI pretreated 836 204 1,184 298<br />
NRTI naïve 453 61 654 127<br />
Both 688 136 980 199 0.001<br />
Normal volunteers 473 119<br />
P vs. groups<br />
Insul<strong>in</strong> sensitivity <strong>in</strong>dex (ml kg<br />
0.83<br />
1 m<strong>in</strong> 1 )<br />
NRTI pretreated 9.0 2.9 5.2 1.6<br />
NRTI naïve 13.7 2.3 7.5 2.2<br />
Both 10.8 2.0 6.1 1.3<br />
Normal volunteers 14.1 2.1 0.001<br />
P vs. groups<br />
Disposition <strong>in</strong>dex (ml pmol/l kg<br />
0.32<br />
1 m<strong>in</strong> 1 nmol/l 1 )<br />
NRTI pretreated 24.9 5.4 14.0 1.8<br />
NRTI naïve 48.2 15.8 22.6 7.8<br />
Both 33.8 7.3 17.3 3.2 0.001<br />
Normal volunteers 33.6 4.6<br />
P vs. groups 0.26<br />
Data are means SD.<br />
by 40–50% as determ<strong>in</strong>ed by HOMA and <strong>the</strong> hyperglycemic<br />
clamp technique. Overall pancreatic -cell function, as<br />
assessed by HOMA, and first-phase <strong>in</strong>sul<strong>in</strong> release, assessed<br />
dur<strong>in</strong>g hyperglycemic clamp experiments, decreased<br />
significantly. Second-phase <strong>in</strong>sul<strong>in</strong> release dur<strong>in</strong>g<br />
<strong>the</strong> hyperglycemic clamp experiments was not reduced <strong>in</strong><br />
an absolute sense but with use of <strong>the</strong> disposition <strong>in</strong>dex, an<br />
assessment of <strong>the</strong> appropriateness of -cell function <strong>for</strong> a<br />
given degree of <strong>in</strong>sul<strong>in</strong> resistance, it was found to be<br />
reduced significantly. Thus, it appears that first-phase<br />
<strong>in</strong>sul<strong>in</strong> release was more severely affected than secondphase<br />
<strong>in</strong>sul<strong>in</strong> release. Our results thus confirm that protease<br />
<strong>in</strong>hibitor treatment of HIV-<strong>in</strong>fected <strong>in</strong>dividuals is<br />
associated with <strong>in</strong>sul<strong>in</strong> resistance (2,7,33); fur<strong>the</strong>rmore,<br />
our results demonstrate that this <strong>in</strong>sul<strong>in</strong> resistance is not<br />
accompanied by an appropriate compensatory <strong>in</strong>crease <strong>in</strong><br />
<strong>in</strong>sul<strong>in</strong> secretion. Indeed, <strong>the</strong>re was a strong correlation<br />
between deterioration of <strong>the</strong> disposition <strong>in</strong>dex and <strong>the</strong><br />
<strong>in</strong>crease <strong>in</strong> fast<strong>in</strong>g plasma glucose concentrations (r <br />
0.645).<br />
Various protease <strong>in</strong>hibitors (<strong>in</strong>d<strong>in</strong>avir, nelf<strong>in</strong>avir, lop<strong>in</strong>ovir,<br />
saqu<strong>in</strong>avir, and ritonavir) have been reported to cause<br />
<strong>in</strong>sul<strong>in</strong> resistance ei<strong>the</strong>r <strong>in</strong> vivo or <strong>in</strong> vitro (1,5,12,34,35). It<br />
has been suggested that <strong>in</strong>ducement of <strong>in</strong>sul<strong>in</strong> resistance<br />
by protease <strong>in</strong>hibitors may be a class effect (33), although<br />
<strong>the</strong>se agents may differ <strong>in</strong> <strong>the</strong> extent to which <strong>the</strong>y affect<br />
<strong>in</strong>sul<strong>in</strong> sensitivity (7). However, our study was not designed<br />
or powered to detect differences <strong>in</strong> magnitude<br />
among <strong>the</strong>se agents, but ra<strong>the</strong>r to assess <strong>the</strong> mechanisms<br />
responsible <strong>for</strong> <strong>the</strong> associated deterioration <strong>in</strong> glucose<br />
tolerance. S<strong>in</strong>ce most of our subjects received nelf<strong>in</strong>avir,<br />
<strong>the</strong> conclusion of a class effect must be drawn with<br />
caution.<br />
Regard<strong>in</strong>g <strong>the</strong> mechanisms/sites of <strong>in</strong>sul<strong>in</strong> resistance<br />
<strong>in</strong>duced by protease <strong>in</strong>hibitor treatment, we found a<br />
reduction <strong>in</strong> glucose disposal, whereas glucose production<br />
appeared to be appropriately reduced <strong>for</strong> <strong>the</strong> prevail<strong>in</strong>g<br />
plasma <strong>in</strong>sul<strong>in</strong> concentration. Under euglycemic-hyper<strong>in</strong>sul<strong>in</strong>emic<br />
clamp conditions, most glucose disposal occurs<br />
<strong>in</strong> skeletal muscle (25). Ind<strong>in</strong>avir has been shown to<br />
<strong>in</strong>hibit muscle glucose transport (36). Our results thus<br />
provide additional evidence that <strong>the</strong>se agents reduce skeletal<br />
muscle <strong>in</strong>sul<strong>in</strong> sensitivity.<br />
Fur<strong>the</strong>rmore, our f<strong>in</strong>d<strong>in</strong>gs suggest that <strong>the</strong>re was also<br />
<strong>in</strong>sul<strong>in</strong> resistance <strong>in</strong> adipose tissue. Although plasma FFA<br />
concentrations did not change, plasma glycerol concentra-<br />
922 DIABETES, VOL. 52, APRIL 2003
tions and plasma FFA turnover <strong>in</strong>creased. Because this<br />
occurred <strong>in</strong> <strong>the</strong> face of <strong>in</strong>creased plasma <strong>in</strong>sul<strong>in</strong> levels,<br />
<strong>the</strong>se observations provide evidence <strong>for</strong> impaired suppression<br />
of lipolysis by <strong>in</strong>sul<strong>in</strong>. The latter is consistent with<br />
recent reports that nelf<strong>in</strong>avir, saqu<strong>in</strong>avir, and ritonavir<br />
<strong>in</strong>crease lipolysis (11,35,37).<br />
We found no alteration of plasma lipids except <strong>for</strong> an<br />
<strong>in</strong>crease <strong>in</strong> LDL cholesterol. Previous studies have found<br />
no effect of <strong>in</strong>d<strong>in</strong>avir and ritonavir on LDL cholesterol <strong>in</strong><br />
normal volunteers, whereas <strong>in</strong> HIV-<strong>in</strong>fected <strong>in</strong>dividuals<br />
protease <strong>in</strong>hibitors appear to consistently <strong>in</strong>crease LDL<br />
cholesterol and have variable effects on triglycerides<br />
(9,38,39).<br />
Recently, <strong>the</strong> HIV-lipodystrophy syndrome (HLS), a condition<br />
characterized by changes <strong>in</strong> body fat redistribution,<br />
peripheral and facial fat loss, dyslipidemia, and <strong>in</strong>sul<strong>in</strong><br />
resistance has been associated with protease <strong>in</strong>hibitor and<br />
NRTI <strong>the</strong>rapy (40). It has been suggested that <strong>the</strong> changes<br />
<strong>in</strong> lipid metabolism associated with <strong>the</strong> HLS may be at<br />
least partially responsible <strong>for</strong> a deterioration <strong>in</strong> glucose<br />
tolerance (41). We did not f<strong>in</strong>d any significant changes <strong>in</strong><br />
body fat content and lean body mass or any cl<strong>in</strong>ical signs<br />
of fat redistribution <strong>in</strong> our patients ei<strong>the</strong>r be<strong>for</strong>e or after<br />
treatment. However, we did not assess changes <strong>in</strong> body fat<br />
distribution with magnetic resonance imag<strong>in</strong>g or computer<br />
tomography (CT). Thus, we cannot exclude that subtle<br />
changes <strong>in</strong> body composition might have occurred. However,<br />
changes <strong>in</strong> glucose tolerance have been reported to<br />
take place with protease <strong>in</strong>hibitors without detectable<br />
changes <strong>in</strong> body composition determ<strong>in</strong>ed by CT (9). However,<br />
we did f<strong>in</strong>d an <strong>in</strong>crease <strong>in</strong> FFA turnover and clearance<br />
after treatment. Recently, Sekhar et al. (42) provided<br />
strong evidence that <strong>the</strong> HLS is associated with <strong>in</strong>creased<br />
FFA turnover and suggested that this reflected ongo<strong>in</strong>g fat<br />
redistribution. Thus, <strong>the</strong> <strong>in</strong>creased FFA turnover that we<br />
found <strong>in</strong> <strong>the</strong> absence of obvious lipodystrophy may be an<br />
early <strong>in</strong>dicator <strong>for</strong> changes <strong>in</strong> lipid metabolism, which<br />
H.J. WOERLE AND ASSOCIATES<br />
FIG. 1. Plasma glucose, <strong>in</strong>sul<strong>in</strong>, C-peptide, and pro<strong>in</strong>sul<strong>in</strong><br />
concentrations and glucose <strong>in</strong>fusion rates <strong>in</strong> HIV subjects<br />
pre- and posttreatment and <strong>in</strong> normal volunteers.<br />
might eventually lead to <strong>the</strong> development of lipodystrophy.<br />
On <strong>the</strong> o<strong>the</strong>r hand, <strong>the</strong> <strong>in</strong>creased FFA turnover may<br />
simply reflect <strong>in</strong>sul<strong>in</strong> resistance accompany<strong>in</strong>g <strong>the</strong> treatment<br />
unrelated to <strong>the</strong> HLS. Never<strong>the</strong>less, <strong>the</strong> <strong>in</strong>sul<strong>in</strong><br />
resistance <strong>in</strong> type 2 diabetes is characterized by normal<br />
FFA turnover and reduced FFA clearance (43,44).<br />
The molecular mechanism <strong>for</strong> <strong>the</strong> deterioration <strong>in</strong> pancreatic<br />
-cell function found <strong>in</strong> <strong>the</strong> present study and <strong>in</strong> a<br />
prelim<strong>in</strong>ary report <strong>in</strong> nelf<strong>in</strong>avir-treated rats (45) rema<strong>in</strong>s to<br />
be elucidated. It had been <strong>in</strong>itially speculated that protease<br />
<strong>in</strong>hibitors may impair -cell function by <strong>in</strong>hibit<strong>in</strong>g<br />
one of <strong>the</strong> endopeptidases <strong>in</strong>volved <strong>in</strong> <strong>the</strong> cleavage of<br />
pro<strong>in</strong>sul<strong>in</strong> to <strong>in</strong>sul<strong>in</strong> (4), because <strong>in</strong>creased plasma <strong>in</strong>sul<strong>in</strong>–to–pro<strong>in</strong>sul<strong>in</strong><br />
ratios were found <strong>in</strong> protease <strong>in</strong>hibitor–<br />
treated patients (5). In <strong>the</strong> present studies we found <strong>the</strong><br />
opposite. Moreover, subsequent studies (46) <strong>in</strong> which islet<br />
cells were <strong>in</strong>cubated with protease <strong>in</strong>hibitors did not show<br />
any adverse effect on <strong>the</strong> conversion of pro<strong>in</strong>sul<strong>in</strong> to<br />
<strong>in</strong>sul<strong>in</strong>. Thus, endopeptidase <strong>in</strong>hibition does not seem to<br />
be <strong>in</strong>volved.<br />
There is evidence, however, that <strong>in</strong>sul<strong>in</strong> itself may be<br />
important <strong>for</strong> ma<strong>in</strong>ta<strong>in</strong><strong>in</strong>g normal -cell function based on<br />
<strong>the</strong> f<strong>in</strong>d<strong>in</strong>g of reduced <strong>in</strong>sul<strong>in</strong> release <strong>in</strong> mice with knockout<br />
of <strong>the</strong> <strong>in</strong>sul<strong>in</strong> receptor and <strong>in</strong>sul<strong>in</strong> receptor substrate-2<br />
(47). Conceivably, <strong>the</strong>re<strong>for</strong>e, <strong>the</strong> same mechanism by<br />
which protease <strong>in</strong>hibitor–conta<strong>in</strong><strong>in</strong>g regimens cause <strong>in</strong>sul<strong>in</strong><br />
resistance <strong>in</strong> <strong>the</strong> peripheral tissues might be operative<br />
<strong>in</strong> <strong>the</strong> pancreatic -cell.<br />
It is noteworthy that <strong>in</strong> <strong>the</strong> present study <strong>the</strong> ratio of<br />
plasma pro<strong>in</strong>sul<strong>in</strong> to plasma <strong>in</strong>sul<strong>in</strong> and <strong>the</strong> ratio of<br />
plasma C-peptide to plasma <strong>in</strong>sul<strong>in</strong> both decreased significantly<br />
with treatment, whereas <strong>the</strong> ratio of plasma pro<strong>in</strong>sul<strong>in</strong><br />
to plasma C-peptide was unaltered. Because <strong>in</strong>sul<strong>in</strong><br />
and C-peptide are secreted from <strong>the</strong> -cell <strong>in</strong> equimolar<br />
amounts, changes <strong>in</strong> <strong>the</strong> ratio of plasma C-peptide to<br />
plasma <strong>in</strong>sul<strong>in</strong> would reflect a change <strong>in</strong> <strong>the</strong> clearance of<br />
<strong>in</strong>sul<strong>in</strong> or C-peptide. The above f<strong>in</strong>d<strong>in</strong>gs are <strong>the</strong>re<strong>for</strong>e<br />
DIABETES, VOL. 52, APRIL 2003 923
PROTEASE INHIBITOR–INDUCED GLUCOSE INTOLERANCE<br />
TABLE 7<br />
Basel<strong>in</strong>e systemic glucose and FFA turnover and clearance<br />
Be<strong>for</strong>e 12 weeks<br />
P vs.<br />
basel<strong>in</strong>e<br />
<strong>Glucose</strong> turnover (mol kg 1 m<strong>in</strong> 1 )<br />
NRTI pretreated 9.6 0.8 8.4 0.7<br />
NRTI naïve 11.8 0.4 9.2 1.0<br />
Both 10.3 0.5 8.7 0.6 0.002<br />
Normal volunteers 11.3 0.5<br />
P vs. groups<br />
<strong>Glucose</strong> turnover plasma <strong>in</strong>sul<strong>in</strong><br />
(mol kg<br />
0.08<br />
1 m<strong>in</strong> 1 pmol/l 1 )<br />
NRTI pretreated 1042 201 1073 175<br />
NRTI naïve 706 131 792 101<br />
Both 913 138 965 117 0.55<br />
Normal volunteers 826 143<br />
P vs. groups<br />
<strong>Glucose</strong> clearance (ml kg<br />
0.34<br />
1 m<strong>in</strong> 1 )<br />
NRTI pretreated 2.10 0.17 1.58 0.14<br />
NRTI naïve 2.44 0.13 1.61 0.16<br />
Both 2.21 0.13 1.59 0.10 0.001<br />
Normal volunteers 2.31 0.11<br />
P vs. groups<br />
FFA turnover<br />
0.93<br />
NRTI pretreated 2.68 0.25 4.80 0.42<br />
NRTI naïve 3.12 0.31 5.89 0.90<br />
Both 2.85 0.20 5.22 0.44 0.001<br />
Normal volunteers 3.54 0.3<br />
P vs. groups<br />
FFA clearance (ml kg<br />
0.15<br />
1 m<strong>in</strong> 1 )<br />
NRTI pretreated 4.79 0.66 8.16 0.79<br />
NRTI naïve 7.26 1.02 9.20 0.86<br />
Both 5.74 0.64 8.56 0.58 0.001<br />
Normal volunteers 7.90 0.94<br />
P vs. groups 0.06<br />
Data are means SD.<br />
consistent with <strong>the</strong> conclusion that <strong>in</strong>sul<strong>in</strong> clearance had<br />
been reduced. If C-peptide clearance been altered, one<br />
would expect to f<strong>in</strong>d a change <strong>in</strong> <strong>the</strong> plasma pro<strong>in</strong>sul<strong>in</strong>–<br />
to–plasma C-peptide ratio. The practical significance of<br />
this f<strong>in</strong>d<strong>in</strong>g is that changes <strong>in</strong> plasma <strong>in</strong>sul<strong>in</strong> concentrations<br />
cannot be used as an <strong>in</strong>dex of -cell function dur<strong>in</strong>g<br />
treatment with protease <strong>in</strong>hibitor–conta<strong>in</strong><strong>in</strong>g regimens.<br />
In conclusion, <strong>the</strong> present study <strong>in</strong>dicates that protease<br />
<strong>in</strong>hibitor–conta<strong>in</strong><strong>in</strong>g regimens impair glucose tolerance <strong>in</strong><br />
HIV-<strong>in</strong>fected patients by two mechanisms: 1) <strong>in</strong>ducement<br />
of peripheral <strong>in</strong>sul<strong>in</strong> resistance <strong>in</strong> skeletal muscle and<br />
adipose tissue and 2) reduction <strong>in</strong> pancreatic -cell function.<br />
There are several cl<strong>in</strong>ical implications of this study.<br />
First, use of <strong>the</strong>se regimens may cause deterioration of<br />
glycemic control <strong>in</strong> patients with preexist<strong>in</strong>g diabetes.<br />
Second, because <strong>the</strong>se regimens appear to <strong>in</strong>duce <strong>in</strong>sul<strong>in</strong><br />
resistance predom<strong>in</strong>antly <strong>in</strong> skeletal muscle and adipose<br />
tissue, antidiabetic agents that exert <strong>the</strong>ir major action on<br />
peripheral tissues ra<strong>the</strong>r than on <strong>the</strong> liver (e.g., thiazolid<strong>in</strong>ediones)<br />
would appear advantageous (48). Third, because<br />
first-phase <strong>in</strong>sul<strong>in</strong> release appears to be more severely<br />
impaired than second-phase <strong>in</strong>sul<strong>in</strong> release, secretagogues<br />
such as <strong>the</strong> meglit<strong>in</strong>ides, which primarily improve firstphase<br />
<strong>in</strong>sul<strong>in</strong> release (49), may be preferable to sulfonylureas,<br />
which apparently only affect second-phase <strong>in</strong>sul<strong>in</strong><br />
release (49).<br />
ACKNOWLEDGMENTS<br />
This work was supported <strong>in</strong> part by Division of Research<br />
Resources GCRC Grant 5MO1 RR 00044, <strong>the</strong> National<br />
Institute of <strong>Diabetes</strong> and Digestive and Kidney Diseases<br />
Grant DK-20411 (to J.E.G.), and NIAID grant AI 27658 (to<br />
R.C.R.).<br />
We thank Mary Little <strong>for</strong> her excellent editorial assistance<br />
and <strong>the</strong> nurs<strong>in</strong>g and laboratory staff of <strong>the</strong> General<br />
Cl<strong>in</strong>ical Research Center <strong>for</strong> <strong>the</strong>ir superb help.<br />
REFERENCES<br />
1. Flexner C: HIV-protease <strong>in</strong>hibitors. N Engl J Med 338:1281–1292, 1998<br />
2. Hruz P, Murata H, Mueckler M: Adverse metabolic consequences of HIV<br />
protease <strong>in</strong>hibitor <strong>the</strong>rapy: <strong>the</strong> search <strong>for</strong> a central mechanism. Am J<br />
Physiol Endocr<strong>in</strong>ol Metab 280:E549–E553, 2001<br />
3. Lee E, Walmsley S, Fantus I: New-onset diabetes mellitus associated with<br />
protease <strong>in</strong>hibitor <strong>the</strong>rapy <strong>in</strong> an HIV-positive patient: case report and<br />
review. CMAJ 161:161–164, 1999<br />
4. Visnegarwala F, Krause K, Musher D: Severe diabetes associated with<br />
protease <strong>in</strong>hibitor <strong>the</strong>rapy. Ann Intern Med 127:947, 1997<br />
5. Behrens G, Dejam A, Schmidt H, Balks H, Brabant G, Korner T, Stoll M,<br />
Schmidt R: Impaired glucose tolerance, beta cell function and lipid<br />
metabolism <strong>in</strong> HIV patients under treatment with protease <strong>in</strong>hibitors. AIDS<br />
13:F63–F70, 1999<br />
6. Tsiodras S, Mantzoros C, Hammer S, Samore M: Effects of protease<br />
<strong>in</strong>hibitors on hyperglycemia, hyperlipidemia, and lipodystrophy: a 5-year<br />
cohort study. Arch Intern Med 160:2050–2056, 2000<br />
7. Ja<strong>in</strong> R, Furf<strong>in</strong>e E, Pedneault L, White A, Lenhard J: Metabolic complica-<br />
924 DIABETES, VOL. 52, APRIL 2003
tions associated with antiretroviral <strong>the</strong>rapy. Antiviral Res 51:151–177,<br />
2001<br />
8. Dube M, Edmondson-Melancon H, Qian D, Aqeel R, Johnson D, Buchanan<br />
T: Prospective evaluation of <strong>the</strong> effect of <strong>in</strong>itiat<strong>in</strong>g <strong>in</strong>d<strong>in</strong>avir-based <strong>the</strong>rapy<br />
on <strong>in</strong>sul<strong>in</strong> sensitivity and B-cell function <strong>in</strong> HIV-<strong>in</strong>fected patients. J Acquir<br />
Immune Defic Syndr 27:130–134, 2001<br />
9. Noor M, Lo J, Mulligan K, Schwartz J, Halvorsen R, Schambelan M,<br />
Grunfeld C: Metabolic effects of <strong>in</strong>d<strong>in</strong>avir <strong>in</strong> healthy HIV-seronegative men.<br />
AIDS 15:F11–F18, 2001<br />
10. Noor M, Seneviratne T, Aweeka F, Lo J, Schwarz J, Mulligan K, Schambelan<br />
M, Grunfeld C: Ind<strong>in</strong>avir acutely <strong>in</strong>hibits <strong>in</strong>sul<strong>in</strong>-stimulated glucose<br />
disposal <strong>in</strong> humans: a randomized, placebo-controlled study. AIDS 16:F1–<br />
F8, 2002<br />
11. Rudich A, Vanounou S, Riesenberg K, Porat M, Tirosh A, Harman-Boehm<br />
I, Greenberg AS, Schlaeffer F, Bashan N: The HIV protease <strong>in</strong>hibitor<br />
nelf<strong>in</strong>avir <strong>in</strong>duces <strong>in</strong>sul<strong>in</strong> resistance and <strong>in</strong>creases basal lipolysis <strong>in</strong> 3T3–L1<br />
adipocytes. <strong>Diabetes</strong> 50:1425–1431, 2001<br />
12. Nolte L, Yarasheski K, Kawanaka K, Fisher J, Le N, Holloszy J: The HIV<br />
protease <strong>in</strong>hibitor <strong>in</strong>d<strong>in</strong>avir decreases <strong>in</strong>sul<strong>in</strong>- and contraction-stimulated<br />
glucose transport <strong>in</strong> skeletal muscle. <strong>Diabetes</strong> 50:1397–1401, 2001<br />
13. Seelmeier S, Schmidt H, Turk V, von der Helm K: Human immunodeficiency<br />
virus has an aspartic-type protease that can be <strong>in</strong>hibited by<br />
pepstat<strong>in</strong> A. Proc Natl Acad Sci USA85:6612–6616, 1988<br />
14. Kohl N, Diehl R, Rands E, Davis L, Hanobik M, Wolanski B, Dixon R:<br />
Expression of active human immunodeficiency virus type 1 protease by<br />
non<strong>in</strong>fectious chimeric virus particles. J Virol 65:3007–3014, 1991<br />
15. DiIanni C, Davis L, Holloway M, Herber W, Darke P, Kohl N, Dixon R:<br />
Characterization of an active s<strong>in</strong>gle polypeptide <strong>for</strong>m of <strong>the</strong> human<br />
immunodeficiency virus type 1 protease. J Biol Chem 265:17348–17354,<br />
1990<br />
16. Nolan D, Mallal S: Gett<strong>in</strong>g to <strong>the</strong> HAART of <strong>in</strong>sul<strong>in</strong> resistance. AIDS<br />
15:2037–2041, 2001<br />
17. World Health Organization: WHO Expert Committee on <strong>Diabetes</strong> Mellitus.<br />
Second Report. Geneva, World Health Org., 1980 (Tech. Rep. Ser., no. 646)<br />
18. Liu D, Moberg E, Koll<strong>in</strong>d M, L<strong>in</strong>s P, Adamson U, MacDonald I: Arterial,<br />
arterialized venous, venous and capillary blood glucose measurements <strong>in</strong><br />
normal man dur<strong>in</strong>g hyper<strong>in</strong>sul<strong>in</strong>aemic euglycaemia and hypoglycaemia.<br />
Diabetologia 35:287–290, 1992<br />
19. Mitrakou A, Vuor<strong>in</strong>en-Markkola H, Raptis G, Toft I, Mokan M, Strumph P,<br />
Pimenta W, Veneman T, Jenssen T, Bolli G, Korytkowski M, Yki-Jarv<strong>in</strong>en<br />
H, Gerich J: Simultaneous assessment of <strong>in</strong>sul<strong>in</strong> secretion and <strong>in</strong>sul<strong>in</strong><br />
sensitivity us<strong>in</strong>g a hyperglycemic clamp. J Cl<strong>in</strong> Endo Metab 75:379–382,<br />
1992<br />
20. Nurjhan N, Kennedy F, Consoli A, Mart<strong>in</strong> C, Miles J, Gerich J: Quantification<br />
of <strong>the</strong> glycolytic orig<strong>in</strong> of plasma glycerol: implications <strong>for</strong> <strong>the</strong> use of<br />
<strong>the</strong> rate of appearance of plasma glycerol as an <strong>in</strong>dex of lipolysis <strong>in</strong> vivo.<br />
Metabolism 37:386–389, 1988<br />
21. Wolfe R: Radioactive and Stable Isotope Tracers <strong>in</strong> Biomedic<strong>in</strong>e: Pr<strong>in</strong>ciples<br />
and Practice of K<strong>in</strong>etic Analysis. New York, Wiley-Liss, 1992<br />
22. Miles J, Ellman M, McLean K, Jensen M: Validation of a new method <strong>for</strong><br />
determ<strong>in</strong>ation of free fatty acid turnover. Am J Physiol 252:E431–E438,<br />
1987<br />
23. Thomas B, Cornish B, Ward L: Bioelectrical impedance analysis <strong>for</strong><br />
measurement of body fluid volumes: a review. J Cl<strong>in</strong> Eng 17:505–510, 1992<br />
24. Pimenta W, Kortytkowski M, Mitrakou A, Jenssen T, Yki-Jarv<strong>in</strong>en H, Evron<br />
W, Dailey G, Gerich J: Pancreatic beta-cell dysfunction as <strong>the</strong> primary<br />
genetic lesion <strong>in</strong> NIDDM. JAMA 273:1855–1861, 1995<br />
25. DeFronzo R: <strong>Glucose</strong> <strong>in</strong>tolerance and ag<strong>in</strong>g: evidence <strong>for</strong> tissue <strong>in</strong>sensitivity<br />
to <strong>in</strong>sul<strong>in</strong>. <strong>Diabetes</strong> 28:1095–1101, 1979<br />
26. Mat<strong>the</strong>ws D, Hosker J, Rudenski A, Naylor B, Treacher D, Turner R:<br />
Homeostasis model assessment: <strong>in</strong>sul<strong>in</strong> resistance and -cell function<br />
from fast<strong>in</strong>g plasma glucose and <strong>in</strong>sul<strong>in</strong> concentrations <strong>in</strong> man. Diabetologia<br />
28:412–419, 1985<br />
27. Stumvoll M, Mitrakou A, Pimenta W, Jenssen T, Yki-Järv<strong>in</strong>en H, Van<br />
Haeften T, Renn W, Gerich J: Use of <strong>the</strong> oral glucose tolerance test to<br />
assess <strong>in</strong>sul<strong>in</strong> release and <strong>in</strong>sul<strong>in</strong> sensitivity. <strong>Diabetes</strong> Care 23:295–301,<br />
2000<br />
H.J. WOERLE AND ASSOCIATES<br />
28. Kahn S, Prigeon R, McCulloch D, Boyko E, Bergman R, Schwartz M,<br />
Neif<strong>in</strong>g J, Ward W, Beard J, Palmer J, Porte D: Quantification of <strong>the</strong><br />
relationship between <strong>in</strong>sul<strong>in</strong> sensitivity and beta-cell function <strong>in</strong> human<br />
subjects: evidence <strong>for</strong> a hyperbolic function. <strong>Diabetes</strong> 42:1663–1672, 1993<br />
29. Wolfe R: Isotopic measurement of glucose and lactate k<strong>in</strong>etics. Ann Med<br />
22:163–170, 1990<br />
30. Hadigan C, Corcoran C, Stanley T, Piecuch S, Klibanski A, Gr<strong>in</strong>spoon S:<br />
Fast<strong>in</strong>g hyper<strong>in</strong>sul<strong>in</strong>emia <strong>in</strong> human immunodeficiency virus-<strong>in</strong>fected men:<br />
relationship to body composition, gonadal function, and protease <strong>in</strong>hibitor<br />
use. J Cl<strong>in</strong> Endocr<strong>in</strong>ol Metab 85:35–41, 2000<br />
31. Sa<strong>in</strong>t-Marc T, Partisani M, Poizot-Mart<strong>in</strong> I, Bruno F, Rouviere O, Lang J-M,<br />
Gastaut J-A, Toura<strong>in</strong>e J-L: A syndrome of peripheral fat wast<strong>in</strong>g (lipodystrophy)<br />
<strong>in</strong> patients receiv<strong>in</strong>g long-term nucleoside analogue <strong>the</strong>rapy. AIDS<br />
13:1659–1667, 1999<br />
32. Mallal S, John M, Moore C, James I, McK<strong>in</strong>non E: Contribution of<br />
nucleoside analogue reverse transcriptase <strong>in</strong>hibitors to subcutaneous fat<br />
wast<strong>in</strong>g <strong>in</strong> patients with HIV <strong>in</strong>fection. AIDS 14:1309–1316, 2000<br />
33. Max B, Sherer R: Management of <strong>the</strong> adverse effects of antiretroviral<br />
<strong>the</strong>rapy and medication adherence. Cl<strong>in</strong> Infect Dis 30 (Suppl. 2):S96–S116,<br />
2000<br />
34. Murata H, Hruz P, Mueckler M: The mechanism of <strong>in</strong>sul<strong>in</strong> resistance<br />
caused by HIV protease <strong>in</strong>hibitor <strong>the</strong>rapy. J Biol Chem 275:20251–20254,<br />
2000<br />
35. Ranganathan S, Kern P: The HIV protease <strong>in</strong>hibitor saqu<strong>in</strong>avir impairs lipid<br />
metabolism and glucose transport <strong>in</strong> cultured adipocytes. J Endocr<strong>in</strong>ol<br />
172:155–162, 2002<br />
36. Martínez E, Conget I, Lozano L, Casamitjana R, Gatell J: Reversion of<br />
metabolic abnormalities after switch<strong>in</strong>g from HIV-1 protease <strong>in</strong>hibitors to<br />
nevirap<strong>in</strong>e. AIDS 13:805–810, 1999<br />
37. Lenhard J, Furf<strong>in</strong>e E, Ja<strong>in</strong> R, Ittoop O, Orband-Miller L, Blanchard S, Paulik<br />
M, Weiel J: HIV protease <strong>in</strong>hibitors block adipogenesis and <strong>in</strong>crease<br />
lipolysis <strong>in</strong> vitro. Antiviral Res 47:121–129, 2000<br />
38. Purnell J, Zambon A, Knopp R, Pizzuti D, Achari R, Leonard J, Locke C,<br />
Brunzell J: Effect of ritonavir on lipids and post-hepar<strong>in</strong> lipase activities <strong>in</strong><br />
normal subjects. AIDS 14:51–57, 2000<br />
39. Periard D, Telenti A, Sudre P, Cheseaux J, Halfon P, Reymond M,<br />
Marcov<strong>in</strong>a S, Glauser M, Nicod P, Darioli R, Mooser V: A<strong>the</strong>rogenic<br />
dyslipidemia <strong>in</strong> HIV-<strong>in</strong>fected <strong>in</strong>dividuals treated with protease <strong>in</strong>hibitors:<br />
<strong>the</strong> Swiss HIV Cohort Study. Circulation 100:700–705, 1999<br />
40. Tözsér J: HIV <strong>in</strong>hibitors: problems and reality. Ann N Y Acad Sci<br />
946:145–159, 2001<br />
41. Stricker R, Goldberg B: Fat accumulation and HIV-1 protease <strong>in</strong>hibitors.<br />
Lancet 352:1392, 1998<br />
42. Sekhar R, Jahoor F, White A, Pownall H, Visnegarwala F, Rodriguez-<br />
Barradas M, Sharma M, Reeds P, Balasubramanyam A: Metabolic basis of<br />
HIV-lipodystrophy syndrome. Am J Physiol Endocr<strong>in</strong>ol Metab 283:E332–<br />
E337, 2002<br />
43. Meyer C, Stumvoll M, Nadkarni V, Dostou J, Mitrakou A, Gerich J:<br />
Abnormal renal and hepatic glucose metabolism <strong>in</strong> type 2 diabetes<br />
mellitus. J Cl<strong>in</strong> Invest 102:619–624, 1998<br />
44. Task<strong>in</strong>en M, Bogardus C, Kennedy A, Howard B: Multiple disturbances of<br />
free fatty acid metabolism <strong>in</strong> non<strong>in</strong>sul<strong>in</strong> dependent diabetes. J Cl<strong>in</strong> Invest<br />
76:637–644, 1985<br />
45. Shankar S, Wu Y, Zhu J, Baron A, Dube M, Shankar R: Nelf<strong>in</strong>avir impairs<br />
<strong>in</strong>sul<strong>in</strong> secretion and paradoxically enhances <strong>in</strong>sul<strong>in</strong> sensitivity (Abstract).<br />
<strong>Diabetes</strong> 50 (Suppl. 2):A321, 2001<br />
46. Danoff A, L<strong>in</strong>g W: Protease <strong>in</strong>hibitors do not <strong>in</strong>terfere with prohormone<br />
process<strong>in</strong>g. Ann Intern Med 132:330, 2000<br />
47. Kadowaki T: Insights <strong>in</strong>to <strong>in</strong>sul<strong>in</strong> resistance and type 2 diabetes from<br />
knockout mouse models. J Cl<strong>in</strong> Invest 106:459–465, 2000<br />
48. Walli R, Michl G, Muhlbayer D, Br<strong>in</strong>kmann L, Goebel F: Effects of<br />
troglitazone on <strong>in</strong>sul<strong>in</strong> sensitivity <strong>in</strong> HIV-<strong>in</strong>fected patients with protease<br />
<strong>in</strong>hibitor-associated diabetes mellitus. Res Exp Med (Berl) 199:253–262,<br />
2000<br />
49. Lebovitz H: Insul<strong>in</strong> secretogogues: old and new. Diab Rev 7:139–153, 1999<br />
DIABETES, VOL. 52, APRIL 2003 925


