Mechanisms for the Deterioration in Glucose Tolerance ... - Diabetes
Mechanisms for the Deterioration in Glucose Tolerance ... - Diabetes
Mechanisms for the Deterioration in Glucose Tolerance ... - Diabetes

You also want an ePaper? Increase the reach of your titles
YUMPU automatically turns print PDFs into web optimized ePapers that Google loves.
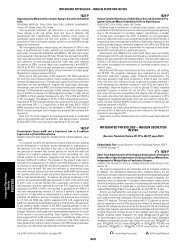
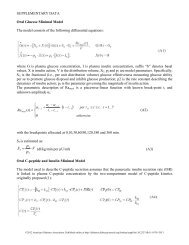
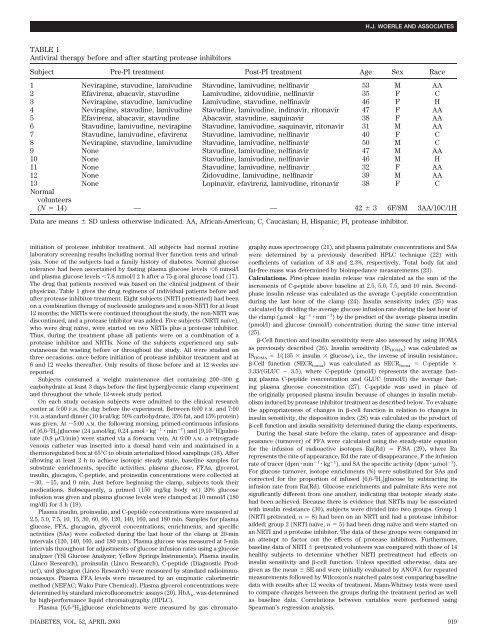
TABLE 1<br />
Antiviral <strong>the</strong>rapy be<strong>for</strong>e and after start<strong>in</strong>g protease <strong>in</strong>hibitors<br />
Subject Pre-PI treatment Post-PI treatment Age Sex Race<br />
1 Nevirap<strong>in</strong>e, stavud<strong>in</strong>e, lamivud<strong>in</strong>e Stavud<strong>in</strong>e, lamivud<strong>in</strong>e, nelf<strong>in</strong>avir 53 M AA<br />
2 Efavirenz, abacavir, stavud<strong>in</strong>e Lamivud<strong>in</strong>e, zidovud<strong>in</strong>e, nelf<strong>in</strong>avir 35 F C<br />
3 Nevirap<strong>in</strong>e, stavud<strong>in</strong>e, lamivud<strong>in</strong>e Lamivud<strong>in</strong>e, stavud<strong>in</strong>e, nelf<strong>in</strong>avir 46 F H<br />
4 Nevirap<strong>in</strong>e, stavud<strong>in</strong>e, lamivud<strong>in</strong>e Stavud<strong>in</strong>e, lamivud<strong>in</strong>e, <strong>in</strong>d<strong>in</strong>avir, ritonavir 47 F AA<br />
5 Efavirenz, abacavir, stavud<strong>in</strong>e Abacavir, stavud<strong>in</strong>e, saqu<strong>in</strong>avir 38 F AA<br />
6 Stavud<strong>in</strong>e, lamivud<strong>in</strong>e, nevirap<strong>in</strong>e Stavud<strong>in</strong>e, lamivud<strong>in</strong>e, saqu<strong>in</strong>avir, ritonavir 31 M AA<br />
7 Stavud<strong>in</strong>e, lamivud<strong>in</strong>e, efavirenz Stavud<strong>in</strong>e, lamivud<strong>in</strong>e, nelf<strong>in</strong>avir 40 F C<br />
8 Nevirap<strong>in</strong>e, stavud<strong>in</strong>e, lamivud<strong>in</strong>e Stavud<strong>in</strong>e, lamivud<strong>in</strong>e, nelf<strong>in</strong>avir 50 M C<br />
9 None Stavud<strong>in</strong>e, lamivud<strong>in</strong>e, nelf<strong>in</strong>avir 47 M AA<br />
10 None Stavud<strong>in</strong>e, lamivud<strong>in</strong>e, nelf<strong>in</strong>avir 46 M H<br />
11 None Stavud<strong>in</strong>e, lamivud<strong>in</strong>e, nelf<strong>in</strong>avir 32 F AA<br />
12 None Zidovud<strong>in</strong>e, lamivud<strong>in</strong>e, nelf<strong>in</strong>avir 39 M AA<br />
13<br />
Normal<br />
volunteers<br />
None Lop<strong>in</strong>avir, efavirenz, lamivud<strong>in</strong>e, ritonavir 38 F C<br />
(N 14) — — 42 3 6F/8M 3AA/10C/1H<br />
Data are means SD unless o<strong>the</strong>rwise <strong>in</strong>dicated. AA, African-American; C, Caucasian; H, Hispanic; PI, protease <strong>in</strong>hibitor.<br />
<strong>in</strong>itiation of protease <strong>in</strong>hibitor treatment. All subjects had normal rout<strong>in</strong>e<br />
laboratory screen<strong>in</strong>g results <strong>in</strong>clud<strong>in</strong>g normal liver function tests and ur<strong>in</strong>alysis.<br />
None of <strong>the</strong> subjects had a family history of diabetes. Normal glucose<br />
tolerance had been ascerta<strong>in</strong>ed by fast<strong>in</strong>g plasma glucose levels 6 mmol/l<br />
and plasma glucose levels 7.8 mmol/l 2 h after a 75-g oral glucose load (17).<br />
The drug that patients received was based on <strong>the</strong> cl<strong>in</strong>ical judgment of <strong>the</strong>ir<br />
physician. Table 1 gives <strong>the</strong> drug regimens of <strong>in</strong>dividual patients be<strong>for</strong>e and<br />
after protease <strong>in</strong>hibitor treatment. Eight subjects (NRTI pretreated) had been<br />
on a comb<strong>in</strong>ation <strong>the</strong>rapy of nucleoside analogues and a non-NRTI <strong>for</strong> at least<br />
12 months; <strong>the</strong> NRTIs were cont<strong>in</strong>ued throughout <strong>the</strong> study, <strong>the</strong> non-NRTI was<br />
discont<strong>in</strong>ued, and a protease <strong>in</strong>hibitor was added. Five subjects (NRTI naïve),<br />
who were drug naïve, were started on two NRTIs plus a protease <strong>in</strong>hibitor.<br />
Thus, dur<strong>in</strong>g <strong>the</strong> treatment phase all patients were on a comb<strong>in</strong>ation of a<br />
protease <strong>in</strong>hibitor and NRTIs. None of <strong>the</strong> subjects experienced any subcutaneous<br />
fat wast<strong>in</strong>g be<strong>for</strong>e or throughout <strong>the</strong> study. All were studied on<br />
three occasions: once be<strong>for</strong>e <strong>in</strong>itiation of protease <strong>in</strong>hibitor treatment and at<br />
6 and 12 weeks <strong>the</strong>reafter. Only results of those be<strong>for</strong>e and at 12 weeks are<br />
reported.<br />
Subjects consumed a weight ma<strong>in</strong>tenance diet conta<strong>in</strong><strong>in</strong>g 200–300 g<br />
carbohydrate at least 3 days be<strong>for</strong>e <strong>the</strong> first hyperglycemic clamp experiment<br />
and throughout <strong>the</strong> whole 12-week study period.<br />
On each study occasion subjects were admitted to <strong>the</strong> cl<strong>in</strong>ical research<br />
center at 5:00 P.M. <strong>the</strong> day be<strong>for</strong>e <strong>the</strong> experiment. Between 6:00 P.M. and 7:00<br />
P.M. a standard d<strong>in</strong>ner (10 kcal/kg: 50% carbohydrate, 35% fat, and 15% prote<strong>in</strong>)<br />
was given. At 5:00 A.M. <strong>the</strong> follow<strong>in</strong>g morn<strong>in</strong>g, primed-cont<strong>in</strong>uous <strong>in</strong>fusions<br />
of [6,6- 2 H 2]glucose (24 mol/kg, 0.24 mol kg 1 m<strong>in</strong> 1 ) and [9,10- 3 H]palmitate<br />
(0.8 Ci/m<strong>in</strong>) were started via a <strong>for</strong>earm ve<strong>in</strong>. At 6:00 A.M. a retrograde<br />
venous ca<strong>the</strong>ter was <strong>in</strong>serted <strong>in</strong>to a dorsal hand ve<strong>in</strong> and ma<strong>in</strong>ta<strong>in</strong>ed <strong>in</strong> a<br />
<strong>the</strong>rmoregulated box at 65°C to obta<strong>in</strong> arterialized blood sampl<strong>in</strong>gs (18). After<br />
allow<strong>in</strong>g at least 2htoachieve isotopic steady state, basel<strong>in</strong>e samples <strong>for</strong><br />
substrate enrichments, specific activities, plasma glucose, FFAs, glycerol,<br />
<strong>in</strong>sul<strong>in</strong>, glucagon, C-peptide, and pro<strong>in</strong>sul<strong>in</strong> concentrations were collected at<br />
30, 15, and 0 m<strong>in</strong>. Just be<strong>for</strong>e beg<strong>in</strong>n<strong>in</strong>g <strong>the</strong> clamp, subjects took <strong>the</strong>ir<br />
medications. Subsequently, a primed (150 mg/kg body wt) 20% glucose<br />
<strong>in</strong>fusion was given and plasma glucose levels were clamped at 10 mmol/l (180<br />
mg/dl) <strong>for</strong> 3 h (19).<br />
Plasma <strong>in</strong>sul<strong>in</strong>, pro<strong>in</strong>sul<strong>in</strong>, and C-peptide concentrations were measured at<br />
2.5, 5.0, 7.5, 10, 15, 30, 60, 90, 120, 140, 160, and 180 m<strong>in</strong>. Samples <strong>for</strong> plasma<br />
glucose, FFA, glucagon, glycerol concentrations, enrichments, and specific<br />
activities (SAs) were collected dur<strong>in</strong>g <strong>the</strong> last hour of <strong>the</strong> clamp at 20-m<strong>in</strong><br />
<strong>in</strong>tervals (120, 140, 160, and 180 m<strong>in</strong>). Plasma glucose was measured at 5-m<strong>in</strong><br />
<strong>in</strong>tervals throughout <strong>for</strong> adjustments of glucose <strong>in</strong>fusion rates us<strong>in</strong>g a glucose<br />
analyzer (YSI <strong>Glucose</strong> Analyzer; Yellow Spr<strong>in</strong>gs Instruments). Plasma <strong>in</strong>sul<strong>in</strong><br />
(L<strong>in</strong>co Research), pro<strong>in</strong>sul<strong>in</strong> (L<strong>in</strong>co Research), C-peptide (Diagnostic Product),<br />
and glucagon (L<strong>in</strong>co Research) were measured by standard radioimmunoassays.<br />
Plasma FFA levels were measured by an enzymatic calorimetric<br />
method (NEFAC; Wako Pure Chemical). Plasma glycerol concentrations were<br />
determ<strong>in</strong>ed by standard microfluorometric assays (20). HbA 1c was determ<strong>in</strong>ed<br />
by high-per<strong>for</strong>mance liquid chromatography (HPLC).<br />
Plasma [6,6- 2 H 2]glucose enrichments were measured by gas chromato-<br />
H.J. WOERLE AND ASSOCIATES<br />
graphy mass spectroscopy (21), and plasma palmitate concentrations and SAs<br />
were determ<strong>in</strong>ed by a previously described HPLC technique (22) with<br />
coefficients of variation of 3.8 and 2.3%, respectively. Total body fat and<br />
fat-free mass was determ<strong>in</strong>ed by bioimpedance measurements (23).<br />
Calculations. First-phase <strong>in</strong>sul<strong>in</strong> release was calculated as <strong>the</strong> sum of <strong>the</strong><br />
<strong>in</strong>crements of C-peptide above basel<strong>in</strong>e at 2.5, 5.0, 7.5, and 10 m<strong>in</strong>. Secondphase<br />
<strong>in</strong>sul<strong>in</strong> release was calculated as <strong>the</strong> average C-peptide concentration<br />
dur<strong>in</strong>g <strong>the</strong> last hour of <strong>the</strong> clamp (24). Insul<strong>in</strong> sensitivity <strong>in</strong>dex (25) was<br />
calculated by divid<strong>in</strong>g <strong>the</strong> average glucose <strong>in</strong>fusion rate dur<strong>in</strong>g <strong>the</strong> last hour of<br />
<strong>the</strong> clamp (mol kg 1 m<strong>in</strong> 1 ) by <strong>the</strong> product of <strong>the</strong> average plasma <strong>in</strong>sul<strong>in</strong><br />
(pmol/l) and glucose (mmol/l) concentration dur<strong>in</strong>g <strong>the</strong> same time <strong>in</strong>terval<br />
(25).<br />
-Cell function and <strong>in</strong>sul<strong>in</strong> sensitivity were also assessed by us<strong>in</strong>g HOMA<br />
as previously described (26). Insul<strong>in</strong> sensitivity (IS HOMA) was calculated as<br />
IS HOMA 1/(135 <strong>in</strong>sul<strong>in</strong> glucose), i.e., <strong>the</strong> <strong>in</strong>verse of <strong>in</strong>sul<strong>in</strong> resistance.<br />
-Cell function (SECR homa) was calculated as SECR homa C-peptide <br />
3.33/(GLUC 3.5), where C-peptide (pmol/l) represents <strong>the</strong> average fast<strong>in</strong>g<br />
plasma C-peptide concentration and GLUC (mmol/l) <strong>the</strong> average fast<strong>in</strong>g<br />
plasma glucose concentration (27). C-peptide was used <strong>in</strong> place of<br />
<strong>the</strong> orig<strong>in</strong>ally proposed plasma <strong>in</strong>sul<strong>in</strong> because of changes <strong>in</strong> <strong>in</strong>sul<strong>in</strong> metabolism<br />
<strong>in</strong>duced by protease <strong>in</strong>hibitor treatment as described below. To evaluate<br />
<strong>the</strong> appropriateness of changes <strong>in</strong> -cell function <strong>in</strong> relation to changes <strong>in</strong><br />
<strong>in</strong>sul<strong>in</strong> sensitivity, <strong>the</strong> disposition <strong>in</strong>dex (28) was calculated as <strong>the</strong> product of<br />
-cell function and <strong>in</strong>sul<strong>in</strong> sensitivity determ<strong>in</strong>ed dur<strong>in</strong>g <strong>the</strong> clamp experiments.<br />
Dur<strong>in</strong>g <strong>the</strong> basal state be<strong>for</strong>e <strong>the</strong> clamp, rates of appearance and disappearance<br />
(turnover) of FFA were calculated us<strong>in</strong>g <strong>the</strong> steady-state equation<br />
<strong>for</strong> <strong>the</strong> <strong>in</strong>fusion of radioactive isotopes Ra(Rd) F/SA (29), where Ra<br />
represents <strong>the</strong> rate of appearance, Rd <strong>the</strong> rate of disappearance, F <strong>the</strong> <strong>in</strong>fusion<br />
rate of tracer (dpm m<strong>in</strong> 1 kg 1 ), and SA <strong>the</strong> specific activity (dpm mol 1 ).<br />
For glucose turnover, isotope enrichments (%) were substituted <strong>for</strong> SAs and<br />
corrected <strong>for</strong> <strong>the</strong> proportion of <strong>in</strong>fused [6,6- 2 H 2]glucose by subtract<strong>in</strong>g its<br />
<strong>in</strong>fusion rate from Ra(Rd). <strong>Glucose</strong> enrichments and palmitate SAs were not<br />
significantly different from one ano<strong>the</strong>r, <strong>in</strong>dicat<strong>in</strong>g that isotopic steady state<br />
had been achieved. Because <strong>the</strong>re is evidence that NRTIs may be associated<br />
with <strong>in</strong>sul<strong>in</strong> resistance (30), subjects were divided <strong>in</strong>to two groups. Group 1<br />
(NRTI pretreated, n 8) had been on an NRTI and had a protease <strong>in</strong>hibitor<br />
added; group 2 (NRTI naïve, n 5) had been drug naïve and were started on<br />
an NRTI and a protease <strong>in</strong>hibitor. The data of <strong>the</strong>se groups were compared <strong>in</strong><br />
an attempt to factor out <strong>the</strong> effects of protease <strong>in</strong>hibitors. Fur<strong>the</strong>rmore,<br />
basel<strong>in</strong>e data of NRTI pretreated volunteers was compared with those of 14<br />
healthy subjects to determ<strong>in</strong>e whe<strong>the</strong>r NRTI pretreatment had effects on<br />
<strong>in</strong>sul<strong>in</strong> sensitivity and -cell function. Unless specified o<strong>the</strong>rwise, data are<br />
given as <strong>the</strong> mean SE and were <strong>in</strong>itially evaluated by ANOVA <strong>for</strong> repeated<br />
measurements followed by Wilcoxon’s matched pairs test compar<strong>in</strong>g basel<strong>in</strong>e<br />
data with results after 12 weeks of treatment. Mann-Whitney tests were used<br />
to compare changes between <strong>the</strong> groups dur<strong>in</strong>g <strong>the</strong> treatment period as well<br />
as basel<strong>in</strong>e data. Correlations between variables were per<strong>for</strong>med us<strong>in</strong>g<br />
Spearman’s regression analysis.<br />
DIABETES, VOL. 52, APRIL 2003 919