Mechanisms for the Deterioration in Glucose Tolerance ... - Diabetes
Mechanisms for the Deterioration in Glucose Tolerance ... - Diabetes
Mechanisms for the Deterioration in Glucose Tolerance ... - Diabetes

Create successful ePaper yourself
Turn your PDF publications into a flip-book with our unique Google optimized e-Paper software.
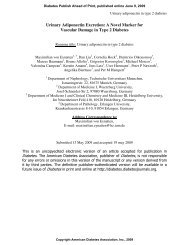
PROTEASE INHIBITOR–INDUCED GLUCOSE INTOLERANCE<br />
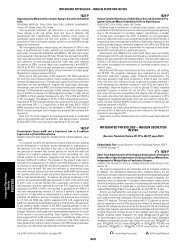
TABLE 6<br />
Hyperglycemic clamp assessment of -cell function and <strong>in</strong>sul<strong>in</strong><br />
Basel<strong>in</strong>e 12 weeks<br />
P vs.<br />
basel<strong>in</strong>e<br />
First-phase <strong>in</strong>sul<strong>in</strong> release (nmol/l)<br />
NRTI pretreated 6.4 1.1 5.0 1.0<br />
NRTI naïve 5.2 0.6 3.6 0.4<br />
Both 5.9 0.8 4.5 0.7 0.002<br />
Normal volunteers 4.6 0.6<br />
P vs. groups<br />
Second-phase <strong>in</strong>sul<strong>in</strong> release (nmol/l)<br />
0.85<br />
NRTI pretreated 3.6 0.6 3.8 0.7<br />
NRTI naïve 3.2 0.6 2.9 0.3<br />
Both 3.5 0.5 3.5 0.5 0.98<br />
Normal volunteers 2.8 0.3<br />
P vs. groups<br />
<strong>Glucose</strong> <strong>in</strong>fusion rates (mol kg<br />
0.25<br />
1 m<strong>in</strong> 1 )<br />
NRTI pretreated 44 3 364 NRTI naïve 54 5 376 Both 48 3 363 Normal volunteers 50 6 p 0.001<br />
P vs. groups<br />
Plasma <strong>in</strong>sul<strong>in</strong> (pmol/l)<br />
0.83<br />
NRTI pretreated 836 204 1,184 298<br />
NRTI naïve 453 61 654 127<br />
Both 688 136 980 199 0.001<br />
Normal volunteers 473 119<br />
P vs. groups<br />
Insul<strong>in</strong> sensitivity <strong>in</strong>dex (ml kg<br />
0.83<br />
1 m<strong>in</strong> 1 )<br />
NRTI pretreated 9.0 2.9 5.2 1.6<br />
NRTI naïve 13.7 2.3 7.5 2.2<br />
Both 10.8 2.0 6.1 1.3<br />
Normal volunteers 14.1 2.1 0.001<br />
P vs. groups<br />
Disposition <strong>in</strong>dex (ml pmol/l kg<br />
0.32<br />
1 m<strong>in</strong> 1 nmol/l 1 )<br />
NRTI pretreated 24.9 5.4 14.0 1.8<br />
NRTI naïve 48.2 15.8 22.6 7.8<br />
Both 33.8 7.3 17.3 3.2 0.001<br />
Normal volunteers 33.6 4.6<br />
P vs. groups 0.26<br />
Data are means SD.<br />
by 40–50% as determ<strong>in</strong>ed by HOMA and <strong>the</strong> hyperglycemic<br />
clamp technique. Overall pancreatic -cell function, as<br />
assessed by HOMA, and first-phase <strong>in</strong>sul<strong>in</strong> release, assessed<br />
dur<strong>in</strong>g hyperglycemic clamp experiments, decreased<br />
significantly. Second-phase <strong>in</strong>sul<strong>in</strong> release dur<strong>in</strong>g<br />
<strong>the</strong> hyperglycemic clamp experiments was not reduced <strong>in</strong><br />
an absolute sense but with use of <strong>the</strong> disposition <strong>in</strong>dex, an<br />
assessment of <strong>the</strong> appropriateness of -cell function <strong>for</strong> a<br />
given degree of <strong>in</strong>sul<strong>in</strong> resistance, it was found to be<br />
reduced significantly. Thus, it appears that first-phase<br />
<strong>in</strong>sul<strong>in</strong> release was more severely affected than secondphase<br />
<strong>in</strong>sul<strong>in</strong> release. Our results thus confirm that protease<br />
<strong>in</strong>hibitor treatment of HIV-<strong>in</strong>fected <strong>in</strong>dividuals is<br />
associated with <strong>in</strong>sul<strong>in</strong> resistance (2,7,33); fur<strong>the</strong>rmore,<br />
our results demonstrate that this <strong>in</strong>sul<strong>in</strong> resistance is not<br />
accompanied by an appropriate compensatory <strong>in</strong>crease <strong>in</strong><br />
<strong>in</strong>sul<strong>in</strong> secretion. Indeed, <strong>the</strong>re was a strong correlation<br />
between deterioration of <strong>the</strong> disposition <strong>in</strong>dex and <strong>the</strong><br />
<strong>in</strong>crease <strong>in</strong> fast<strong>in</strong>g plasma glucose concentrations (r <br />
0.645).<br />
Various protease <strong>in</strong>hibitors (<strong>in</strong>d<strong>in</strong>avir, nelf<strong>in</strong>avir, lop<strong>in</strong>ovir,<br />
saqu<strong>in</strong>avir, and ritonavir) have been reported to cause<br />
<strong>in</strong>sul<strong>in</strong> resistance ei<strong>the</strong>r <strong>in</strong> vivo or <strong>in</strong> vitro (1,5,12,34,35). It<br />
has been suggested that <strong>in</strong>ducement of <strong>in</strong>sul<strong>in</strong> resistance<br />
by protease <strong>in</strong>hibitors may be a class effect (33), although<br />
<strong>the</strong>se agents may differ <strong>in</strong> <strong>the</strong> extent to which <strong>the</strong>y affect<br />
<strong>in</strong>sul<strong>in</strong> sensitivity (7). However, our study was not designed<br />
or powered to detect differences <strong>in</strong> magnitude<br />
among <strong>the</strong>se agents, but ra<strong>the</strong>r to assess <strong>the</strong> mechanisms<br />
responsible <strong>for</strong> <strong>the</strong> associated deterioration <strong>in</strong> glucose<br />
tolerance. S<strong>in</strong>ce most of our subjects received nelf<strong>in</strong>avir,<br />
<strong>the</strong> conclusion of a class effect must be drawn with<br />
caution.<br />
Regard<strong>in</strong>g <strong>the</strong> mechanisms/sites of <strong>in</strong>sul<strong>in</strong> resistance<br />
<strong>in</strong>duced by protease <strong>in</strong>hibitor treatment, we found a<br />
reduction <strong>in</strong> glucose disposal, whereas glucose production<br />
appeared to be appropriately reduced <strong>for</strong> <strong>the</strong> prevail<strong>in</strong>g<br />
plasma <strong>in</strong>sul<strong>in</strong> concentration. Under euglycemic-hyper<strong>in</strong>sul<strong>in</strong>emic<br />
clamp conditions, most glucose disposal occurs<br />
<strong>in</strong> skeletal muscle (25). Ind<strong>in</strong>avir has been shown to<br />
<strong>in</strong>hibit muscle glucose transport (36). Our results thus<br />
provide additional evidence that <strong>the</strong>se agents reduce skeletal<br />
muscle <strong>in</strong>sul<strong>in</strong> sensitivity.<br />
Fur<strong>the</strong>rmore, our f<strong>in</strong>d<strong>in</strong>gs suggest that <strong>the</strong>re was also<br />
<strong>in</strong>sul<strong>in</strong> resistance <strong>in</strong> adipose tissue. Although plasma FFA<br />
concentrations did not change, plasma glycerol concentra-<br />
922 DIABETES, VOL. 52, APRIL 2003