Supplementary Data - Diabetes
Supplementary Data - Diabetes
Supplementary Data - Diabetes

Create successful ePaper yourself
Turn your PDF publications into a flip-book with our unique Google optimized e-Paper software.
SUPPLEMENTARY DATA<br />
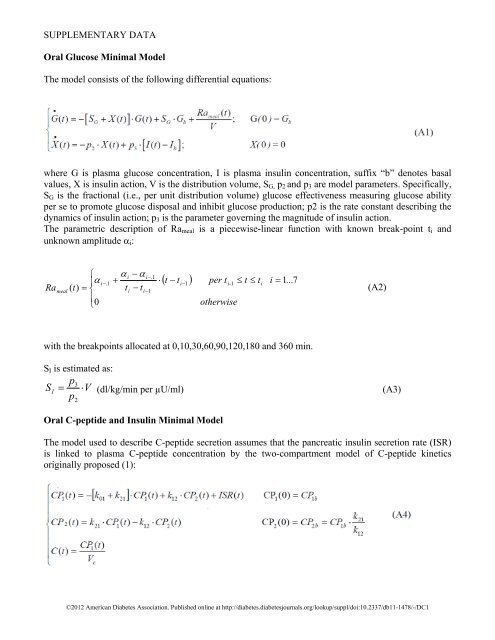
Oral Glucose Minimal Model<br />
The model consists of the following differential equations:<br />
where G is plasma glucose concentration, I is plasma insulin concentration, suffix “b” denotes basal<br />
values, X is insulin action, V is the distribution volume, SG, p2 and p3 are model parameters. Specifically,<br />
SG is the fractional (i.e., per unit distribution volume) glucose effectiveness measuring glucose ability<br />
per se to promote glucose disposal and inhibit glucose production; p2 is the rate constant describing the<br />
dynamics of insulin action; p3 is the parameter governing the magnitude of insulin action.<br />
The parametric description of Rameal is a piecewise-linear function with known break-point ti and<br />
unknown amplitude �i:<br />
Ra<br />
meal<br />
�<br />
��<br />
i<br />
( t)<br />
� �<br />
�<br />
�0<br />
�.<br />
1<br />
� i � � i<br />
�<br />
t � t<br />
i<br />
�.<br />
1<br />
i�1<br />
�<br />
�t�t� i�1<br />
per t<br />
i- 1<br />
otherwise<br />
� t � t<br />
i � 1...<br />
7<br />
with the breakpoints allocated at 0,10,30,60,90,120,180 and 360 min.<br />
©2012 American <strong>Diabetes</strong> Association. Published online at http://diabetes.diabetesjournals.org/lookup/suppl/doi:10.2337/db11-1478/-/DC1<br />
i<br />
(A2)<br />
SI is estimated as:<br />
p3<br />
SI� � V (dl/kg/min per µU/ml) (A3)<br />
p<br />
2<br />
Oral C-peptide and Insulin Minimal Model<br />
The model used to describe C-peptide secretion assumes that the pancreatic insulin secretion rate (ISR)<br />
is linked to plasma C-peptide concentration by the two-compartment model of C-peptide kinetics<br />
originally proposed (1):
SUPPLEMENTARY DATA<br />
where CP1 and CP2 (pmol) are C-peptide masses in the accessible and peripheral compartments<br />
respectively, C is the C-peptide plasma concentration, and k01, k12, and k21 (min -1 ) are C-peptide kinetic<br />
parameters and Vc the C-peptide volume of distribution, fixed to standard values (2) to assure numerical<br />
identification of the overall model. The model also assumes that ISR is made up of a basal (ISRb), a<br />
static (ISRs) and a dynamic (ISRd) component:<br />
ISRb is equal to k01� CP1b�V to guarantee the steady state conditions.<br />
ISRs is assumed equal to the provision of releasable insulin to β-cells, controlled by glucose<br />
concentration above a threshold level h:<br />
�<br />
ISRs<br />
��<br />
�<br />
Y ( t)<br />
� �<br />
��<br />
� �Y<br />
( t)<br />
� �<br />
�Y( t)<br />
� ����G( t)<br />
� h���<br />
if G � h<br />
if G � h<br />
ISRd represents the secretion of insulin from the promptly releasable pool and is proportional to the rate<br />
of increase of glucose:<br />
� dG(t)<br />
�K<br />
�<br />
ISRd(t) � � dt<br />
�<br />
�0<br />
dG(t)<br />
if � 0<br />
dt<br />
otherwise<br />
Static β-cell responsivity (Φs) is defined as:<br />
�<br />
�<br />
� �G( t)<br />
� h�<br />
and G(t)<br />
0<br />
� s � �<br />
� �<br />
(A8)<br />
dt<br />
0<br />
ISRs(<br />
t)<br />
dt<br />
Dynamic β-cell responsivity is defined as:<br />
�<br />
d<br />
�<br />
�<br />
�<br />
0<br />
�<br />
ISRd(<br />
t)<br />
dt<br />
�<br />
0<br />
dG(<br />
t)<br />
dt<br />
dt<br />
Gmax<br />
�<br />
G<br />
KdG<br />
b � � K<br />
G � G<br />
max<br />
b<br />
assuming that G(t) decreases monotonously after reaching its maximum (Gmax), that G(0)=Gb and the<br />
integral at the denominator is calculated only when the derivative of G is positive.<br />
The model used to describe insulin kinetics is a single compartment model:<br />
IDR t<br />
I� ( )<br />
( t)<br />
� �n<br />
� I(<br />
t)<br />
�<br />
V<br />
I(<br />
0)<br />
� I b<br />
(A10)<br />
I<br />
(A6)<br />
©2012 American <strong>Diabetes</strong> Association. Published online at http://diabetes.diabetesjournals.org/lookup/suppl/doi:10.2337/db11-1478/-/DC1<br />
� G<br />
b<br />
(A7)<br />
(A9)
SUPPLEMENTARY DATA<br />
where I is plasma insulin concetration, n is the fractional insulin clearance rate, VI is insulin volume of<br />
distribution and IDR is insulin delivery rate, i.e. the rate of appearance of insulin in plasma after hepatic<br />
extraction (HE). IDR, ISR and HE are linked by the following relationship:<br />
ISR(<br />
t)<br />
� IDR(<br />
t)<br />
HE(<br />
t)<br />
�<br />
ISR(<br />
t)<br />
thus<br />
ISR t � HE t �<br />
I� ( ) � 1 � ( )<br />
( t)<br />
� �n<br />
� I(<br />
t)<br />
�<br />
I(<br />
0)<br />
� I<br />
V<br />
I<br />
According to Campioni et al 2009, HE is described with a piecewise linear function:<br />
� HE<br />
�HEi�1<br />
�<br />
HE(<br />
t)<br />
� � t<br />
�<br />
�HE0<br />
� HEb<br />
i<br />
i<br />
� HE<br />
� t<br />
i�1<br />
i�1<br />
�<br />
�t�t� i�1<br />
t<br />
i�1<br />
� t � t<br />
(A11)<br />
©2012 American <strong>Diabetes</strong> Association. Published online at http://diabetes.diabetesjournals.org/lookup/suppl/doi:10.2337/db11-1478/-/DC1<br />
i<br />
b<br />
i �1,<br />
2,...<br />
6<br />
wehere HEb is the basal hepatic extraction, that can be derived from basal conncetrations:<br />
HE<br />
b<br />
k<br />
�<br />
01<br />
� Cb<br />
�Vc<br />
� k 01 � I<br />
k � C �V<br />
01<br />
b<br />
b<br />
�V<br />
I<br />
(A12)<br />
(A13)<br />
(A14)<br />
A table containing the definition of all the minimal model indices can be found in [Cobelli et al, Am. J.<br />
Physiol 2007], Table 2(3).<br />
Parameter Estimation<br />
Oral Glucose Minimal Model was numerically identified by nonlinear least squares, implemented in<br />
Matlab ® R2010b. Measurement error on glucose data was assumed to be independent, gaussian, with<br />
zero mean and known standard deviation (CV = 2%). Insulin concentration is the model forcing function<br />
and was assumed to be known without error. Model identification requires a number of assumptions<br />
which were discussed in detail in [Dalla Man et al, IEEE Trans Biomed Eng 2002] (4). Briefly, to ensure<br />
its a priori identifiability one has to assume values for V and SG. Here we fixed them to the median<br />
obtained with a triple tracer method in [Dalla Man et al Am J. Physiol, 2004] (5), i.e. V=1.45 dl/kg,<br />
SG=0.025 min -1 (median was preferred to mean values since parameters are not normally distributed).<br />
To improve numerical identifiability of the remaining parameters p2, p3, �i (i=1..7) a gaussian bayesian<br />
prior was considered on the square root of p2 ref (SQRp2 ref ), which is normally distributed: SQRp2 =0.11<br />
min -1/2 , SD=10%. Finally, a constraint was imposed to guarantee that the area under the estimated Rameal<br />
equals the total amount of ingested glucose, D, multiplied by the fraction of the ingested dose that is<br />
actually absorbed, f (fixed to the median of reference values f=0.9): this constraint provides an<br />
additional relationship among the unknown parameters �i, thus reducing the number of unknowns by<br />
one.
SUPPLEMENTARY DATA<br />
Oral C-peptide and Insulin Minimal Model was numerically identified by nonlinear least squares,<br />
implemented in Matlab ® R2010b. Measurement error on glucose data was assumed to be independent,<br />
Gaussian, with zero mean and known standard deviation, as reported in Toffolo et al 2006 (6). Glucose<br />
concentration is the model forcing function and was assumed to be known without error.<br />
The models fit glucose, C-peptide and insulin data well. Weighted residuals are shown in Figure<br />
attached online.<br />
References<br />
1. Eaton RP, Allen RC, Schade DS, Erickson KM, Standefer J: Prehepatic insulin production in man:<br />
Kinetic analysis using peripheral connecting peptide behavior. J.Clin.Endocrinol.Metab. 1989;51:520-<br />
528<br />
2. Van Cauter E, Mestrez F, Sturis J, Polonsky KS: Estimation of insulin secretion rates from C-peptide<br />
levels. Comparison of individual and standard kinetic parameters for C-peptide clearance. <strong>Diabetes</strong><br />
1992;41:368-377<br />
3. Cobelli C, Toffolo GM, Dalla Man C, Campioni M, Denti P, Caumo A, Butler P, Rizza R:<br />
Assessment of beta-cell function in humans, simultaneously with insulin sensitivity and hepatic<br />
extraction, from intravenous and oral glucose tests. American journal of physiology. Endocrinology and<br />
metabolism 2007;293:E1-E15<br />
4. Dalla Man C, Caumo A, Cobelli C: The oral glucose minimal model: estimation of insulin sensitivity<br />
from a meal test. IEEE Trans Biomed Eng 2002;49:419-429<br />
5. Dalla Man C, Caumo A, Basu R, Rizza R, Toffolo G, Cobelli C: Minimal model estimation of<br />
glucose absorption and insulin sensitivity from oral test: validation with a tracer method. Am J Physiol<br />
Endocrinol Metab 2004;287:E637-643<br />
6. Toffolo G, Basu R, Dalla Man C, Rizza R, Cobelli C: Assessment of postprandial glucose<br />
metabolism: conventional dual- vs. triple-tracer method. Am J Physiol Endocrinol Metab<br />
2006;291:E800-806<br />
©2012 American <strong>Diabetes</strong> Association. Published online at http://diabetes.diabetesjournals.org/lookup/suppl/doi:10.2337/db11-1478/-/DC1