Mechanisms for the Deterioration in Glucose Tolerance ... - Diabetes
Mechanisms for the Deterioration in Glucose Tolerance ... - Diabetes
Mechanisms for the Deterioration in Glucose Tolerance ... - Diabetes

You also want an ePaper? Increase the reach of your titles
YUMPU automatically turns print PDFs into web optimized ePapers that Google loves.
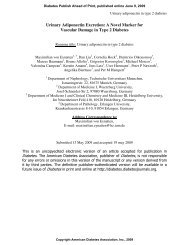
TABLE 4<br />
Plasma glycerol, FFAs, triglycerides, total cholesterol, and LDL<br />
and HDL cholesterol<br />
Be<strong>for</strong>e 12 weeks<br />
P vs.<br />
basel<strong>in</strong>e<br />
Plasma glycerol (mol/l)<br />
NRTI pretreated 86.2 8.4 106 10<br />
NRTI naïve 64.3 8.3 124.6 29<br />
Both 77.7 6.6 113 13 0.02<br />
Normal volunteers 76.2 7.2<br />
P vs. groups<br />
Plasma FFA (mol/l)<br />
0.08<br />
NRTI pretreated 595 54 601 32<br />
NRTI naïve 458 72 664 136<br />
Both 542 46 625 53 0.33<br />
Normal volunteers 474 32<br />
P vs. groups<br />
Total cholesterol (mg/dl)<br />
0.26<br />
NRTI pretreated 123 7 127 8<br />
NRTI naïve 123 12 135 10<br />
Both 123 6 130 6 0.42<br />
P vs. groups<br />
HDL (mg/dl)<br />
0.98<br />
NRTI pretreated 41 5 374 NRTI naïve 37 6 363 Both 39 3 3720.78 P vs. groups<br />
LDL (mg/dl)<br />
0.81<br />
NRTI pretreated 60 5 696 NRTI naïve 74 12 89 9<br />
Both 66 5 7760.03 P vs. groups<br />
Triglycerides (mg/dl)<br />
0.92<br />
NRTI pretreated 103 11 131 18<br />
NRTI naïve 78 9 949 Both 95 8 110 13 0.13<br />
P vs. groups 0.35<br />
Data are means SD.<br />
cantly <strong>in</strong> both groups to a comparable extent (P 0.002).<br />
Second-phase <strong>in</strong>sul<strong>in</strong> release did not change <strong>in</strong> ei<strong>the</strong>r<br />
group. However, <strong>the</strong> disposition <strong>in</strong>dex, calculated from<br />
second-phase <strong>in</strong>sul<strong>in</strong> release, decreased significantly and<br />
to comparable extents <strong>in</strong> both groups (P 0.001), <strong>in</strong>dicat<strong>in</strong>g<br />
lack of appropriate -cell compensation.<br />
Systemic glucose and FFA turnovers and clearances.<br />
Basel<strong>in</strong>e values and responses to treatment did not<br />
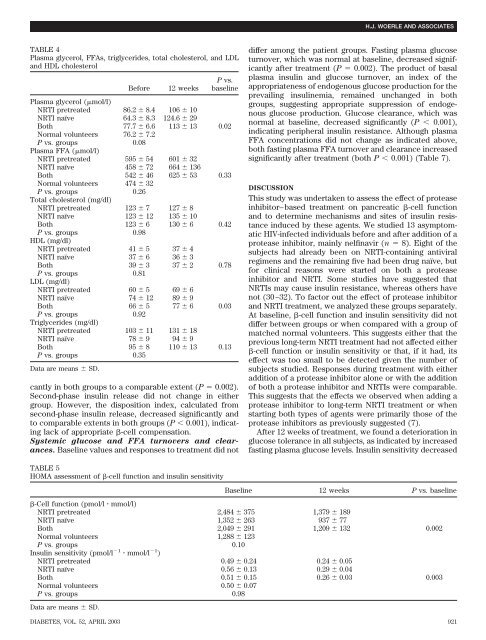
TABLE 5<br />
HOMA assessment of -cell function and <strong>in</strong>sul<strong>in</strong> sensitivity<br />
differ among <strong>the</strong> patient groups. Fast<strong>in</strong>g plasma glucose<br />
turnover, which was normal at basel<strong>in</strong>e, decreased significantly<br />
after treatment (P 0.002). The product of basal<br />
plasma <strong>in</strong>sul<strong>in</strong> and glucose turnover, an <strong>in</strong>dex of <strong>the</strong><br />
appropriateness of endogenous glucose production <strong>for</strong> <strong>the</strong><br />
prevail<strong>in</strong>g <strong>in</strong>sul<strong>in</strong>emia, rema<strong>in</strong>ed unchanged <strong>in</strong> both<br />
groups, suggest<strong>in</strong>g appropriate suppression of endogenous<br />
glucose production. <strong>Glucose</strong> clearance, which was<br />
normal at basel<strong>in</strong>e, decreased significantly (P 0.001),<br />
<strong>in</strong>dicat<strong>in</strong>g peripheral <strong>in</strong>sul<strong>in</strong> resistance. Although plasma<br />
FFA concentrations did not change as <strong>in</strong>dicated above,<br />
both fast<strong>in</strong>g plasma FFA turnover and clearance <strong>in</strong>creased<br />
significantly after treatment (both P 0.001) (Table 7).<br />
DISCUSSION<br />
This study was undertaken to assess <strong>the</strong> effect of protease<br />
<strong>in</strong>hibitor–based treatment on pancreatic -cell function<br />
and to determ<strong>in</strong>e mechanisms and sites of <strong>in</strong>sul<strong>in</strong> resistance<br />
<strong>in</strong>duced by <strong>the</strong>se agents. We studied 13 asymptomatic<br />
HIV-<strong>in</strong>fected <strong>in</strong>dividuals be<strong>for</strong>e and after addition of a<br />
protease <strong>in</strong>hibitor, ma<strong>in</strong>ly nelf<strong>in</strong>avir (n 8). Eight of <strong>the</strong><br />
subjects had already been on NRTI-conta<strong>in</strong><strong>in</strong>g antiviral<br />
regimens and <strong>the</strong> rema<strong>in</strong><strong>in</strong>g five had been drug naïve, but<br />
<strong>for</strong> cl<strong>in</strong>ical reasons were started on both a protease<br />
<strong>in</strong>hibitor and NRTI. Some studies have suggested that<br />
NRTIs may cause <strong>in</strong>sul<strong>in</strong> resistance, whereas o<strong>the</strong>rs have<br />
not (30–32). To factor out <strong>the</strong> effect of protease <strong>in</strong>hibitor<br />
and NRTI treatment, we analyzed <strong>the</strong>se groups separately.<br />
At basel<strong>in</strong>e, -cell function and <strong>in</strong>sul<strong>in</strong> sensitivity did not<br />
differ between groups or when compared with a group of<br />
matched normal volunteers. This suggests ei<strong>the</strong>r that <strong>the</strong><br />
previous long-term NRTI treatment had not affected ei<strong>the</strong>r<br />
-cell function or <strong>in</strong>sul<strong>in</strong> sensitivity or that, if it had, its<br />
effect was too small to be detected given <strong>the</strong> number of<br />
subjects studied. Responses dur<strong>in</strong>g treatment with ei<strong>the</strong>r<br />
addition of a protease <strong>in</strong>hibitor alone or with <strong>the</strong> addition<br />
of both a protease <strong>in</strong>hibitor and NRTIs were comparable.<br />
This suggests that <strong>the</strong> effects we observed when add<strong>in</strong>g a<br />
protease <strong>in</strong>hibitor to long-term NRTI treatment or when<br />
start<strong>in</strong>g both types of agents were primarily those of <strong>the</strong><br />
protease <strong>in</strong>hibitors as previously suggested (7).<br />
After 12 weeks of treatment, we found a deterioration <strong>in</strong><br />
glucose tolerance <strong>in</strong> all subjects, as <strong>in</strong>dicated by <strong>in</strong>creased<br />
fast<strong>in</strong>g plasma glucose levels. Insul<strong>in</strong> sensitivity decreased<br />
Basel<strong>in</strong>e 12 weeks P vs. basel<strong>in</strong>e<br />
-Cell function (pmol/l mmol/l)<br />
NRTI pretreated 2,484 375 1,379 189<br />
NRTI naïve 1,352 263 937 77<br />
Both 2,049 291 1,209 132 0.002<br />
Normal volunteers 1,288 123<br />
P vs. groups<br />
Insul<strong>in</strong> sensitivity (pmol/l<br />
0.10<br />
1 mmol/l 1 )<br />
NRTI pretreated 0.49 0.24 0.24 0.05<br />
NRTI naïve 0.56 0.13 0.29 0.04<br />
Both 0.51 0.15 0.26 0.03 0.003<br />
Normal volunteers 0.50 0.07<br />
P vs. groups 0.98<br />
Data are means SD.<br />
H.J. WOERLE AND ASSOCIATES<br />
DIABETES, VOL. 52, APRIL 2003 921