Chevron 2007 Annual Report Supplement
Chevron 2007 Annual Report Supplement
Chevron 2007 Annual Report Supplement
Create successful ePaper yourself
Turn your PDF publications into a flip-book with our unique Google optimized e-Paper software.
����������������<br />
�����������������<br />
������������������<br />
�������������������<br />
����<br />
����<br />
����<br />
����<br />
���<br />
Financial Information<br />
�� �� �� �� ��<br />
�������������<br />
�������������<br />
�����<br />
������������������������<br />
���������������������<br />
�������������������<br />
����<br />
����<br />
����<br />
����<br />
���<br />
�� �� �� �� ��<br />
�����������������<br />
����������<br />
��������<br />
������<br />
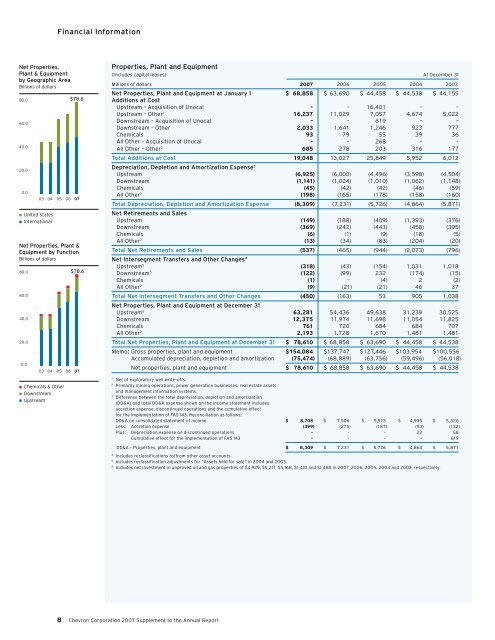
Properties, Plant and Equipment<br />
(Includes capital leases) At December 31<br />
Millions of dollars 007 2006 2005 2004 2003<br />
Net Properties, Plant and Equipment at January 1 $ 68,858 $ 63,690 $ 44,458 $ 44,538 $ 44,155<br />
Additions at Cost<br />
Upstream – Acquisition of Unocal – – 16,401 – –<br />
Upstream – Other 1 16,237 11,029 7,057 4,674 5,022<br />
Downstream – Acquisition of Unocal – – 619 – –<br />
Downstream – Other 2,033 1,641 1,246 923 777<br />
Chemicals 93 79 55 39 36<br />
All Other – Acquisition of Unocal – – 268 – –<br />
All Other – Other 2 685 278 203 316 177<br />
Total Additions at Cost 19,048 13,027 25,849 5,952 6,012<br />
Depreciation, Depletion and Amortization Expense 3<br />
Upstream (6,925) (6,000) (4,496) (3,598) (4,504)<br />
Downstream (1,141) (1,024) (1,010) (1,062) (1,148)<br />
Chemicals (45) (42) (42) (46) (59)<br />
All Other 2 (198) (165) (178) (158) (160)<br />
Total Depreciation, Depletion and Amortization Expense (8,309) (7,231) (5,726) (4,864) (5,871)<br />
Net Retirements and Sales<br />
Upstream (149) (188) (409) (1,393) (376)<br />
Downstream (369) (242) (443) (458) (395)<br />
Chemicals (6) (1) (9) (18) (5)<br />
All Other 2 (13) (34) (83) (204) (20)<br />
Total Net Retirements and Sales (537) (465) (944) (2,073) (796)<br />
Net Intersegment Transfers and Other Changes 4<br />
Upstream 5 (318) (43) (154) 1,031 1,018<br />
Downstream 5 (122) (99) 232 (174) (15)<br />
Chemicals (1) – (4) 2 (2)<br />
All Other 2 (9) (21) (21) 46 37<br />
Total Net Intersegment Transfers and Other Changes (450) (163) 53 905 1,038<br />
Net Properties, Plant and Equipment at December 31<br />
Upstream 6 63,281 54,436 49,638 31,239 30,525<br />
Downstream 12,375 11,974 11,698 11,054 11,825<br />
Chemicals 761 720 684 684 707<br />
All Other 2 2,193 1,728 1,670 1,481 1,481<br />
Total Net Properties, Plant and Equipment at December 31 $ 78,610 $ 68,858 $ 63,690 $ 44,458 $ 44,538<br />
Memo: Gross properties, plant and equipment $ 154,084 $137,747 $127,446 $103,954 $100,556<br />
Accumulated depreciation, depletion and amortization (75,474) (68,889) (63,756) (59,496) (56,018)<br />
Net properties, plant and equipment $ 78,610 $ 68,858 $ 63,690 $ 44,458 $ 44,538<br />
1 Net of exploratory well write-offs.<br />
2 Primarily mining operations, power generation businesses, real estate assets<br />
and management information systems.<br />
3 Difference between the total depreciation, depletion and amortization<br />
(DD&A) and total DD&A expense shown on the income statement includes<br />
accretion expense, discontinued operations and the cumulative effect<br />
for the implementation of FAS 143. Reconciliation as follows:<br />
DD&A on consolidated statement of income $ 8,708 $ 7,506 $ 5,913 $ 4,935 $ 5,326<br />
Less: Accretion expense (399) (275) (187) (93) (132)<br />
Plus: Depreciation expense on discontinued operations – – – 22 58<br />
Cumulative effect for the implementation of FAS 143 – – – – 619<br />
DD&A – Properties, plant and equipment $ 8,309 $ 7,231 $ 5,726 $ 4,864 $ 5,871<br />
4 Includes reclassifications to/from other asset accounts.<br />
5 Includes reclassification adjustments for “Assets held for sale” in 2004 and 2003.<br />
6 Includes net investment in unproved oil and gas properties of $4,929, $5,217, $5,168, $1,410 and $1,485 in <strong>2007</strong>, 2006, 2005, 2004 and 2003, respectively.<br />
<strong>Chevron</strong> Corporation <strong>2007</strong> <strong>Supplement</strong> to the <strong>Annual</strong> <strong>Report</strong>


