Chevron 2007 Annual Report Supplement
Chevron 2007 Annual Report Supplement
Chevron 2007 Annual Report Supplement
Create successful ePaper yourself
Turn your PDF publications into a flip-book with our unique Google optimized e-Paper software.
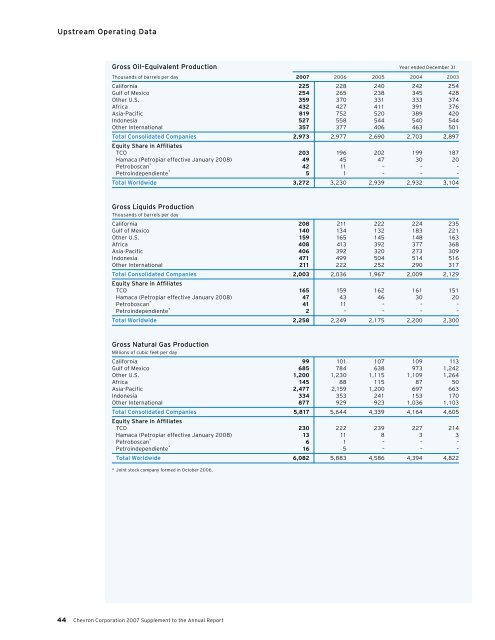
Upstream Operating Data<br />
Gross Oil–Equivalent Production Year ended December 31<br />
Thousands of barrels per day 007 2006 2005 2004 2003<br />
California 225 228 240 242 254<br />
Gulf of Mexico 254 265 238 345 428<br />
Other U.S. 359 370 331 333 374<br />
Africa 432 427 411 391 376<br />
Asia-Pacific 819 752 520 389 420<br />
Indonesia 527 558 544 540 544<br />
Other International 357 377 406 463 501<br />
Total Consolidated Companies 2,973 2,977 2,690 2,703 2,897<br />
Equity Share in Affiliates<br />
TCO 203 196 202 199 187<br />
Hamaca (Petropiar effective January 2008) 49 45 47 30 20<br />
Petroboscan * 42 11 – – –<br />
Petroindependiente * 5 1 – – –<br />
Total Worldwide 3,272 3,230 2,939 2,932 3,104<br />
Gross Liquids Production<br />
Thousands of barrels per day<br />
California 208 211 222 224 235<br />
Gulf of Mexico 140 134 132 183 221<br />
Other U.S. 159 165 145 148 163<br />
Africa 408 413 392 377 368<br />
Asia-Pacific 406 392 320 273 309<br />
Indonesia 471 499 504 514 516<br />
Other International 211 222 252 290 317<br />
Total Consolidated Companies 2,003 2,036 1,967 2,009 2,129<br />
Equity Share in Affiliates<br />
TCO 165 159 162 161 151<br />
Hamaca (Petropiar effective January 2008) 47 43 46 30 20<br />
Petroboscan * 41 11 – – –<br />
Petroindependiente * 2 – – – –<br />
Total Worldwide 2,258 2,249 2,175 2,200 2,300<br />
Gross Natural Gas Production<br />
Millions of cubic feet per day<br />
California 99 101 107 109 113<br />
Gulf of Mexico 685 784 638 973 1,242<br />
Other U.S. 1,200 1,230 1,115 1,109 1,264<br />
Africa 145 88 115 87 50<br />
Asia-Pacific 2,477 2,159 1,200 697 663<br />
Indonesia 334 353 241 153 170<br />
Other International 877 929 923 1,036 1,103<br />
Total Consolidated Companies 5,817 5,644 4,339 4,164 4,605<br />
Equity Share in Affiliates<br />
TCO 230 222 239 227 214<br />
Hamaca (Petropiar effective January 2008) 13 11 8 3 3<br />
Petroboscan * 6 1 – – –<br />
Petroindependiente * 16 5 – – –<br />
Total Worldwide 6,082 5,883 4,586 4,394 4,822<br />
* Joint stock company formed in October 2006.<br />
<strong>Chevron</strong> Corporation <strong>2007</strong> <strong>Supplement</strong> to the <strong>Annual</strong> <strong>Report</strong>


