Chevron 2007 Annual Report Supplement
Chevron 2007 Annual Report Supplement
Chevron 2007 Annual Report Supplement
You also want an ePaper? Increase the reach of your titles
YUMPU automatically turns print PDFs into web optimized ePapers that Google loves.
�������������������<br />
���������<br />
�������������������<br />
����<br />
����<br />
���<br />
���<br />
���<br />
���<br />
�������������<br />
�������������<br />
Financial Information<br />
�����<br />
�� �� �� �� ��<br />
���������������������������������<br />
���������������������������������<br />
����������������<br />
���������������������<br />
���������<br />
�������������������<br />
���<br />
���<br />
���<br />
���<br />
���<br />
���<br />
���<br />
���<br />
���<br />
���<br />
�������������<br />
�������������<br />
����<br />
�� �� �� �� ��<br />
�����������������������������<br />
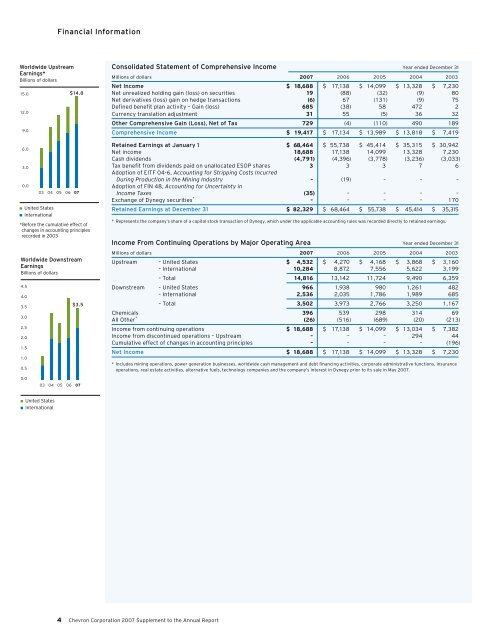
Consolidated Statement of Comprehensive Income Year ended December 31<br />
Millions of dollars 007 2006 2005 2004 2003<br />
Net Income $ 18,688 $ 17,138 $ 14,099 $ 13,328 $ 7,230<br />
Net unrealized holding gain (loss) on securities 19 (88) (32) (9) 80<br />
Net derivatives (loss) gain on hedge transactions (6) 67 (131) (9) 75<br />
Defined benefit plan activity – Gain (loss) 685 (38) 58 472 2<br />
Currency translation adjustment 31 55 (5) 36 32<br />
Other Comprehensive Gain (Loss), Net of Tax 729 (4) (110) 490 189<br />
Comprehensive Income $ 19,417 $ 17,134 $ 13,989 $ 13,818 $ 7,419<br />
Retained Earnings at January 1 $ 68,464 $ 55,738 $ 45,414 $ 35,315 $ 30,942<br />
Net income 18,688 17,138 14,099 13,328 7,230<br />
Cash dividends (4,791) (4,396) (3,778) (3,236) (3,033)<br />
Tax benefit from dividends paid on unallocated ESOP shares 3 3 3 7 6<br />
Adoption of EITF 04-6, Accounting for Stripping Costs Incurred<br />
During Production in the Mining Industry – (19) – – –<br />
Adoption of FIN 48, Accounting for Uncertainty in<br />
Income Taxes (35) – – – –<br />
Exchange of Dynegy securities * – – – – 170<br />
Retained Earnings at December 31 $ 82,329 $ 68,464 $ 55,738 $ 45,414 $ 35,315<br />
* Represents the company’s share of a capital stock transaction of Dynegy, which under the applicable accounting rules was recorded directly to retained earnings.<br />
Income From Continuing Operations by Major Operating Area Year ended December 31<br />
Millions of dollars 007 2006 2005 2004 2003<br />
Upstream – United States $ 4,532 $ 4,270 $ 4,168 $ 3,868 $ 3,160<br />
– International 10,284 8,872 7,556 5,622 3,199<br />
<strong>Chevron</strong> Corporation <strong>2007</strong> <strong>Supplement</strong> to the <strong>Annual</strong> <strong>Report</strong><br />
– Total 14,816 13,142 11,724 9,490 6,359<br />
Downstream – United States 966 1,938 980 1,261 482<br />
– International 2,536 2,035 1,786 1,989 685<br />
– Total 3,502 3,973 2,766 3,250 1,167<br />
Chemicals 396 539 298 314 69<br />
All Other * (26) (516) (689) (20) (213)<br />
Income from continuing operations $ 18,688 $ 17,138 $ 14,099 $ 13,034 $ 7,382<br />
Income from discontinued operations – Upstream – – – 294 44<br />
Cumulative effect of changes in accounting principles – – – – (196)<br />
Net Income $ 18,688 $ 17,138 $ 14,099 $ 13,328 $ 7,230<br />
* Includes mining operations, power generation businesses, worldwide cash management and debt financing activities, corporate administrative functions, insurance<br />
operations, real estate activities, alternative fuels, technology companies and the company’s interest in Dynegy prior to its sale in May <strong>2007</strong>.


