Chevron 2007 Annual Report Supplement
Chevron 2007 Annual Report Supplement
Chevron 2007 Annual Report Supplement
You also want an ePaper? Increase the reach of your titles
YUMPU automatically turns print PDFs into web optimized ePapers that Google loves.
���������������������<br />
�����������������<br />
����<br />
����<br />
����<br />
����<br />
����<br />
����<br />
Financial Information<br />
�����<br />
�� �� �� �� ��<br />
��������������������������<br />
�������<br />
��<br />
��<br />
��<br />
��<br />
�<br />
�<br />
����<br />
�� �� �� �� ��<br />
�������������������<br />
����������������������<br />
���������������������������<br />
�����<br />
����<br />
����<br />
����<br />
����<br />
���<br />
�����<br />
�� �� �� �� ��<br />
�����������������<br />
���������������������������������<br />
��������������������<br />
��<br />
��<br />
��<br />
��<br />
��<br />
�<br />
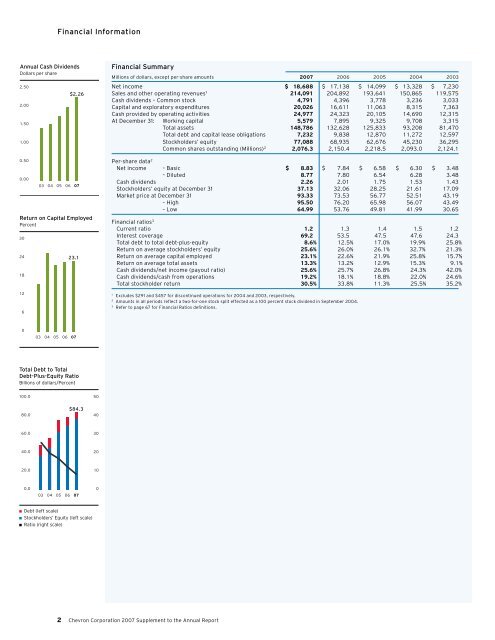
Financial Summary<br />
Millions of dollars, except per-share amounts 007 2006 2005 2004 2003<br />
Net income $ 18,688 $ 17,138 $ 14,099 $ 13,328 $ 7,230<br />
Sales and other operating revenues 1 214,091 204,892 193,641 150,865 119,575<br />
Cash dividends – Common stock 4,791 4,396 3,778 3,236 3,033<br />
Capital and exploratory expenditures 20,026 16,611 11,063 8,315 7,363<br />
Cash provided by operating activities 24,977 24,323 20,105 14,690 12,315<br />
At December 31: Working capital 5,579 7,895 9,325 9,708 3,315<br />
Total assets 148,786 132,628 125,833 93,208 81,470<br />
Total debt and capital lease obligations 7,232 9,838 12,870 11,272 12,597<br />
Stockholders’ equity 77,088 68,935 62,676 45,230 36,295<br />
Common shares outstanding (Millions) 2 2,076.3 2,150.4 2,218.5 2,093.0 2,124.1<br />
Per-share data 2<br />
Net income – Basic $ 8.83 $ 7.84 $ 6.58 $ 6.30 $ 3.48<br />
– Diluted 8.77 7.80 6.54 6.28 3.48<br />
Cash dividends 2.26 2.01 1.75 1.53 1.43<br />
Stockholders’ equity at December 31 37.13 32.06 28.25 21.61 17.09<br />
Market price at December 31 93.33 73.53 56.77 52.51 43.19<br />
– High 95.50 76.20 65.98 56.07 43.49<br />
– Low 64.99 53.76 49.81 41.99 30.65<br />
Financial ratios 3<br />
Current ratio 1.2 1.3 1.4 1.5 1.2<br />
Interest coverage 69.2 53.5 47.5 47.6 24.3<br />
Total debt to total debt-plus-equity 8.6% 12.5% 17.0% 19.9% 25.8%<br />
Return on average stockholders’ equity 25.6% 26.0% 26.1% 32.7% 21.3%<br />
Return on average capital employed 23.1% 22.6% 21.9% 25.8% 15.7%<br />
Return on average total assets 13.3% 13.2% 12.9% 15.3% 9.1%<br />
Cash dividends/net income (payout ratio) 25.6% 25.7% 26.8% 24.3% 42.0%<br />
Cash dividends/cash from operations 19.2% 18.1% 18.8% 22.0% 24.6%<br />
Total stockholder return 30.5% 33.8% 11.3% 25.5% 35.2%<br />
1 Excludes $291 and $457 for discontinued operations for 2004 and 2003, respectively.<br />
2 Amounts in all periods reflect a two-for-one stock split effected as a 100 percent stock dividend in September 2004.<br />
3 Refer to page 67 for Financial Ratios definitions.<br />
<strong>Chevron</strong> Corporation <strong>2007</strong> <strong>Supplement</strong> to the <strong>Annual</strong> <strong>Report</strong>


