Chevron 2007 Annual Report Supplement
Chevron 2007 Annual Report Supplement
Chevron 2007 Annual Report Supplement
Create successful ePaper yourself
Turn your PDF publications into a flip-book with our unique Google optimized e-Paper software.
Financial Information<br />
�������������������������������<br />
����������������������<br />
������������������������<br />
�������������������<br />
����<br />
����<br />
����<br />
����<br />
���<br />
���<br />
�����<br />
�� �� �� �� ��<br />
�����<br />
���������<br />
��������������������<br />
������������������������������<br />
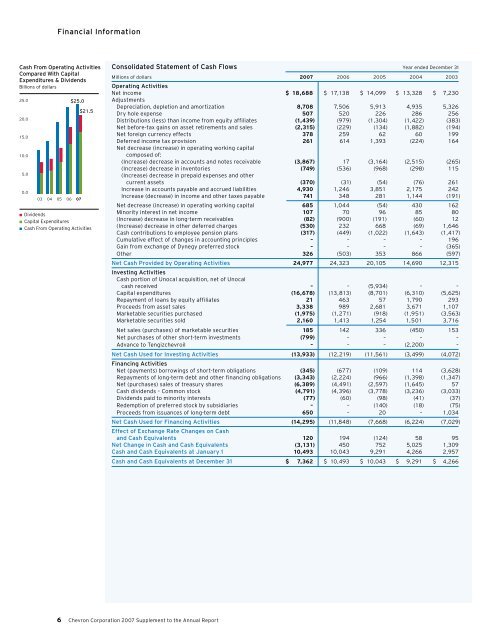
Consolidated Statement of Cash Flows Year ended December 31<br />
Millions of dollars <strong>2007</strong> 2006 2005 2004 2003<br />
Operating Activities<br />
Net income $ 18,688 $ 17,138 $ 14,099 $ 13,328 $ 7,230<br />
Adjustments<br />
Depreciation, depletion and amortization 8,708 7,506 5,913 4,935 5,326<br />
Dry hole expense 507 520 226 286 256<br />
Distributions (less) than income from equity affiliates (1,439) (979) (1,304) (1,422) (383)<br />
Net before-tax gains on asset retirements and sales (2,315) (229) (134) (1,882) (194)<br />
Net foreign currency effects 378 259 62 60 199<br />
Deferred income tax provision 261 614 1,393 (224) 164<br />
Net decrease (increase) in operating working capital<br />
composed of:<br />
(Increase) decrease in accounts and notes receivable (3,867) 17 (3,164) (2,515) (265)<br />
(Increase) decrease in inventories (749) (536) (968) (298) 115<br />
(Increase) decrease in prepaid expenses and other<br />
current assets (370) (31) (54) (76) 261<br />
Increase in accounts payable and accrued liabilities 4,930 1,246 3,851 2,175 242<br />
Increase (decrease) in income and other taxes payable 741 348 281 1,144 (191)<br />
Net decrease (increase) in operating working capital 685 1,044 (54) 430 162<br />
Minority interest in net income 107 70 96 85 80<br />
(Increase) decrease in long-term receivables (82) (900) (191) (60) 12<br />
(Increase) decrease in other deferred charges (530) 232 668 (69) 1,646<br />
Cash contributions to employee pension plans (317) (449) (1,022) (1,643) (1,417)<br />
Cumulative effect of changes in accounting principles – – – – 196<br />
Gain from exchange of Dynegy preferred stock – – – – (365)<br />
Other 326 (503) 353 866 (597)<br />
Net Cash Provided by Operating Activities 24,977 24,323 20,105 14,690 12,315<br />
Investing Activities<br />
Cash portion of Unocal acquisition, net of Unocal<br />
cash received – – (5,934) – –<br />
Capital expenditures (16,678) (13,813) (8,701) (6,310) (5,625)<br />
Repayment of loans by equity affiliates 21 463 57 1,790 293<br />
Proceeds from asset sales 3,338 989 2,681 3,671 1,107<br />
Marketable securities purchased (1,975) (1,271) (918) (1,951) (3,563)<br />
Marketable securities sold 2,160 1,413 1,254 1,501 3,716<br />
Net sales (purchases) of marketable securities 185 142 336 (450) 153<br />
Net purchases of other short-term investments (799) – – – –<br />
Advance to Tengizchevroil – – – (2,200) –<br />
Net Cash Used for Investing Activities (13,933) (12,219) (11,561) (3,499) (4,072)<br />
Financing Activities<br />
Net (payments) borrowings of short-term obligations (345) (677) (109) 114 (3,628)<br />
Repayments of long-term debt and other financing obligations (3,343) (2,224) (966) (1,398) (1,347)<br />
Net (purchases) sales of treasury shares (6,389) (4,491) (2,597) (1,645) 57<br />
Cash dividends – Common stock (4,791) (4,396) (3,778) (3,236) (3,033)<br />
Dividends paid to minority interests (77) (60) (98) (41) (37)<br />
Redemption of preferred stock by subsidiaries – – (140) (18) (75)<br />
Proceeds from issuances of long-term debt 650 – 20 – 1,034<br />
Net Cash Used for Financing Activities (14,295) (11,848) (7,668) (6,224) (7,029)<br />
Effect of Exchange Rate Changes on Cash<br />
and Cash Equivalents 120 194 (124) 58 95<br />
Net Change in Cash and Cash Equivalents (3,131) 450 752 5,025 1,309<br />
Cash and Cash Equivalents at January 1 10,493 10,043 9,291 4,266 2,957<br />
Cash and Cash Equivalents at December 31 $ 7,362 $ 10,493 $ 10,043 $ 9,291 $ 4,266<br />
<strong>Chevron</strong> Corporation <strong>2007</strong> <strong>Supplement</strong> to the <strong>Annual</strong> <strong>Report</strong>


