IUCN Red List Guidelines - The IUCN Red List of Threatened Species
IUCN Red List Guidelines - The IUCN Red List of Threatened Species
IUCN Red List Guidelines - The IUCN Red List of Threatened Species

Create successful ePaper yourself
Turn your PDF publications into a flip-book with our unique Google optimized e-Paper software.
<strong>Red</strong> <strong>List</strong> <strong>Guidelines</strong> 40<br />
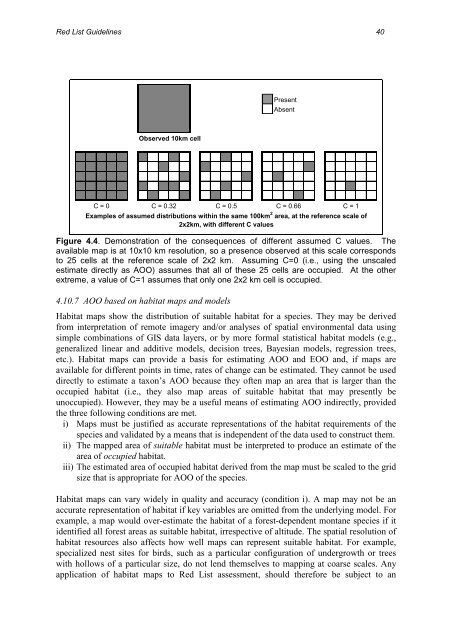
Observed 10km cell<br />
Present<br />
Absent<br />
C = 0 C = 0.32 C = 0.5 C = 0.66 C = 1<br />
Examples <strong>of</strong> assumed distributions within the same 100km 2 area, at the reference scale <strong>of</strong><br />
2x2km, with different C values<br />
Figure 4.4. Demonstration <strong>of</strong> the consequences <strong>of</strong> different assumed C values. <strong>The</strong><br />
available map is at 10x10 km resolution, so a presence observed at this scale corresponds<br />
to 25 cells at the reference scale <strong>of</strong> 2x2 km. Assuming C=0 (i.e., using the unscaled<br />
estimate directly as AOO) assumes that all <strong>of</strong> these 25 cells are occupied. At the other<br />
extreme, a value <strong>of</strong> C=1 assumes that only one 2x2 km cell is occupied.<br />
4.10.7 AOO based on habitat maps and models<br />
Habitat maps show the distribution <strong>of</strong> suitable habitat for a species. <strong>The</strong>y may be derived<br />
from interpretation <strong>of</strong> remote imagery and/or analyses <strong>of</strong> spatial environmental data using<br />
simple combinations <strong>of</strong> GIS data layers, or by more formal statistical habitat models (e.g.,<br />
generalized linear and additive models, decision trees, Bayesian models, regression trees,<br />
etc.). Habitat maps can provide a basis for estimating AOO and EOO and, if maps are<br />
available for different points in time, rates <strong>of</strong> change can be estimated. <strong>The</strong>y cannot be used<br />
directly to estimate a taxon’s AOO because they <strong>of</strong>ten map an area that is larger than the<br />
occupied habitat (i.e., they also map areas <strong>of</strong> suitable habitat that may presently be<br />
unoccupied). However, they may be a useful means <strong>of</strong> estimating AOO indirectly, provided<br />
the three following conditions are met.<br />
i) Maps must be justified as accurate representations <strong>of</strong> the habitat requirements <strong>of</strong> the<br />
species and validated by a means that is independent <strong>of</strong> the data used to construct them.<br />
ii) <strong>The</strong> mapped area <strong>of</strong> suitable habitat must be interpreted to produce an estimate <strong>of</strong> the<br />
area <strong>of</strong> occupied habitat.<br />
iii) <strong>The</strong> estimated area <strong>of</strong> occupied habitat derived from the map must be scaled to the grid<br />
size that is appropriate for AOO <strong>of</strong> the species.<br />
Habitat maps can vary widely in quality and accuracy (condition i). A map may not be an<br />
accurate representation <strong>of</strong> habitat if key variables are omitted from the underlying model. For<br />
example, a map would over-estimate the habitat <strong>of</strong> a forest-dependent montane species if it<br />
identified all forest areas as suitable habitat, irrespective <strong>of</strong> altitude. <strong>The</strong> spatial resolution <strong>of</strong><br />
habitat resources also affects how well maps can represent suitable habitat. For example,<br />
specialized nest sites for birds, such as a particular configuration <strong>of</strong> undergrowth or trees<br />
with hollows <strong>of</strong> a particular size, do not lend themselves to mapping at coarse scales. Any<br />
application <strong>of</strong> habitat maps to <strong>Red</strong> <strong>List</strong> assessment, should therefore be subject to an