IUCN Red List Guidelines - The IUCN Red List of Threatened Species
IUCN Red List Guidelines - The IUCN Red List of Threatened Species
IUCN Red List Guidelines - The IUCN Red List of Threatened Species

You also want an ePaper? Increase the reach of your titles
YUMPU automatically turns print PDFs into web optimized ePapers that Google loves.
<strong>Red</strong> <strong>List</strong> <strong>Guidelines</strong> 50<br />
necessary to make a projection from the most recent estimate (in 1995) to 2001. If the<br />
estimated decline from 10000 to 7000 occurred in 20 years, then assuming a constant rate <strong>of</strong><br />
decline during this period, annual rate <strong>of</strong> decline can be calculated as 1.77% [1-<br />
(7000/10000) (1/20) ], giving a projected decline <strong>of</strong> about 10.1% in the six years from the last<br />
census (in 1995) to 2001, and a projected 2001 population <strong>of</strong> 6290<br />
(=7000*(7000/10000) (6/20)<br />
). This means a three-generation decline <strong>of</strong> 37% (10000 to 6290).<br />
When there is no evidence that the rate <strong>of</strong> decline is changing, exponential decline can be<br />
assumed. For example, for the “Indian Ocean” subpopulation, the 20-year reduction from<br />
1961 to 1981 is 60% per generation; corresponding to 4.48% per year [-<br />
0.0448=(4,000/10,000) (1/20) -1]. Thus, three-generation decline can be estimated as 93.6% [-<br />
0.936=(4,000/10,000) (60/20) -1]. Another way to calculate the three-generation decline is<br />
based on annual rate <strong>of</strong> change, which is 0.9552 (1-4.48%). Thus, 60-year population<br />
change is 0.9552 60<br />
=0.064; i.e., only 6.4% <strong>of</strong> the population will remain after 60 years, which<br />
is a 93.6% decline]. <strong>The</strong> population size three generations ago can thus be estimated as<br />
25000 [=10000/(1-0.6)], and the current population as 1600 [=4000*(4000/10000)].<br />
It is important to note that the assumption <strong>of</strong> the pattern <strong>of</strong> decline can make an important<br />
difference to the estimated reduction, and that exponential decline is not the only possible<br />
assumption. See the discussion in the next subsection (Dealing with uncertainty).<br />
<strong>The</strong> “Atlantic” subpopulation has been stable, so a reduction <strong>of</strong> 0% is assumed. Combining<br />
the three estimates, the weighted average <strong>of</strong> reduction for the taxon is estimated as 63%<br />
[(-0.37*10+0*8-0.936*25)/43].<br />
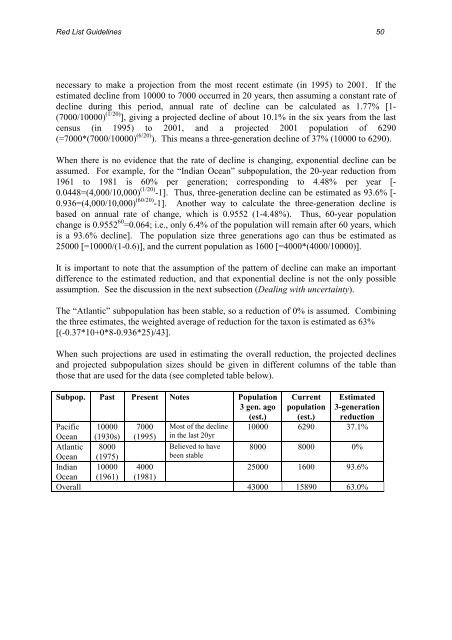
When such projections are used in estimating the overall reduction, the projected declines<br />
and projected subpopulation sizes should be given in different columns <strong>of</strong> the table than<br />
those that are used for the data (see completed table below).<br />
Subpop. Past Present Notes Population Current Estimated<br />
3 gen. ago population 3-generation<br />
(est.) (est.) reduction<br />
Pacific 10000 7000 Most <strong>of</strong> the decline 10000 6290 37.1%<br />
Ocean (1930s) (1995) in the last 20yr<br />
Atlantic 8000<br />
Believed to have 8000 8000 0%<br />
Ocean (1975)<br />
been stable<br />
Indian 10000 4000<br />
25000 1600 93.6%<br />
Ocean (1961) (1981)<br />
Overall 43000 15890 63.0%