Dominant-Negative Effects of a Novel Mutated Ins2 Allele Causes ...
Dominant-Negative Effects of a Novel Mutated Ins2 Allele Causes ...
Dominant-Negative Effects of a Novel Mutated Ins2 Allele Causes ...

Create successful ePaper yourself
Turn your PDF publications into a flip-book with our unique Google optimized e-Paper software.
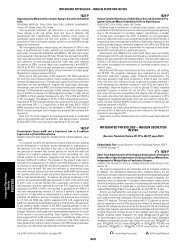
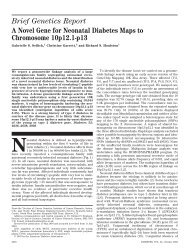
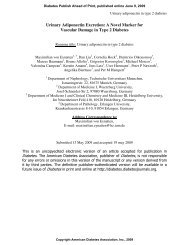
FIG. 1. Sequence <strong>of</strong> the <strong>Ins2</strong> gene <strong>of</strong> a wild-type (A) and a Munich<br />
<strong>Ins2</strong> C95S mutant (B) mouse. The point mutation at nucleotide position<br />
1903 is marked with an arrow.<br />
using the primer pairs <strong>Ins2</strong>_1se and <strong>Ins2</strong>_1as, <strong>Ins2</strong>_2se (nt 103–123) and<br />
<strong>Ins2</strong>_2as (nt 12831–264), and <strong>Ins2</strong>_3se (nt 18451–864) and <strong>Ins2</strong>_3as (nt<br />
23732–354). The sequences were aligned to the mouse preproinsulin gene II<br />
(GenBank accession no. X04724). For the allelic differentiation <strong>of</strong> <strong>Ins2</strong>,<br />
mutant animals were identified using a restriction fragment–length polymorphism–based<br />
strategy. The primers <strong>Ins2</strong>_3se and <strong>Ins2</strong>_3as resulted in 529-bp<br />
PCR products, which were restricted by the enzyme Hpy 188I (New England<br />
Biolabs, Frankfurt, Germany).<br />
Body weights. The fasting body weight <strong>of</strong> 1-, 3-, and 6-month-old heterozygous<br />
mutant and wild-type mice was determined to the nearest 0.1 g. The body<br />
weight <strong>of</strong> randomly fed homozygous mutant and wild-type mice was determined<br />
at 4 weeks <strong>of</strong> age.<br />
Glucose and insulin analyses. For phenotyping <strong>of</strong> N2 progeny, blood<br />
glucose <strong>of</strong> randomly fed animals was measured at 4 and 8 weeks <strong>of</strong> age, using<br />
the Super GLeasy system (Dr. Müller Gerätebau, Freital, Germany). Blood<br />
glucose <strong>of</strong> heterozygous mutant and wild-type animals on C3H genetic<br />
background was determined at 3 weeks <strong>of</strong> age in randomly fed mice (10:00<br />
A.M.) and at 1 and 3 months <strong>of</strong> age after 1.5 h refeeding, following a 15-h fasting<br />
period (7:00 P.M. to 10:00 A.M.). Blood glucose <strong>of</strong> homozygous mutant and<br />
wild-type mice was determined in randomly fed animals at 3 weeks <strong>of</strong> age.<br />
Oral glucose tolerance tests (OGTTs) were performed after a 15-h fasting<br />
period (7:00 P.M. to 10:00 A.M.) at 1, 3, and 6 months <strong>of</strong> age. Via gavage tube,<br />
11.1 �l 1 mol/l glucose solution was administered per gram <strong>of</strong> body weight.<br />
Blood glucose concentrations were determined at the indicated time points.<br />
Serum insulin concentration was measured in fasted mice, 10 min after<br />
glucose challenge, and after 1.5-h refeeding at 1, 3, and 6 months <strong>of</strong> age as<br />
previously described (5).<br />
The homeostasis model assessment (HOMA) <strong>of</strong> �-cell function index and<br />
HOMA <strong>of</strong> insulin resistance index was calculated as described previously (6).<br />
Insulin tolerance tests were performed in 4-month-old male animals.<br />
Insulin (1 unit/kg body wt) (Huminsulin; Lilly, Giessen, Germany) was<br />
administered intraperitoneally, and blood glucose levels were measured at the<br />
indicated time points.<br />
Pancreatic insulin content <strong>of</strong> 3- and 6-month-old heterozygous mutant and<br />
wild-type mice was determined as described (7). Protein content was determined<br />
photometrically; insulin concentration was analyzed by radioimmunoassay<br />
(Linco Research).<br />
Pancreas preparation and morphometric analysis. The morphologic<br />
changes <strong>of</strong> the endocrine pancreas <strong>of</strong> 6-month-old heterozygous Munich<br />
<strong>Ins2</strong> C95S mutant mice were quantitatively evaluated using unbiased modelindependent<br />
stereological methods (8,9) as described (5). Briefly, the volume<br />
density <strong>of</strong> islets in the pancreas [Vv (Islet/Pan)] was calculated dividing the sum<br />
N. HERBACH AND ASSOCIATES<br />
<strong>of</strong> cross-sectional areas (�A) <strong>of</strong> islets by �A pancreas. The total islet volume<br />
[V (Islet, Pan)] was calculated by multiplying Vv (Islet/Pan) and V (Pan). Volume<br />
densities <strong>of</strong> different endocrine cells in the islets [Vv (X-cells/Islet)] were determined<br />
by dividing �A <strong>of</strong> �-, �-, and pancreatic polypeptide (PP)-cells,<br />
respectively, by �A islets. The total volume <strong>of</strong> endocrine cells [V (X-cells, Islet)]<br />
was obtained by multiplying Vv (X-cells/Islet) and V (Islet, Pan). �-Cells <strong>of</strong> mutant<br />
mice weakly stained positive for insulin due to severe degranulation; hence,<br />
measurement <strong>of</strong> �A �-cells led to an underestimation <strong>of</strong> Vv (B-cells/Islet) and<br />
V (B-cells, Islet). Therefore, V (B-cells, Islet) was calculated by subtracting V (Non–B-cells, Islet)<br />
from V (Islet, Pan). Then, Vv (B-cells/Islet) was calculated by dividing V (B-cells, Islet) by<br />
V (Islet, Pan).<br />
Immunohistochemistry. The indirect immunoperoxidase method was used<br />
to determine insulin-, glucagon-, somatostatin-, and PP-containing cells as<br />
previously described (5). Horseradish-conjugated rabbit anti–guinea pig IgG<br />
and pig anti-rabbit IgG were from Dako Diagnostika (Hamburg, Germany).<br />
Electron microscopy. Pancreas samples were fixed in 6.25% glutaraldehyde<br />
in Sorensen’s phosphate buffer (pH 7.4) for 24 h. Six to eight 1-mm 3 samples<br />
were postfixed in 1% osmium tetroxid and routinely embedded in Epon.<br />
Ultrathin sections (70–80 nm) were stained with uranyl citrate and lead<br />
citrate and examined with an EM10 transmission electron microscope (Zeiss,<br />
Oberkochen, Germany).<br />
Data presentation and statistical analysis. Data are presented as means �<br />
SE or SD as indicated. The general linear models procedure was used in order<br />
to calculate least-squares means; comparison <strong>of</strong> the least-squares means <strong>of</strong><br />
different groups was performed using the Student’s t test (SAS release 8.2; SAS<br />
Institute, Heidelberg, Germany). P values �0.05 were considered significant.<br />
RESULTS<br />
Establishment <strong>of</strong> the hyperglycemic line. In the screen<br />
for dominant mutations <strong>of</strong> the Munich ENU mouse mutagenesis<br />
project, a male G 1 <strong>of</strong>fspring (no. 20016135) <strong>of</strong> an<br />
ENU-treated C3H mouse showed hyperglycemia (276 and<br />
335 mg/dl, respectively) in two subsequent examinations<br />
at 12 and 15 weeks <strong>of</strong> age. Mating <strong>of</strong> the hyperglycemic G 1<br />
mouse to a wild-type C3H female resulted in the inheritance<br />
<strong>of</strong> the abnormal phenotype to the G 2 <strong>of</strong>fspring,<br />
which revealed an autosomal dominant mutation as cause<br />
for the aberrant phenotype. Subsequently, a mutant line<br />
(GLS004) was established by breeding heterozygous mutants<br />
to wild-type mice <strong>of</strong> the C3H genetic background for<br />
�10 generations.<br />
Linkage analysis and candidate gene examination <strong>of</strong><br />
<strong>Ins2</strong>. The genome-wide linkage analysis revealed a strong<br />
linkage (� 2 � 76.6; P � 0.0001) <strong>of</strong> the mutation to a defined<br />
single chromosomal site on chromosome 7, represented<br />
by the marker rs13479566 at 136.88 Mb (mouse genome<br />
build 35.1).<br />
The sequence analysis <strong>of</strong> the positional candidate gene<br />
<strong>Ins2</strong> consistently revealed a T3A transversion at nucleotide<br />
position 1903 in exon 3 (GenBank accession no.<br />
X04724) (Fig. 1). The mutation leads to an amino acid<br />
exchange from cysteine to serine at position 95, corresponding<br />
to amino acid 6 on the A chain (A6), which forms<br />
the intrachain disulfide bond with cysteine100 (A11). The<br />
replacement <strong>of</strong> C95 therefore leads to the loss <strong>of</strong> the<br />
A6-A11 intrachain disulfide bond. According to the mutation,<br />
the diabetic strain was named Munich <strong>Ins2</strong> C95S .<br />
The missense mutation found in exon 3 <strong>of</strong> <strong>Ins2</strong> creates<br />
a new Hpy 188I restriction site that was used for the allelic<br />
differentiation <strong>of</strong> <strong>Ins2</strong>. Digested 529-bp PCR amplificates<br />
<strong>of</strong> wild-type mice showed a 521-bp fragment, heterozygous<br />
Munich <strong>Ins2</strong> C95S mutant mice showed both the 473- and<br />
521-bp fragment (Fig. 2), and homozygous mutants demonstrated<br />
the 473-bp fragment (data not shown).<br />
Phenotyping <strong>of</strong> N2 progeny. Animals showing glucosuria<br />
or exhibiting blood glucose levels �160 mg/dl for<br />
females and 190 mg/dl for males were considered diabetic.<br />
A total <strong>of</strong> 290 N2 progeny (146 males and 144 females)<br />
were investigated. Forty-eight percent <strong>of</strong> the male and 41%<br />
DIABETES, VOL. 56, MAY 2007 1269