
You also want an ePaper? Increase the reach of your titles
YUMPU automatically turns print PDFs into web optimized ePapers that Google loves.
68<br />
ANNUAL REPORT <strong>2008</strong><br />
Notes to the consolidated financial statements<br />
<strong>2008</strong> Financial Year<br />
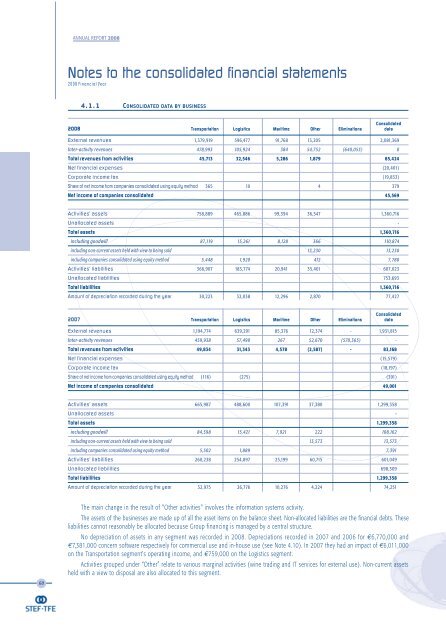
4.1.1 CONSOLIDATED DATA BY BUSINESS<br />
Consolidated<br />
<strong>2008</strong> Transportation Logistics Maritime Other Eliminations data<br />
External revenues 1,379,919 596,477 91,768 13,205 2,081,369<br />
Inter-activity revenues 478,993 105,924 384 54,752 (640,053) 0<br />
Total revenues from activities 45,713 32,546 5,286 1,879 85,424<br />
Net financial expenses (20,401)<br />
Corporate income tax (19,833)<br />
Share of net income from companies consolidated using equity method 365 10 4 379<br />
Net income of companies consolidated 45,569<br />
Activities' assets 758,889 465,886 99,394 36,547 1,360,716<br />
Unallocated assets -<br />
Total assets 1,360,716<br />
including goodwill 87,119 15,261 8,128 366 110,874<br />
including non-current assets held with view to being sold 13,230 13,230<br />
including companies consolidated using equity method 5,448 1,920 412 7,780<br />
Activities' liabilities 366,907 183,774 20,941 35,401 607,023<br />
Unallocated liabilities 753,693<br />
Total liabilities 1,360,716<br />
Amount of depreciation recorded during the year 30,223 32,038 12,296 2,870 77,427<br />
Consolidated<br />
2007 Transportation Logistics Maritime Other Eliminations data<br />
External revenues 1,194,774 639,291 85,376 12,374 - 1,931,815<br />
Inter-activity revenues 459,938 57,490 267 52,670 (570,365) -<br />
Total revenues from activities 49,834 31,343 4,578 (2,587) - 83,168<br />
Net financial expenses (15,579)<br />
Corporate income tax (18,197)<br />
Share of net income from companies consolidated using equity method (116) (275) (391)<br />
Net income of companies consolidated 49,001<br />
Activities' assets 665,987 488,600 107,391 37,380 1,299,358<br />
Unallocated assets -<br />
Total assets 1,299,358<br />
including goodwill 84,598 15,421 7,921 222 108,162<br />
including non-current assets held with view to being sold 13,573 13,573<br />
including companies consolidated using equity method 5,502 1,889 7,391<br />
Activities' liabilities 260,238 254,897 25,199 60,715 601,049<br />
Unallocated liabilities 698,309<br />
Total liabilities 1,299,358<br />
Amount of depreciation recorded during the year 32,975 26,776 10,276 4,224 74,251<br />
The main change in the result of "Other activities" involves the information systems activity.<br />
The assets of the businesses are made up of all the asset items on the balance sheet. Non-allocated liabilities are the financial debts. These<br />
liabilities cannot reasonably be allocated because Group financing is managed by a central structure.<br />
No depreciation of assets in any segment was recorded in <strong>2008</strong>. Depreciations recorded in 2007 and 2006 for €6,770,000 and<br />
€7,381,000 concern software respectively for commercial use and in-house use (see Note 4.10). In 2007 they had an impact of €6,011,000<br />
on the Transportation segment's operating income, and €759,000 on the Logistics segment.<br />
Activities grouped under “Other” relate to various marginal activities (wine trading and IT services for external use). Non-current assets<br />
held with a view to disposal are also allocated to this segment.