

Wahleach Project Water Use Plan Lower Jones Creek ... - BC Hydro
Wahleach Project Water Use Plan Lower Jones Creek ... - BC Hydro
Wahleach Project Water Use Plan Lower Jones Creek ... - BC Hydro

You also want an ePaper? Increase the reach of your titles
YUMPU automatically turns print PDFs into web optimized ePapers that Google loves.
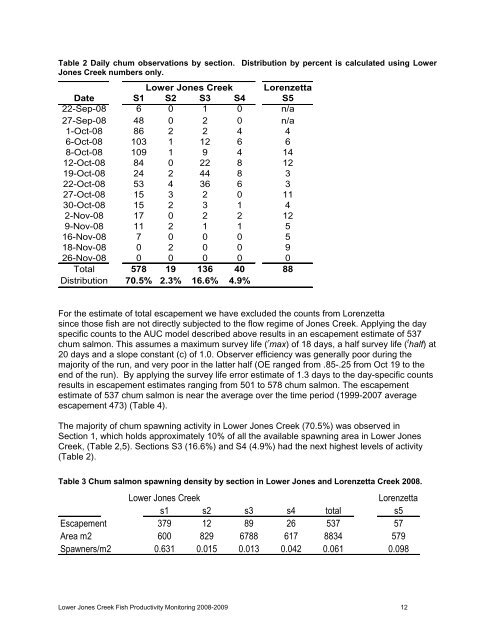
Table 2 Daily chum observations by section. Distribution by percent is calculated using <strong>Lower</strong><br />
<strong>Jones</strong> <strong>Creek</strong> numbers only.<br />
<strong>Lower</strong> <strong>Jones</strong> <strong>Creek</strong> Lorenzetta<br />
Date S1 S2 S3 S4 S5<br />
22-Sep-08 6 0 1 0 n/a<br />
27-Sep-08 48 0 2 0 n/a<br />
1-Oct-08 86 2 2 4 4<br />
6-Oct-08 103 1 12 6 6<br />
8-Oct-08 109 1 9 4 14<br />
12-Oct-08 84 0 22 8 12<br />
19-Oct-08 24 2 44 8 3<br />
22-Oct-08 53 4 36 6 3<br />
27-Oct-08 15 3 2 0 11<br />
30-Oct-08 15 2 3 1 4<br />
2-Nov-08 17 0 2 2 12<br />
9-Nov-08 11 2 1 1 5<br />
16-Nov-08 7 0 0 0 5<br />
18-Nov-08 0 2 0 0 9<br />
26-Nov-08 0 0 0 0 0<br />
Total 578 19 136 40 88<br />
Distribution 70.5% 2.3% 16.6% 4.9%<br />
For the estimate of total escapement we have excluded the counts from Lorenzetta<br />
since those fish are not directly subjected to the flow regime of <strong>Jones</strong> <strong>Creek</strong>. Applying the day<br />
specific counts to the AUC model described above results in an escapement estimate of 537<br />
chum salmon. This assumes a maximum survey life ( r max) of 18 days, a half survey life ( t half) at<br />
20 days and a slope constant (c) of 1.0. Observer efficiency was generally poor during the<br />
majority of the run, and very poor in the latter half (OE ranged from .85-.25 from Oct 19 to the<br />
end of the run). By applying the survey life error estimate of 1.3 days to the day-specific counts<br />
results in escapement estimates ranging from 501 to 578 chum salmon. The escapement<br />
estimate of 537 chum salmon is near the average over the time period (1999-2007 average<br />
escapement 473) (Table 4).<br />
The majority of chum spawning activity in <strong>Lower</strong> <strong>Jones</strong> <strong>Creek</strong> (70.5%) was observed in<br />
Section 1, which holds approximately 10% of all the available spawning area in <strong>Lower</strong> <strong>Jones</strong><br />
<strong>Creek</strong>, (Table 2,5). Sections S3 (16.6%) and S4 (4.9%) had the next highest levels of activity<br />
(Table 2).<br />
Table 3 Chum salmon spawning density by section in <strong>Lower</strong> <strong>Jones</strong> and Lorenzetta <strong>Creek</strong> 2008.<br />
<strong>Lower</strong> <strong>Jones</strong> <strong>Creek</strong> Lorenzetta<br />
s1 s2 s3 s4 total s5<br />
Escapement 379 12 89 26 537 57<br />
Area m2 600 829 6788 617 8834 579<br />
Spawners/m2 0.631 0.015 0.013 0.042 0.061 0.098<br />
<strong>Lower</strong> <strong>Jones</strong> <strong>Creek</strong> Fish Productivity Monitoring 2008-2009 12


