2010 RWISO Journal - Roth Williams International Society of ...
2010 RWISO Journal - Roth Williams International Society of ...
2010 RWISO Journal - Roth Williams International Society of ...

Create successful ePaper yourself
Turn your PDF publications into a flip-book with our unique Google optimized e-Paper software.
Measurements<br />
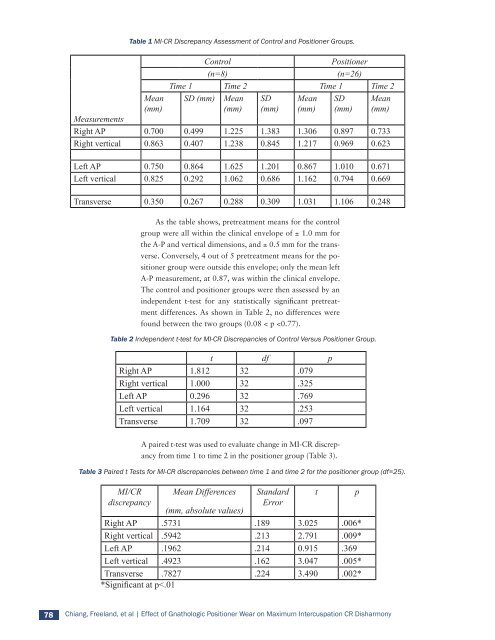
Table 1 MI-CR Discrepancy Assessment <strong>of</strong> Control and Positioner Groups.<br />
Mean<br />
(mm)<br />
Control Positioner<br />
(n=8) (n=26)<br />
Time 1 Time 2 Time 1 Time 2<br />
SD (mm) Mean<br />
(mm)<br />
SD<br />
(mm)<br />
Mean<br />
(mm)<br />
SD<br />
(mm)<br />
Table 2 Independent t-test for MI-CR Discrepancies <strong>of</strong> Control Versus Positioner Group.<br />
Mean<br />
(mm)<br />
Right AP 0.700 0.499 1.225 1.383 1.306 0.897 0.733<br />
Right vertical 0.863 0.407 1.238 0.845 1.217 0.969 0.623<br />
Left AP 0.750 0.864 1.625 1.201 0.867 1.010 0.671<br />
Left vertical 0.825 0.292 1.062 0.686 1.162 0.794 0.669<br />
Transverse 0.350 0.267 0.288 0.309 1.031 1.106 0.248<br />
As the table shows, pretreatment means for the control<br />
group were all within the clinical envelope <strong>of</strong> ± 1.0 mm for<br />
the A-P and vertical dimensions, and ± 0.5 mm for the transverse.<br />
Conversely, 4 out <strong>of</strong> 5 pretreatment means for the positioner<br />
group were outside this envelope; only the mean left<br />
A-P measurement, at 0.87, was within the clinical envelope.<br />
The control and positioner groups were then assessed by an<br />
independent t-test for any statistically significant pretreatment<br />
differences. As shown in Table 2, no differences were<br />
found between the two groups (0.08 < p