Quality, value, satisfaction, trust, a
Quality, value, satisfaction, trust, a
Quality, value, satisfaction, trust, a

You also want an ePaper? Increase the reach of your titles
YUMPU automatically turns print PDFs into web optimized ePapers that Google loves.
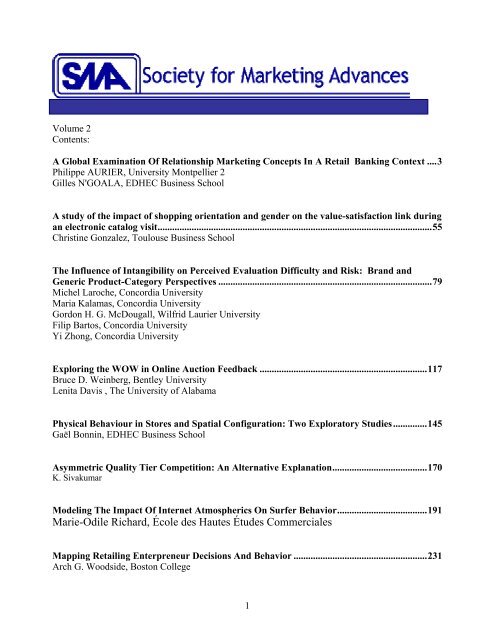
Volume 2<br />
Contents:<br />
A Global Examination Of Relationship Marketing Concepts In A Retail Banking Context ....3<br />
Philippe AURIER, University Montpellier 2<br />
Gilles N'GOALA, EDHEC Business School<br />
A study of the impact of shopping orientation and gender on the <strong>value</strong>-<strong>satisfaction</strong> link during<br />
an electronic catalog visit.................................................................................................................55<br />
Christine Gonzalez, Toulouse Business School<br />
The Influence of Intangibility on Perceived Evaluation<br />
Difficulty and Risk: Brand and<br />
Generic Product-Category Perspectives<br />
........................................................................................79<br />
Michel<br />
Laroche, Concordia University<br />
Maria<br />
Kalamas, Concordia University<br />
Gordon H. G. McDougall, Wilfrid Laurier University<br />
Filip Bartos, Concordia University<br />
Yi Zhong, Concordia University<br />
Exploring the WOW in Online Auction Feedback .....................................................................117<br />
Bruce D. Weinberg, Bentley University<br />
Lenita<br />
Davis , The University of Alabama<br />
Physical Behaviour<br />
in Stores and Spatial Configuration: Two Exploratory Studies..............145<br />
Gaël<br />
Bonnin, EDHEC Business School<br />
Asymmetric <strong>Quality</strong> Tier Competition: An Alternative Explanation. ......................................170<br />
K. Sivakumar<br />
Modeling The Impact Of Internet Atmospherics On Surfer Behavior.....................................191<br />
Marie-Odile Richard, École des Hautes Études Commerciales<br />
Mapping Retailing Enterpreneur Decisions<br />
And Behavior .......................................................231<br />
Arch G. Woodside, Boston College<br />
1
An Empirical Examination of Retail Convenience for In-Store and Online Shoppers...........251<br />
Nicole Ponder, Mississippi State University<br />
Michelle<br />
Bednarz, Mississippi State University<br />
What influences customer reaction to incompatibility? An empirical investigation...............281<br />
2
A Global Examination Of Relationship Marketing Concepts In A Retail Banking Context<br />
Philippe AURIER, University Montpellier 2<br />
Gilles N'GOALA, EDHEC Business School<br />
Abstract. This paper tests the validity and the causal structure of the main concepts developed in the<br />
relationship marketing literature, including perceived quality (technical and functional), <strong>value</strong>, <strong>satisfaction</strong>,<br />
<strong>trust</strong> and commitment to the brand. Working with two samples each consisting of 2,150 customers of a large<br />
bank, we first study the unidimensionality of these concepts and underline their high correlations. We then<br />
study their causal structure and show that our data are compatible with a "relational chain" structure with<br />
significant direct effects of both quality components (technical and functional) on <strong>value</strong>, and effects of <strong>value</strong><br />
on <strong>satisfaction</strong>, of <strong>satisfaction</strong> on <strong>trust</strong>, and finally, of <strong>trust</strong> on commitment. Indeed, all these links are<br />
positive, strong, and nearly equal in intensity (close to 0.5).<br />
Key Words. Relationship marketing, <strong>Quality</strong>, Value, Satisfaction, Trust, Commitment, Brand-Consumer<br />
Relationship, Service.<br />
3
INTRODUCTION<br />
In the course of the last twenty years or so, numerous studies focusing on commercial relations have<br />
demonstrated the importance of perceived quality, <strong>value</strong>, <strong>satisfaction</strong>, <strong>trust</strong>, and commitment in the formation<br />
of long-term customer relationships. Twenty years after the original article by Berry (1983), the conceptual<br />
framework of relationship marketing is now well established and can be easily applied to relationships<br />
between consumers and brands. Without claiming to provide an exhaustive summary, we might mention that<br />
the literature strongly emphasizes both consumer judgments of a product's perceived quality and <strong>value</strong> and<br />
consumer <strong>satisfaction</strong> in evaluating consumption experiences. Furthermore, the literature considers <strong>trust</strong> of,<br />
and commitment to, the brand as the main antecedents of loyalty (continuity/repurchase) and long-term<br />
cooperation. While no one disputes the theoretical utility of this research, there are nevertheless several<br />
questions that remain unresolved.<br />
First of all, different concepts that characterize the relationship to the brand have been developed separately:<br />
some of the studies focus on post-purchase processes, while others are centered on relationships of <strong>trust</strong> and<br />
long-term commitment. <strong>Quality</strong>, <strong>value</strong>, <strong>satisfaction</strong>, <strong>trust</strong>, and commitment have often been presented and<br />
measured individually, as separate features in the mind of the judging consumer; each concept is covered in a<br />
different body of literature. Yet, the many theoretical similarities between these concepts lead us to doubt<br />
their separate existence, or at least their discriminant validity. Taking into account the high correlations that<br />
must exist between these concepts, what then are their specific contributions to explaining consumer<br />
behavior? Furthermore, the causal structure of these concepts has not been approached in a overall fashion.<br />
While the links between quality and <strong>satisfaction</strong> and between <strong>trust</strong> and commitment have been studied<br />
extensively, to our knowledge no research has tested simultaneously the overall causal structure. Finally, at<br />
the empirical level, much of the research has been conducted on limited samples -- being either small or<br />
unscientifically constituted (using students or other convenient populations). As a result, the findings<br />
obtained from these studies lack both internal and external validity.<br />
This article tries to overcome these three limitations. Our goal is not to propose and validate a new theory of<br />
relationship marketing. We attempt instead to put the major concepts of relationship marketing in perspective<br />
4
and to measure them simultaneously using a random, heterogeneous sample of customers. After a brief<br />
review of the literature which will serve as a reminder of the concepts being examined (quality, <strong>value</strong>,<br />
<strong>satisfaction</strong>, <strong>trust</strong>, and commitment) and their assumed causal relations, we will study their trait validity, test<br />
a model of their causal structure, and then compare it to two alternative models emanating from the literature.<br />
We conducted our initial survey on a probabilistic sample of 2,150 customers of a large bank, matched with a<br />
similar sample (2,150 customers) taken from the same population and polled one year later.<br />
CONCEPTUAL FRAMEWORK<br />
With the advent of relationship marketing, the relationship between a consumer and an object (product,<br />
brand, logo, etc.) has become a popular topic of research. In the relationship marketing framework, the<br />
concept of "brand" is no longer limited to "extrinsic" features of a product, with which one associates<br />
different functional, emotional, or symbolic benefits. More broadly, a brand represents the anchor point of a<br />
lasting relationship that is built on past consumption experiences and those yet to come (Berry, 2000).<br />
Main Concepts Characterizing the Relationship to the Brand<br />
This brand – customer relationship is complex and cannot be summarized easily (Fournier, 1998).<br />
Nevertheless five concepts are frequently used in the relationship marketing literature: commitment, <strong>trust</strong>,<br />
<strong>satisfaction</strong>, perceived <strong>value</strong> and quality. They seem to be key concepts in cutomer-relationship<br />
understanding and they can hereafter be used to build a simplified and coherent model. Three of them<br />
(quality, <strong>value</strong>, and <strong>satisfaction</strong>) are rooted in evaluations of consumption experiences. These concepts can<br />
be considered from a transactional viewpoint (evaluation of a specific experience) or from a cumulative<br />
viewpoint (evaluation of the relationship). The other two concepts (<strong>trust</strong> and commitment), which represent<br />
more abstract judgments of the brand, are oriented toward the future and are reinforced or weakened by a<br />
succession of purchase and consumption experiences.<br />
Perceived quality: Perceived quality is generally considered the foundation of the relational process. It<br />
denotes "the consumer's judgment about a product’s overall excellence or superiority" (Zeithaml, 1988).<br />
Perceived quality is derived from the individual's evaluation of the intrinsic and extrinsic features of the<br />
object, based on initial expectations, in comparison with what competitors have to offer. In the service sector,<br />
perceived quality has been explored in several studies (Grönroos, 1983; Zeithaml, 1988; Parasuraman,<br />
5
Zeithaml and Berry, 1988; Zeithaml, Berry and Parasuraman, 1996; Brady and Cronin, 2001). Service,<br />
simultaneously produced, purchased and consumed, can be evaluated on the basis of the core service<br />
(technical quality) and of the interaction between the customer and the service personnel (functional quality)<br />
as Grönroos (1983) postulated. The concept of service also depends upon the interaction with the physical<br />
environment in which the service is provided (atmosphere, type of people who frequent the location), as<br />
Bitner (1990) showed.<br />
Perceived <strong>value</strong>: If perceived quality affects evaluation of benefits in comparison to offerings of competitors,<br />
these benefits must be considered in relation to the resources expended during the purchase-consumption<br />
cycle. The information search prior to purchase, the price paid, the time spent, and various efforts put forth<br />
during consumption, all constitute factors that reduce the <strong>value</strong> perceived by the consumer (Lai, 1995; Slater<br />
and Narver, 2000). Therefore, perceived <strong>value</strong> represents an appraisal of the exchange. In line with the<br />
approach developed in economics, consumer behavior is presented as a process of producing utility by<br />
applying monetary and temporal resources (Becker, 1976). Although other complementary sources of <strong>value</strong><br />
exist (Holbrook, 1999), a product's quality or excellence remains the fundamental basis for <strong>value</strong> creation in<br />
the exchange (Zeithaml, 1988).<br />
Satisfaction: For Oliver (1997, p. 144), <strong>satisfaction</strong> denotes evaluation of the results of a consumption<br />
experience based on a set of goals or standards, which translates into fulfillment, under-fulfillment, or over-<br />
fulfillment. While the concepts of perceived quality and perceived <strong>value</strong> remain closely linked to the<br />
evaluated object (good or service), <strong>satisfaction</strong> describes the consumer's cognitive and affective states<br />
resulting from the consumption experience (Boulding, Kalra, Staelin, and Zeithaml, 1993; Oliver, 1993;<br />
Iacobucci, Grayson, and Ostrom, 1994). Indeed, perceived quality involves comparing performance to that of<br />
competitors, <strong>value</strong> involves a comparison against accepted sacrifices, while <strong>satisfaction</strong> is based on<br />
confirmation of individual expectations (predictive or normative standards). Satisfaction is not limited to<br />
cognitive evaluation, it involves an abstract state that is both cognitive and affective and that characterizes<br />
the individual's personal experience with a product or brand (Fournier and Mick, 1999). Finally, unlike<br />
quality, <strong>satisfaction</strong> requires a concrete experience with a product. Taking a relational approach, Johnson,<br />
Anderson, and Fornell (1995) introduced cumulative <strong>satisfaction</strong>, an "abstract construct that describes<br />
6
customers’ total consumption experience with a product or service". Cumulative <strong>satisfaction</strong> allows one to<br />
grasp, at a given time, the updated picture of an individual's cumulative experiences to date, both satisfactory<br />
and unsatisfactory. Although other explanatory factors can be found within the relationship marketing<br />
framework, perceived quality and perceived <strong>value</strong> are the two principal conveyors of consumer <strong>satisfaction</strong><br />
(Johnson, Anderson, and Fornell, 1995).<br />
Trust: Consumer <strong>satisfaction</strong> acts as a risk reducer for future transactions. Each satisfactory experience<br />
generates <strong>trust</strong> and acts as a positive reinforcement. Thus, <strong>satisfaction</strong> enhances <strong>trust</strong>, i.e., the consumer's<br />
assumption that the brand, as a personified entity, promises to have a foreseeable performance that conforms<br />
to the consumer's expectations, and agrees to willingly maintain that standard over time. While <strong>satisfaction</strong><br />
results principally from an assessment of an earlier concrete instance of consumption, <strong>trust</strong> is more of a bet<br />
on the future of the relationship, thus integrating the notion of risk. Trust is founded on the anticipated<br />
capacity of the brand to regularly satisfy consumer expectations (reliability, credibility, general reputation)<br />
and in a more affective sphere, it goes back to the brand's will -- assumed but not proven -- to avoid doing<br />
anything that might be detrimental to it (and thus to enhance perceived benevolence, equity, integrity;<br />
Ganesan, 1994; Ganesan and Hess, 1997). Trust in a brand is principally oriented toward the future<br />
relationship and is strengthened by a succession of satisfactory consumption experiences. As such, <strong>trust</strong><br />
represents one of the main antecedents of long-term commitment to a brand.<br />
Commitment: Along with <strong>trust</strong>, commitment is a central concept in relationship marketing (Dwyer, Schurr,<br />
and Oh, 1987; Morgan and Hunt, 1994; Garbarino and Johnson, 1999). In marketing, Morgan and Hunt<br />
(1994) defined commitment to the relationship as "an exchange partner believing that an ongoing<br />
relationship with another is so important as to warrant maximum efforts at maintaining it; that is, the<br />
committed party believes the relationship is worth working on to ensure that it endures indefinitely".<br />
Research on commitment in marketing is based on older studies conducted in the area of human resources<br />
management. In particular, Mowday, Steers, and Porter (1979) defined commitment to the organization as<br />
the relative intensity of identification and involvement in a particular organization. Commitment here can be<br />
characterized by at least three factors: a strong belief and acceptance of the organization's goals and <strong>value</strong>s, a<br />
willingness to expend considerable efforts that will profit the organization, and a strong desire to remain a<br />
7
member of the organization. More recently, Meyer and Allen (1991) attempted to isolate the three<br />
fundamentals of organizational commitment: "(1) affective commitment refers to the employee's emotional<br />
attachment to, identification with, and involvement in the organization; (2) continuance commitment refers to<br />
an awareness of the costs associated with leaving the organization; (3) normative commitment reflects a<br />
feeling of obligation to continue employment". The authors based their work on the concepts proposed in<br />
Kelman's studies (1958) in social psychology: compliance (or exchange), identification, and internalization.<br />
This three components structure of commitment has been applied to marketing exchanges: continuance,<br />
affective and normative commitment (Gundlach, Achrol and Mentzer, 1995; Gruen, Summers and Acito,<br />
2000). Nevertheless most of conceptualizations and measures of commitment to the brand focus on the<br />
affective component in accordance with Mowday, Steers, and Porter approach (1979). In consumer behavior<br />
research, this affective or attitudinal commitment refers more to a true loyalty built on a positive evaluation<br />
of the brand than to a false loyalty based solely on social norms or switching costs (Dick and Basu, 1994;<br />
Oliver, 1997). In this way, commitment to the relationship is globally defined as an individual's desire to<br />
maintain a strong and lasting relationship with a given brand. It goes beyond the mere framework of a<br />
favorable opinion of the brand (attitude) and is directly related to loyalty behavior (Jacoby and Chestnut,<br />
1978). Commitment is reinforced in the course of successive consumption experiences (quality, <strong>value</strong>,<br />
<strong>satisfaction</strong>) and relies directly on <strong>trust</strong> in the brand (Morgan and Hunt, 1994; Garbarino and Johnson, 1999).<br />
The five concepts described above are thus based on different psychological processes related to cognitions<br />
(concrete / abstract), processes (evaluation / identification), and time frames (past / present / future). Each<br />
one contributes specific information to the brand - consumer relationship: quality pertains to evaluating the<br />
excellence or superiority of the product (goods and/or services) as compared to competitors; perceived <strong>value</strong><br />
includes the idea of the sacrifices made (time, effort, money) to buy and consume the product; consumer<br />
<strong>satisfaction</strong> is a global state derived from cumulative consumption experiences, and is both cognitive<br />
(evaluation) and affective (feelings); brand <strong>trust</strong> encompasses the idea of risk in all future exchanges, and<br />
refers in part to moral considerations (benevolence, integrity, keeping promises); consumer commitment in a<br />
lasting relationship with the brand is the result of an instrumental calculation (means-ends tradeoff), an<br />
identification (congruence of identities), and an internalization of social norms.<br />
8
From product perceived quality toward commitment to the brand<br />
In studies on the brand-consumer relationship, it is not always easy to establish and contrast the domain of<br />
the brand from that of the branded product. Nevertheless, the first two concepts (quality and <strong>value</strong> of the<br />
good or service) seem to be strongly rooted in perceptions of the product itself, whereas the last two (<strong>trust</strong><br />
and commitment to the brand) appear to clearly encompass the perception of the brand. On the continuum<br />
from product to brand, consumer <strong>satisfaction</strong> seems to be a point of equilibrium between the realities of the<br />
brand and those of the product. This general framework thus accounts for the weight of both the products and<br />
the brands in the development of long-term relationships. In our view, an overall understanding of the<br />
consumer's relationship to the brand cannot be achieved without analyzing concrete evaluations of products.<br />
While no general model has actually been proposed and tested, the relational literature implicitly articulates<br />
these concepts in terms of the following causal chain: perceived quality → perceived <strong>value</strong> → cumulative<br />
<strong>satisfaction</strong> → <strong>trust</strong> → commitment (Figure 1), which will hereafter be called the "relational chain". Each<br />
successive concept is fed by the judgments immediately "upstream" from it in the causal chain, and<br />
incorporates additional considerations: product quality is the point of departure, and commitment to the<br />
brand is the ultimate stage at which the brand has firm roots (Dwyer, Schurr, & Oh, 1987; Berry, 2000). The<br />
four causal relationships inherent in this chain (quality → <strong>value</strong>, <strong>value</strong> → <strong>satisfaction</strong>, <strong>satisfaction</strong> → <strong>trust</strong><br />
and <strong>trust</strong> → commitment) have been empirically validated, and form a point of consensus in the marketing<br />
research. However, most models seem to focus on one portion of the causal chain, i.e., either on consumer<br />
<strong>satisfaction</strong> at the beginning, or on the links between <strong>trust</strong> and commitment at the end. To our knowledge, no<br />
empirical application has simultaneously integrated all five concepts.<br />
Figure 1. Logical chain of relationship marketing<br />
Perceived<br />
<strong>Quality</strong><br />
Global<br />
Value<br />
Cumulative<br />
Satisfaction<br />
Trust<br />
Commitment<br />
Concerning the upstream portion of the chain, Zeithaml (1988), Parasuraman, Zeithaml, and Berry (1988),<br />
who studied means-ends chains, empirically validated the "perceived quality → <strong>value</strong>" link, emphasizing that<br />
9
quality is one of the major antecedents of <strong>value</strong>. Oliver (1999) and Slater and Narver (2000) insisted on the<br />
role of perceived quality, among other factors, as a source of <strong>value</strong> enhancement (understood as a cost-<br />
benefit ratio) and hence greater <strong>satisfaction</strong>. Cronin and Taylor (1992) showed that it is perceived quality that<br />
influences <strong>satisfaction</strong> and not the reverse, contrary to the formulations of Bitner (1990) or Bolton and Drew<br />
(1991). Other authors have also justified the "perceived quality → <strong>satisfaction</strong>" link (Fornell, 1992;<br />
Anderson, Fornell, & Lehman, 1994; Anderson & Sullivan, 1993) and emphasized the role of perceived<br />
quality in creating a feeling of overall <strong>satisfaction</strong>. Zeithaml, Berry, and Parasuraman (1996) argued for the<br />
causal link "perceived quality → <strong>satisfaction</strong> → loyalty" and empirically demonstrated the "perceived quality<br />
→ loyalty" link. In their ACSI model, Fornell, Johnson, Anderson, Cha, and Bryant (1996) validated -- but at<br />
an aggregated level -- the causal chain "perceived quality → <strong>value</strong> → cumulative <strong>satisfaction</strong> → loyalty".<br />
Finally, Oliver (1999) proposed that <strong>value</strong> be regarded as an antecedent of <strong>satisfaction</strong> when seen as the<br />
overall cost-to-benefit ratio (as in this study). Note that the author also suggested that a "broader" view of<br />
<strong>value</strong> could make <strong>satisfaction</strong> a source of perceived <strong>value</strong>, or <strong>value</strong> and <strong>satisfaction</strong>, both functions of<br />
perceived quality, could be "situated at the same level" rather than linked by a causal relation. Concerning<br />
the downstream portion of the chain, Morgan and Hunt (1994) demonstrated the "<strong>trust</strong> → commitment"<br />
causality in an industrial setting. They emphasized the role of performance, <strong>value</strong>, and <strong>satisfaction</strong> as<br />
antecedents of <strong>trust</strong>, placing them under the heading "benefits of the relationship". Certain authors have<br />
nevertheless suggested inverting the causality between <strong>satisfaction</strong> and <strong>trust</strong>, using the structural model<br />
validated by Morgan and Hunt (1994). Accordingly, Singh and Sirdeshmukh (2000) situated <strong>trust</strong> (in the<br />
"cumulative" sense) as a prerequisite to "<strong>satisfaction</strong> with the transaction". These authors, who articulated the<br />
cumulative (acquired <strong>trust</strong>) and transactional (<strong>satisfaction</strong> with the transaction) perspectives, identified the<br />
cumulative relationship (in this case, <strong>trust</strong>) as an influential factor in evaluating a particular experience<br />
(transactional quality and <strong>satisfaction</strong>), which logically led them to reverse the causality. In sum, perceived<br />
quality is most often considered as the foundation of a brand - consumer relationship that is manifested<br />
downstream by the creation of a deep commitment to the brand. Two links have nevertheless given rise to<br />
contradictory conceptualizations ; <strong>value</strong> and <strong>satisfaction</strong> on the one hand, and <strong>satisfaction</strong> and <strong>trust</strong> on the<br />
other. This contradiction can be explained in terms of the perspective adopted by the authors: transactional,<br />
10
cumulative, or a combination of the two. Indeed, the cumulative status of the relationship (<strong>trust</strong>, cumulative<br />
<strong>satisfaction</strong>) at any given moment influences perceived performance during a particular experience, as well<br />
as any evaluation that follows from that relationship (quality, <strong>value</strong>, <strong>satisfaction</strong>). The present study takes a<br />
solely cumulative approach.<br />
AN EMPIRICAL STUDY ON RETAIL BANKING<br />
This empirical study concerns the consumer relationship to a large bank. Due to its complexity and the<br />
associated implications and perceived risks, the banking services sector is an interesting field for studying the<br />
brand-consumer relationship (Berry, 1983, 1995). In addition, as Berry (2000) emphasized, "the company<br />
becomes the brand" in the service sector. Banks today still stand to lose business if they are not able to<br />
counter their competitors' offers of products (often hard to differentiate) and to cope with critical incidents<br />
(Parasuraman & Grewal, 2000). From this perspective, the development of a reciprocal relationship of <strong>trust</strong><br />
and commitment between the bank and its customers becomes a prime objective.<br />
This study pertains more to the bank as an institution than to the customer's relationship to a customer<br />
relations manager or a particular product. Two surveys were conducted, the second one serving as a cross-<br />
validation of the first. For the first survey (Phase 1) run in the spring of 2000, 30,000 questionnaires were<br />
sent by mail to a representative sample of 18- to 75-years old customers of a regional branch of the bank.<br />
The sample was randomly drawn from the general client base. A total of 2,150 completed questionnaires<br />
were returned, making for a response rate of 7.16%. The second phase (Phase 2) was run under similar<br />
conditions in the Spring of 2001. Of the 30,000 questionnaires sent out, 2,154 were returned (response rate<br />
7.2%). Among the respondents, there were 528 individuals who had participated in the first phase. The<br />
second sample was used for the cross-validation.<br />
Exploratory Factor Analysis<br />
Since the questionnaire was to be distributed by mail, by the bank itself, to its own customers, it needed to be<br />
reasonably short, with a limited number of items measuring each concept. The rating scales used were not<br />
developed by the authors but were borrowed or adapted from the literature (Appendix A1); all had been<br />
validated previously. Because our approach was relational, the concepts were defined and operationalized<br />
according to a "cumulative" logic. Our formulation of the items was not based on a "particular consumption<br />
11
experience" (from a transactional perspective) but on the cumulative, overall relationship with the bank as a<br />
whole, from a perspective that spans different time frames. In order to maintain the rigor of the validity test,<br />
the items were mixed up in the questionnaire and were not presented "construct by construct", given that the<br />
latter practice tends to have a direct impact on the internal consistency of the ratings. As a first step,<br />
exploratory factor analyses were conducted on the first sample (phase 1), to refine the seven constructs<br />
(technical and functional quality, <strong>value</strong>, <strong>satisfaction</strong>, credibility and benevolence, commitment) taken in<br />
isolation, then two by two, three by three, etc. These analyses led us to delete one functional-quality item that<br />
showed too little correlation with the other two (funcqual1). In accordance with Grönroos's (1983) theoretical<br />
framework, perceived quality can be broken down into "technical quality" and "functional quality". By<br />
contrast, <strong>trust</strong> consists of a single dimension; this runs contrary to the results found by Ganesan and Hess<br />
(1997), who distinguished credibility and benevolence. The global exploratory factor analysis of the six<br />
constructs (Table 1) indicated that, despite their number, their conceptual proximity, the use of a single<br />
method (Likert scale), and the mixing up of the items in the questionnaire, the constructs demonstrated an<br />
acceptable degree of convergent and discriminant validity. All correlations between the items and the factor<br />
they are assumed to measure were high; inversely, all correlations between these items and the other factors<br />
were less than 0.25. Cronbach's alpha coefficients calculated on this basis are shown in Table 1. They range<br />
between .73 and .90, which can be considered satisfactory.<br />
Table 1. Principal component analysis on all items and Cronbach’s Coefficients (Phase 1, 2000) , oblique<br />
rotation, correlations below .25 are not shown).<br />
Item factor1 factor2 factor3 factor4 factor5 factor6<br />
Cronbach’s alpha 0.77 0.75 0.90 0.89 0.73 0.82<br />
techqual1 .93<br />
techqual2 .73<br />
funcqual1 .84<br />
funcqual2 .90<br />
funcqual3<br />
val1 -.98<br />
val2 -.81<br />
satis1 -.98<br />
satis2 -.60<br />
satis3 -.61<br />
<strong>trust</strong>1 -.87<br />
<strong>trust</strong>2 -.85<br />
<strong>trust</strong>3 -.76<br />
12
<strong>trust</strong>4 -.68<br />
commit1 .59<br />
commit2 .51<br />
commit3 .92<br />
Confirmatory Factor Analysis<br />
We tested the unidimensionality (in the sense defined by Anderson, Gerbing, and Hunter, 1987) of each<br />
construct separately, then two by two, three by three, etc., and finally for all six constructs taken together.<br />
The confirmatory factor analysis were performed by Lisrel 8 software. The estimation was performed using<br />
the maximum likelihood method because of its robustness for large sample sizes (n = 2,150 and n = 2,154 for<br />
Phases 1 and 2, respectively). The results are presented in Table 2. For Phase 1, the <strong>value</strong>s of the goodness-of<br />
fit indexes, RMSEA, AGFI, and RMR, are quite satisfactory, as were the principal indexes of the goodness<br />
of fit with a saturated model (non-normed fit index, comparative fit index). We can therefore accept the<br />
overall unidimensionality of the six constructs. Note, however, that we had to delete one item from the<br />
commitment construct (attach3). The Phase 2 estimation, conducted for the purposes of cross-validation, was<br />
computed on exactly the same items. The result was confirmed and the fit was slightly better. Having<br />
demonstrated the unidimensionality of the constructs, we then went on to determine their psychometric<br />
properties.<br />
Convergent validity. The six constructs exhibited good convergent validity. The lambda coefficients<br />
(equivalent to the notion of saturation in factor analysis) were all above 0.70 and are highly significant. The<br />
reliability coefficients of the composite factors ranged between 0.72 and 0.90 (percentage of the variance<br />
shared by all items measuring a given factor). The mean variance indicators, which assess the portion of true<br />
variance extracted from the questions measuring a construct with respect to the margin of error (Fornell and<br />
Larker, 1981), were all above 0.57 (Table 3), which is still within the satisfactory range. Very similar results<br />
were found in Phase 2, the cross-validation phase. We can see considerable stability in the reliability<br />
coefficients and variance coefficients obtained (Table 3).<br />
Discriminant validity. Here, the results are not as good due to the higher correlations between the constructs.<br />
Comparing the mean variance indicators obtained (shared variance indexes) with the squares of the inter-<br />
construct correlations (see Table 4), we can see that technical quality, global <strong>value</strong>, <strong>satisfaction</strong>, <strong>trust</strong>, and<br />
13
commitment share about the same amount of variance with each other as with their own measures<br />
(sometimes a little more, sometimes a little less). This lack of discriminant validity was confirmed by the<br />
cross-validation (Phase 2), where we observed very similar correlation levels (Table 4). These results,<br />
observed for a large sample of "real" customers, allay doubts as to the discriminant validity of the constructs<br />
and to the magnitude of their respective contributions to explaining consumer behavior, since they share<br />
essentially the same variance. To put this strict interpretation into perspective, note that the high correlations<br />
can be partly attributed to the fact that the items were measured via a single method (Likert scale), which<br />
artificially increases correlations between constructs, through a common "method" effect.<br />
Table2. Fit indicators of the measurement model (confirmatory factor analysis)<br />
Phase 1 (2000) Phase 2 (2001)<br />
Chi-square,75 df (prob) 389 (.0) 343 (.0)<br />
RMSEA (prob) .044 (.99) .041 (1)<br />
standardized RMR .021 .019<br />
AGFI .96 .97<br />
CFI .98 .99<br />
RFI .94 .98<br />
Table 3. Psychometric properties obtained in the confirmatory factor analysis<br />
Phase 1 (2000) Phase 2 (2001)<br />
No. of Coefficient of Coefficient of Coefficient of Coefficient of<br />
items reliability () shared variance reliability shared variance<br />
Functional quality 2 .75 .60 .73 .58<br />
Technical quality 2 .72 .57 .76 .62<br />
Global <strong>value</strong> 2 .81 .68 .83 .72<br />
Satisfaction 3 .88 .71 .89 .73<br />
Trust 4 .90 .68 .90 .69<br />
Commitment 2 .74 .59 .73 .57<br />
Table 4. Correlations between constructs (confirmatory factor analysis), Phase 1 (2000) and Phase 2 (2001)<br />
Technical Functional Global <strong>value</strong> Satisfaction Trust<br />
quality quality<br />
Technical quality 1<br />
Functional quality .52 (.56) 1<br />
Global <strong>value</strong> .77 (.79) .58 (.59) 1 .<br />
Satisfaction .75 (.78) .66 (.65) .83 (.82) 1<br />
Trust .70 (.75) .66 (.63) .72 (.73) .82 (.83) 1<br />
Commitment .75 (.81) .67 (.69) .81 (.83) .81 (.86) .84 (.86)<br />
Thus, we found contrasted results that fit well enough to allow us to validate the unidimensionality of the<br />
constructs but with high correlations, suggesting a lack of discriminant validity. During both research phases,<br />
14
we observed that the least correlated constructs were the two dimensions of product quality -- technical and<br />
functional (r = 0.52, see Table 4). The other constructs (<strong>value</strong>, <strong>satisfaction</strong>, <strong>trust</strong>, and commitment) were<br />
strongly and approximately equally correlated (between 0.72 and 0.84 for Phase 1 and between 0.73 and 0.86<br />
for Phase 2), and as we have seen, lack discriminant validity. This observed lack of discriminant validity<br />
answers our initial question. At the theoretical level, each concept has its own meaning: the excellence of<br />
products and services (perceived quality), the cost-benefit tradeoff (perceived <strong>value</strong>), the fulfillment of<br />
individual goals through consumption experiences (cumulative <strong>satisfaction</strong>), the credibility and perceived<br />
benevolence of the brand (<strong>trust</strong>), and the desire to maintain a strong and lasting relationship with the brand<br />
(commitment). On the other hand, at the empirical level, a simultaneous analysis of all of these concepts<br />
indicated strong correlations between them, casting doubt on the usefulness of having separate concepts in<br />
our attempts to understand the consumer relationship to the brand. As soon as the questionnaire moved away<br />
from concrete evaluations of products in order to assess abstract constructs related to brands, the respondents<br />
seemed to have more difficulty discriminating the concepts (<strong>satisfaction</strong>, <strong>trust</strong>, commitment). While these<br />
theoretical developments are relevant, applying them to surveys may seem at least partly superfluous in<br />
studying the brand-consumer relationship and predicting its effects on consumer behavior.<br />
Testing the Relational Chain "<strong>Quality</strong> → Value → Satisfaction → Trust → Commitment"<br />
Our study of the literature shows that few authors have devised and empirically tested an overarching model<br />
of the relationship to the brand. Most researchers prefer to visualize the principal constructs in pairs (quality<br />
and <strong>value</strong>, <strong>trust</strong> and commitment, etc.) Nevertheless, the literature does propose a theoretical model in the<br />
form of a causal chain: quality → <strong>value</strong> → <strong>satisfaction</strong> → <strong>trust</strong> → commitment, as we discussed in Section 1<br />
(see figure 1 below). In order to validate this chain, we began by testing a completely recursive model<br />
(depicted as solid lines in Figure 2) which represents the (strong) hypothesis that the effect of each concept in<br />
the upstream portion of the chain is completely mediated by the concepts in the downstream portion.<br />
Although this model is very restrictive, it is faithful to the idea that the fundamental goal of relationship<br />
marketing is to build a lasting relationship through the accumulation of positive experiences, based on a<br />
quality management policy that leads to lasting customer commitment to the brand (Dwyer, Schurr, and Oh,<br />
1987). The Phase 1 assessment showed that the model, in its most restrictive form, is not satisfactory. We<br />
15
had to make it more flexible by allowing both facets of perceived quality to have direct effects on<br />
<strong>satisfaction</strong>, <strong>trust</strong>, and commitment (dotted lines in Figure 2). This made for a satisfactory estimation,<br />
including in Phase 2 (Table 5). We clearly observed a "relational chain" structure with significant direct<br />
effects of both quality components (technical and functional) on <strong>value</strong>, and effects of <strong>value</strong> on <strong>satisfaction</strong>, of<br />
<strong>satisfaction</strong> on <strong>trust</strong>, and finally, of <strong>trust</strong> on commitment (Figure 2). Indeed, all these links are positive,<br />
strong, and nearly equal in intensity (close to 0.5). The same results were obtained in Phase 2 (<strong>value</strong>s shown<br />
in parentheses in Figure 2).<br />
Figure 2. Structure of the model of the relationship marketing chain (standardized coefficients for Phase 1<br />
(Phase 2 in parentheses))<br />
Technical<br />
<strong>Quality</strong><br />
Functional<br />
<strong>Quality</strong><br />
.69 (.71)<br />
.23 ( 19)<br />
.27 (.36)<br />
Perceived<br />
Value<br />
.47 (.39) .54 (.56)<br />
Satisfactio<br />
n<br />
.24 (.21) .20 (.13)<br />
.19 (.24) .38 (.43)<br />
Trust<br />
.45 (.42)<br />
.19 (.19)<br />
Table 5. Test of model : Relational chain: quality -> <strong>value</strong> -> <strong>satisfaction</strong> -> <strong>trust</strong> -> commitment<br />
Phase 1 (2000) Phase 2 (2001)<br />
Chi-square, 78 df (prob) 447 (.00) 389 (.00)<br />
RMSEA (prob) .048 (.79) .044 (.99)<br />
standardized RMR .023 .021<br />
AGFI .96 .96<br />
CFI .98 .99<br />
RFI .98 .98<br />
Commitment<br />
However, this causal chain does not in itself account for the full impact of perceived quality on the relational<br />
process. Technical and functional quality still have significant direct effects on <strong>satisfaction</strong>, <strong>trust</strong>, and<br />
commitment. These direct effects characterize the impact of the perceived quality of products and services --<br />
16
outside of the consumption experience -- on the relationship between the customer and the institution, and<br />
they confirm the fundamental role played by quality in building a lasting relationship with the customer. A<br />
comparison of the magnitude of these direct effects showed that technical quality (bank products) plays a<br />
more important role than functional quality (bank services), particularly with the former's strong impact on<br />
perceived <strong>value</strong>. Note also that the direct effect of technical quality on commitment was almost as great as<br />
that of <strong>trust</strong>. Added to the indirect effects of technical quality via the components of the relational chain, this<br />
direct effect gave us a total effect of technical quality on commitment of 0.61 versus 0.36, 0.11, 0.24, and<br />
0.47 for functional quality, <strong>value</strong>, <strong>satisfaction</strong>, and <strong>trust</strong>, respectively (keeping in mind that the parameter<br />
<strong>value</strong>s are partially affected by the theoretical structure of the model tested). Thus, among the concepts<br />
studied here, technical quality had the strongest effect on commitment to the brand, a concept shown in the<br />
literature to be strategic in building a lasting relationship with customers. The same result having been<br />
observed in Phase 2, we can conclude that technical quality remains a fundamental indicator to be monitored,<br />
for any decline in technical quality has potentially major consequences at the downstream end of the chain.<br />
The model of the relational chain -- which is the most common in the existing literature -- emphasizes the<br />
fundamental role played by perceived quality at the managerial level, in so far as it is the basis for<br />
developing and maintaining the relationship with the customer. Furthermore, because the causal structure is<br />
in the form of a chain ending with commitment -- the final stage in the development of the relationship<br />
according to Berry (2000) -- all the links in the chain must be reinforced: quality, <strong>value</strong>, <strong>satisfaction</strong>, and<br />
<strong>trust</strong>. Like all chains, it may become more fragile if any one of its links weakens, putting the entire relational<br />
structure in jeopardy. An example might be the case of a customer who left his bank after years of<br />
satisfactory dealings leading to a strong commitment, because he perceived more <strong>value</strong> in what a competitor<br />
had to offer.<br />
CONCLUSION<br />
Working in the field of relationship marketing, we tested the validity of five major concepts characterizing<br />
the customer's relationship to the brand: perceived quality (both technical and functional), global <strong>value</strong>,<br />
<strong>satisfaction</strong>, <strong>trust</strong>, and commitment. While we were able to show their unidimensionality and their<br />
convergent validity, their strong correlations (ranging from 0.70 to 0.80) cast doubt on their discriminant<br />
17
validity. This raised a question about the respective contributions of concepts which share more than 50% of<br />
their variance, whether in characterizing the customer-brand relationship at a given moment or in predicting<br />
its impact on consumer behavior, particularly on loyalty (repurchase, price tolerance, resistance to change,<br />
positive word of mouth). An analysis of the relationships between these concepts showed that, if we admit<br />
that causal structure, the sequence "quality → <strong>value</strong> → <strong>satisfaction</strong> → <strong>trust</strong> → commitment" is the one that<br />
fits our data the best. Nonetheless, this causal structure merits further development at the theoretical level. In<br />
particular, we suggest that the causal structure of the chain may vary according to whether it is viewed from<br />
a transactional or cumulative perspective.<br />
This study suffers from several limitations and brings up a number of methodological questions for future<br />
research in relationship marketing. 1) We studied the brand-consumer relationship at a single moment, even<br />
though it is more of an incremental process, as Weitz and Jap (1995) already emphasized in their critique of<br />
the studies by Morgan and Hunt (1994) or Fournier (1998). 2) At the time of our surveys, it is difficult to<br />
guarantee that the object evaluated (even though it was clearly stated in the questionnaire) was the same for<br />
all respondents: Was it the institution, the brand, a particular product, a customer service manager? 3) The<br />
use of a single method could have artificially inflated the correlations, thus undervaluing the discriminant<br />
validity. Using the same method (Likert scales) to measure the same object (the relationship to the brand) at<br />
the same moment (one questionnaire) can create halo effects. 4) Since the response rate to the questionnaire<br />
was only 7.7%, our sample certainly suffered from representativity problems, even though it maintained the<br />
division of the population according to the major socio-demographic criteria. 5) Since banks mainly provide<br />
a "utilitarian" service, it would be interesting to see how the results evolve for more experiential products or<br />
services in fields like consumer food products, sports, leisure activities, or artistic pursuits.<br />
18
REFERENCES<br />
Anderson Eugene W., Fornell Claes, and Lehman Donald R. Customer <strong>satisfaction</strong>, market share and<br />
profitability: findings from Sweden. Journal of Marketing 1994; 58 (July): 53-66.<br />
Anderson Eugene.W. and Sullivan Mary W. The antecedents and consequences of customer <strong>satisfaction</strong> for<br />
firms. Marketing Science 1993; 12 (Spring): 125-143.<br />
Anderson James C., Gerbing David and Hunter John E. On the assessment of unidimensional measurement:<br />
internal and external consistency and overall consistency criteria. Journal of Marketing Research 1987; 24<br />
(November): 432-437.<br />
Becker Gary S. The Economic Approach to Human Behavior. Chicago: University of Chicago Press, 1976.<br />
Berry Leonard L. Relationship marketing. In: G.L. Shostack and G. Upah, editors. Perspectives On Services<br />
Marketing. Emerging, Chicago: AMA, 1983.<br />
Berry Leonard L. Relationship marketing of services - growing interest, emerging perspectives. Journal of<br />
the Academy of Marketing Science 1995; 23 (Fall): 236-245.<br />
Berry Leonard L. Cultivating service brand equity. Journal of the Academy of Marketing Science 2000; 28<br />
(Winter): 128-137.<br />
Bitner Mary J. Evaluating service encounters: the effects of physical surroundings and employee responses.<br />
Journal of Marketing 1990; 54 (April): 69-82.<br />
Bolton Ruth N. and. Drew James H. A multistage model of customers' assessment of service quality and<br />
<strong>value</strong>. Journal of Consumer Research 1991; 17 (March): 375-384.<br />
Boulding William, Kalra Ajay, Staelin Richard, and Zeithaml Valarie A. A dynamic process model of<br />
service quality: from expectations to behavioral intentions. Journal of Marketing Research 1993; 30<br />
(February): 7-27.<br />
Brady Michael K. and Cronin Joseph J. Some new thoughts on conceptualizing perceived service quality: a<br />
hierarchical approach. Journal of Marketing 2001; 65 (July):34-49.<br />
Cronin Joseph J. and Taylor Steven A. Measuring service quality: a reexamination and extension. Journal of<br />
Marketing 1992; 56 (July): 55-68.<br />
19
Dick Alan S. and Basu Kunal. Customer loyalty: toward an integrated conceptual framework. Journal of the<br />
Academy of Marketing Science 1994; 22 (Spring): 99-113.<br />
Dwyer F. Robert, Schurr Paul H. and Oh Sejo. Developing buyer-seller relationships. Journal of Marketing<br />
1987; 51 (April): 11-27.<br />
Fornell Claes. A national <strong>satisfaction</strong> barometer: the swedish experience. Journal of Marketing 1992; 56<br />
(January): 1-21.<br />
Fornell Claes, Johnson Michael D., Anderson Eugene W., Cha Jaesung and Bryant Barbara Everitt. The<br />
american customer <strong>satisfaction</strong> index: nature, purpose, and findings. Journal of Marketing 1996; 60<br />
(October): 7-18.<br />
Fornell Claes and Larcker David F. Structural equation models with unobservable variables and<br />
measurement error: algebra and statistics. Journal of Marketing Research 1981; 18 (August): 382-388.<br />
Fournier Susan. Consumers and their brands: developing relationship theory in consumer research. Journal of<br />
Consumer Research 1998; 24 (Mars): 343-373.<br />
Fournier Susan and Mick David Glen. Rediscovering <strong>satisfaction</strong>. Journal of Marketing 1999; 63 (October):<br />
5-23.<br />
Ganesan Shankar. Determinants of long-term orientation in buyer-seller relationships. Journal of Marketing<br />
1994; 58 (April): 1-19.<br />
Ganesan Shankar and Hess Ron. Dimensions and levels of <strong>trust</strong>: implications for commitment to a<br />
relationship. Marketing Letters 1997; 8 (October): 439-448.<br />
Garbarino Ellen and Johnson Mark S. The different roles of <strong>satisfaction</strong>, <strong>trust</strong> and commitment in customer<br />
relationships. Journal of Marketing 1999; 63 (April): 70-87.<br />
Grönroos Christian. Strategic Management and Marketing in the Service Sector. Cambridge, MA: Marketing<br />
Science Institute, 1983.<br />
Gruen Thomas W., Summers John O. and Frank Acito. Relationship marketing activities, commitment, and<br />
membership behavior in professional associations, Journal of Marketing 2000; 64 (July): 34-49.<br />
Gundlach Gregory T., Achrol Ravi S. and Mentzer John T. The structure of commitment in exchange.<br />
Journal of Marketing 1995; 59 (January): 78-92.<br />
20
Holbrook Morris B. Consumer Value: A Framework for Analysis and Research. Routledge Interpretative<br />
Market Research Series, 1999.<br />
Iacobucci Dawn, Grayson Kent A. and Ostrom Amy L. The calculus of service quality and customer<br />
<strong>satisfaction</strong>: theoretical and empirical differentiation and integration. Advances in Services Marketing and<br />
Management 1994; 3: 1-67.<br />
Jacoby J. and Chestnut R. Brand Loyalty: Measurement and Management. New York: John Wiley, 1978.<br />
Johnson Michael D., Anderson Eugene W. and Fornell Claes. Rational and adaptive performance<br />
expectations in a customer <strong>satisfaction</strong> framework. Journal of Consumer Research 1995; 21 (March): 695-<br />
707.<br />
Kelman H.C. Compliance, identification, and internalization: Three Processes of Attitude Change. Journal of<br />
Conflict Resolution 1958; 2: 51-60.<br />
Lai Albert Wenben. Consumer <strong>value</strong>s, product benefits and customer <strong>value</strong>: a consumption behavior<br />
approach. In: F.R. Kardes and M. Sujan, editors. Advances In Consumer Research, vol. 22., Provo, UT:<br />
Association for Consumer Research, 1995. pp. 381-388.<br />
Meyer John P. and Allen Natalie J. A three-component conceptualization of organizational commitment.<br />
Human Resource Management Review 1991; 1 (Spring): 61-89.<br />
Morgan Robert M. and Hunt Shelby D. The commitment-<strong>trust</strong> theory of relationship marketing. Journal of<br />
Marketing 1994; 58 (July): 20-38.<br />
Mowday Richard T., Steers Richard M. and Porter Lyman W. The measurement of organizational<br />
commitment. Journal of Vocational Behavior 1979; 14: 224-247.<br />
Oliver Richard L. A conceptual model of service quality and service <strong>satisfaction</strong>; compatible goals, different<br />
concepts. Advances In Services Marketing And Management 1993; 2: 65-85.<br />
Oliver Richard L. Satisfaction: A Behavioral Perspective on the Consumer. New York: MacGraw Hill, 1997.<br />
Oliver Richard L. Value as excellence in the consumption experience. In: Holbrook Morris B., editor.<br />
Consumer Value: a Framework for Analysis and Research. Routledge, 1999, pp. 43-62.<br />
21
Parasuraman A. and Grewal Dhruv. Serving customers and consumers effectively in the twenty-first century:<br />
a conceptual framework and overview. Journal of the Academy of Marketing Science 2000; 28 (Winter): 9-<br />
16.<br />
Parasuraman A., Zeithaml Valarie A. and Berry Leonard L. Servqual: A multiple-item scale for measuring<br />
consumer perceptions of service quality. Journal of Retailing 1988; 64 (Spring): 12-40.<br />
Singh Jagdip and Sirdesmukh Deepak. Agency and <strong>trust</strong> mechanisms in consumer <strong>satisfaction</strong> and loyalty<br />
judgments. Journal of the Academy of Marketing Science 2000; 28 (Winter): 150-167.<br />
Slater Stanley T. and Narver John C. Intelligence generation and superior <strong>value</strong>. Journal of the Academy of<br />
Marketing Science 2000; 28 (Winter): 120-127.<br />
Zeithaml Valarie A. Consumer perceptions of price, quality, and <strong>value</strong>: a means-end model and synthesis of<br />
evidence. Journal of Marketing 1988; 52 (July): 2-22.<br />
Zeithaml Valarie A., Berry Leonard L. and Parasuraman A. The behavioral consequences of service quality.<br />
Journal of Marketing 1996; 60 (April): 31-46.<br />
22
APPENDIX 1. DESCRIPTION OF THE ITEMS<br />
Perceived quality. We adopted the approach taken by Grönroos (1983), who distinguished two dimensions:<br />
(1) core-service performance -- here banking products (savings accounts, stocks, homeowner's loans, and life<br />
insurance, 2 items) -- which corresponds to the notion of technical quality, and (2) quality as manifested in<br />
the bank's physical service provisions (arrangement of lobby, cleanliness, and general welcome in the bank's<br />
branches, 3 items), which corresponds to the notion of functional quality.<br />
Perceived global <strong>value</strong>. This dimension was measured in a cumulative perspective, as the ratio of received<br />
benefits to agreed sacrifices in the course of the customer's dealings with the service provider (Zeithaml,<br />
1988; 2 items).<br />
Cumulative <strong>satisfaction</strong>. Derived from Oliver's (1997) rating scale, cumulative <strong>satisfaction</strong> is affected by the<br />
possible regret felt from having established a commercial relationship with the bank (3 items).<br />
Trust. Trust was measured through its two main facets, based on the work by Ganesan and Hess (1997): the<br />
service provider's credibility (2 items) and benevolence (2 items).<br />
Commitment. Commitment refer to the “relative intensity of identification and involvement” with the bank<br />
(Mowday, Steers, and Porter, 1979). It was operationalized as a whole with the use of three items that mean<br />
the share of <strong>value</strong>s and goals of the bank and a sense of membership.<br />
23
Construct Item How construct is approached in questionnaire<br />
Technical qualitytechqual1<br />
If I have to take out a loan to buy a house or apartment, Bank XX will<br />
(Grönroos)<br />
offer me a mortgage at an advantageous rate<br />
techqual2 If one day I have to buy some stocks or bonds, I think I would go to<br />
Bank XX to accomplish this operation<br />
Functional qualityfuncqual1<br />
I always feel welcome in the branch offices of Bank XX<br />
(Grönroos)<br />
funcqual2 The branch offices of Bank XX are particularly well kept<br />
funcqual3 The branch offices of Bank XX are well designed and furnished<br />
Global <strong>value</strong> (Zeithaml) val1 The products and services of Bank XX are generally offered at a good<br />
quality-to-price ratio<br />
val2 The services provided by Bank XX are good for the price they charge<br />
Cumulative <strong>satisfaction</strong>satis1<br />
Since I've been a customer of Bank XX, I've had no complaints about<br />
(Oliver)<br />
the management of my checking account<br />
satis2 I really made the right decision in choosing Bank XX as my bank.<br />
satis3 I'm satisfied with the services provided by Bank XX<br />
Trust (Ganesan & Hess) <strong>trust</strong>1 My account advisor at Bank XX performs his/her job with real<br />
integrity<br />
Credibility <strong>trust</strong>2 I know I can count on the promises my financial advisor makes me<br />
Benevolence <strong>trust</strong>3 My counselor at Bank XX takes my interests into account<br />
<strong>trust</strong>4 My counselor at Bank XX is always ready to help me in case of a<br />
problem<br />
Commitment (Mowday, commit1 At Bank XX, I feel like I'm more than just a customer<br />
Steers and Porter, 1979)<br />
commit2 I share the <strong>value</strong>s stated by Bank XX<br />
commit3 Bank XX is clearly different from other banks<br />
Note.: The scales have been adapted to a European context and to a retail banking market and translated into<br />
a European language (and translated again in English in this appendix)<br />
24
An Empirical Examination of Retail Convenience for In-Store and Online Shoppers<br />
Nicole Ponder, Mississippi State University<br />
Michelle Bednarz, Mississippi State University<br />
Abstract: In this study, we develop and assess multidimensional scales of retail convenience for<br />
in-store and online shoppers. Principal components analysis and confirmatory factor analysis reveal<br />
five dimensions of retail convenience for in-store shoppers, and four dimensions of retail<br />
convenience for online shoppers. Analysis of variance results indicate that online shoppers benefit<br />
more from access convenience and search convenience than in-store shoppers. Implications for<br />
retailers and areas for future research are also addressed.<br />
Key Words: convenience, consumer decision-making, online shopping, scale development<br />
Introduction<br />
The concept of convenience has been an important topic in marketing for a time period<br />
spanning approximately 80 years (Copeland 1923; Gardner 1945; Kelley 1958; Brown 1989, 1990;<br />
Seiders, Berry, and Gresham 2000; Berry, Seiders, and Grewal 2002). However, much of this<br />
research focuses on convenience goods, rather than convenience as a benefit realized by the<br />
consumer. Because today’s consumer is more time-starved than ever, it is appropriate to more<br />
carefully consider convenience as a concept of utmost importance.<br />
Foote (1963) characterized the consumer of the future (in the year 2000) as one whose<br />
primary constraints are no longer money, but time and learning. His prediction is correct. Today’s<br />
consumers consider the resource of time as valuable as money (if not more valuable). Bhatnagar,<br />
Misra, and Rao (2000, p.98) confirm this by stating that “the consumer maximizes his utility subject<br />
to not only income constrains but also time constraints.”<br />
As time becomes a more valuable consumer resource, convenience also provides added<br />
<strong>value</strong>. Michael J. Sansolo, senior vice-president at the Food Marketing Institute, illustrates the<br />
degree of importance consumers place on convenience by stating, “Give shoppers a choice between<br />
lower prices or more convenience and convenience will win every time” (Forster 2002, p. 120).<br />
Online shopping is particularly well suited to offer convenience to time-starved consumers<br />
(Kaufman-Scarborough and Lindquist 2002). In an otherwise lackluster economy, the strong<br />
25
growth rates of companies such as eBay, Land’s End, and Amazon have occurred because they<br />
provide customers with what they want – its all about convenience (Green 2002).<br />
When examining the literature related to the convenience construct, many gaps exist,<br />
particularly in a retail context. While it is assumed that consumers often seek convenience in<br />
shopping situations, we know little about the individual dimensions of retail convenience. Seiders,<br />
Berry, and Gresham (2000) propose four dimensions of convenience that are particularly relevant<br />
for retailers: access, search, possession, and transaction convenience (see Table 1). An empirical<br />
investigation of how these convenience dimensions provide a benefit to consumers is warranted.<br />
Specifically, do in-store shoppers and online shoppers seek and obtain different types of<br />
convenience? This study considers that different structures of retail convenience may exist,<br />
depending on the shopping format chosen by the consumer. The argument developed here is that<br />
different shopping formats deliver different types of convenience, and a consumer’s preference for a<br />
specific type of convenience determines his or her decision to choose a particular shopping format –<br />
either online or at a traditional store.<br />
This study is important for several different reasons. First, it follows the logical progression<br />
of research in this area. Retailers may now better understand the existence of different convenience<br />
dimensions, but how can they use this new knowledge to better satisfy customers? As Berry (2001,<br />
p. 136) states, “Superior retailers understand that people’s most precious commodity in the modern<br />
world is time and do everything they can to save as much of it as possible for their customers.” By<br />
developing a better understanding of the different dimensions of retail convenience and by<br />
understanding which dimensions of convenience are most important to customers, retailers will be<br />
able to better understand how to meet customers’ needs, thus improving customer <strong>satisfaction</strong>. If<br />
properly implemented, retail convenience could become a source of sustainable competitive<br />
advantage for retailers.<br />
26
This paper is organized in the following manner: A review of the literature relevant to this<br />
study is presented. Scale development procedures are followed in order to more carefully examine<br />
the specific dimensions of retail convenience for both in-store and online shoppers. A different<br />
model for each type of shopping format is hypothesized and tested using structural equation<br />
modeling techniques. Results are given, followed by a discussion that addresses the implications of<br />
the findings for retailers with traditional stores and/or an online presence. Limitations and<br />
directions for future research are also provided.<br />
Literature Review<br />
The concept of convenience first appeared in the marketing literature with Copeland’s (1923)<br />
classification of goods. Copeland suggests that by classifying goods according to his tripartite<br />
structure (convenience, shopping, or specialty goods), marketers can determine the type of store in<br />
which the product should appear and can determine the appropriate concentration of distribution.<br />
Convenience goods are those lower-priced goods which consumers are familiar with and which are<br />
purchased from easily accessible outlets. Gardner (1945, p. 275) provides a further description:<br />
Convenience goods are articles of daily purchase…which are insignificant in <strong>value</strong><br />
or are needed for immediate use. These goods are, to a considerable extent, bought<br />
at the most convenient place without a comparison of <strong>value</strong>s….<br />
As marketers continued to develop other product classification systems, convenience goods<br />
remained an essential staple, re-appearing in several other schemata (Bucklin 1963; Kaish 1967;<br />
Holbrook and Howard 1977; Enis and Roering 1980; Murphy and Enis 1986). Thus, the initial use<br />
of the word “convenience” in the marketing literature was as an adjective describing a class of<br />
consumer goods. Many researchers have conducted studies covering the vast domain of<br />
convenience goods, including convenience foods (e.g., frozen dinners, ready-to-eat cold cereal, fast-<br />
food restaurants) (Crist 1960; Anderson 1972; Reilly 1982; Darian and Cohen 1995), convenience<br />
time-saving durables (e.g., dishwashers, microwave ovens, washers and dryers) (Anderson 1972;<br />
27
Reilly 1982), and time-saving services (e.g., child care, house cleaning services, lawn care services)<br />
(Brown 1990).<br />
Over time, the use of the word “convenience” has changed/evolved from a descriptor of<br />
products into its own unique concept. The more complete definitions of convenience contain one<br />
common element - they all view convenience as any attribute that reduces the non-monetary costs<br />
associated with a product (Kelley 1958; Kotler and Zaltman 1971; Etgar 1978). For purposes of<br />
this study, retail convenience (at its most general level of abstraction) is defined as the consumer’s<br />
perceptions of time and effort costs associated with making a purchase. As the reduction of time<br />
and effort costs is a motivating factor for consumers to seek convenience, these concepts are<br />
described more fully below.<br />
Time and Effort Literature<br />
Time is a limited, scarce, and therefore valuable consumer resource (Jacoby, Szybillo, and<br />
Berning 1976). As a limited, scarce, and valuable resource, consumers are always looking for ways<br />
to save time, be it through convenience products, convenience services, convenience durables, or<br />
more recently through convenience shopping. One reason why saving time has become so<br />
important to consumers is because time, unlike money or other resources, is fixed and therefore<br />
incapable of being expanded (Berry 1979; Gross 1987). According to Berry (2001, p.136),<br />
“Superior retailers understand that people’s most precious commodity in the modern world is time<br />
and do everything they can to save as much of it as possible for their customers.”<br />
Like time, effort is also a valuable consumer resource which is characterized by consumers’<br />
energy expenditures. Activities requiring great amounts of energy on the consumers’ part are<br />
considered inconvenient, while activities requiring minimal energy on the consumers’ part are<br />
considered convenient. As a completely different type of non-monetary cost, consumers’ effort<br />
expenditures not only influence perceptions of convenience (Seiders, Berry, and Gresham 2000),<br />
but also influence levels of <strong>satisfaction</strong> (Lovelock 1983).<br />
28
Human and cognitive effort has been the topic of many studies appearing in other disciplines<br />
including operations management, psychology, decision theory, and economics (Youngdahl and<br />
Kellog 1997; Bettman, Johnson, and Payne 1990). However, consumer effort expenditures have<br />
received significantly less attention within the marketing literature (Berry, Seiders, and Grewal<br />
2002), perhaps because product or service attributes that aim to save effort are perceived as being<br />
the same as, and as a result are lumped together with, those that aim to save time (Brown 1990).<br />
Thus, in a retail context, consumers view both time and effort as costs that are associated with<br />
obtaining the desired product and/or service. In the decision-making process, consumers must<br />
decide if the costs of obtaining the desired product/service are worth the benefits they will receive<br />
from the purchase.<br />
Cost-Benefit Analysis<br />
The driving force that motivates consumers to seek convenience involves saving both time<br />
and effort expenditures. According to Prest and Turvey (1965, p. 683), “Cost-benefit analysis is a<br />
practical way of assessing the desirability of projects” and “implies the enumeration and evaluation<br />
of all the relevant costs and benefits.” When deciding between several alternatives (e.g., whether to<br />
shop in a traditional store or in a virtual store), consumers determine the costs and benefits<br />
associated with each and compare those costs to the benefits.<br />
In the decision-making process, time and effort are significant consumer costs and are often<br />
considered along with money and other resources (Jacoby, Szybillo, and Berning 1976; Bhatnagar,<br />
Misra, and Rao 2000). Consumers choose online shopping because it facilitates the steps in the<br />
decision process, saving consumers both time and effort in the search, alternative evaluation, and<br />
purchase stages. Bhatnagar, Misra, and Rao (2000) apply cost-benefit analysis to explain why<br />
consumers choose to shop online:<br />
[Internet stores] tend to reduce the time the consumer spends on shopping (travel<br />
time, time spent parking, time spent traveling from the parking lot to the store, time<br />
spent in the checkout lines) either directly or indirectly. … The only time component<br />
29
emaining is the time spent browsing the Web sites (which corresponds to the time<br />
spent browsing the aisles in the more traditional sources of retailing). Therefore, a<br />
great attraction of the Internet is the convenience that it affords (p. 98).<br />
In other words, the benefits of shopping online (easy access to retailers) outweigh the costs (not<br />
obtaining the product immediately). Depending on what type of convenience is most important to<br />
the consumer, the cost-benefit analysis could lead to a different shopping format decision. The<br />
different types of convenience that consumers may choose to seek are described below.<br />
The Multidimensional Nature of the Convenience Construct<br />
Table 1 presents the various definitions and dimensions of convenience proposed by<br />
researchers in this area. Brown (1989) is the first to define the construct of convenience, and he<br />
focuses on the need for a definition that reflects the term’s multidimensional nature. The definition<br />
of convenience proposed by Brown (1989, 1990) contains five different dimensions: time, place,<br />
acquisition, use, and execution. Note that all five of the dimensions reflect the idea of saving<br />
consumers’ time and effort expenditures.<br />
--------------------------------<br />
Table 1 about here<br />
--------------------------------<br />
Berry, Seiders, and Grewal (2002) identify and define five dimensions of convenience<br />
applicable to the services arena: access, decision, transaction, benefit, and post-benefit. Seiders,<br />
Voss, Grewal, and Godfrey (2003) empirically investigate these dimensions of service convenience<br />
and their relationship to <strong>value</strong> perceptions and behavioral intentions. Their findings suggest that<br />
decision convenience has a positive effect on <strong>value</strong> perceptions; access convenience has no<br />
significant effect on either <strong>value</strong> perceptions or behavioral intentions; transaction convenience has a<br />
positive effect on behavioral intensions; and benefit convenience has a strong positive effect on<br />
both <strong>value</strong> perceptions and behavioral intentions.<br />
30
Seiders, Berry, and Gresham (2000) identify and define four dimensions of convenience that<br />
are specific to retailers. These four dimensions of retail convenience are essential for the purposes<br />
of this study. They are discussed in greater detail below.<br />
Access convenience. Access convenience is defined as “the speed and ease with which<br />
consumers can reach a retailer” (Seiders, Berry, and Gresham 2000, p. 81). This access may occur<br />
in person, over the phone, through a computer, or in other ways. Access convenience is an<br />
extremely important dimension of retail convenience, because if the consumer cannot reach the<br />
retailer, then all other dimensions of retail convenience are meaningless. In other words, if the<br />
consumer cannot reach the retailer, then they will never be given the opportunity on that particular<br />
shopping attempt to make a decision, to complete a transaction, or to possess the desired product<br />
from the retailer.<br />
Consumer decision-making is significantly influenced by both the speed and ease with<br />
which consumers can make contact with retail outlets. Traditional retailers may improve access<br />
convenience by operating from a location that is easy to get to, near to most consumers, and near to<br />
other frequently visited stores (Seiders, Berry, and Gresham 2000). Online retailers are particularly<br />
suited for access convenience, as it provides the opportunity for consumers to shop at home 24 hr/7<br />
days a week (Hofacker 2001). Morganosky and Cude (2000) found that the main reason consumers<br />
choose to purchase groceries online is that it eliminates travel time to and from the store.<br />
Although it is an important aspect of retail convenience, providing access convenience alone<br />
will not necessarily lead to sales. A virtual or physical store may be easy to access, but at the same<br />
time slow or difficult to use (Seiders, Berry, and Gresham 2000). In order to facilitate the decision-<br />
making process, the retailer must also provide the information necessary for the consumer to make<br />
the best purchase decision.<br />
Search convenience. After access convenience reduces the time and effort necessary to<br />
reach a retailer, search convenience then eases consumers through the shopping process by helping<br />
31
them make their purchase decision. Search convenience is “the speed and ease with which<br />
consumers identify and select products they wish to buy” (Seiders, Berry, and Gresham 2000, p.<br />
83), and includes effective interactive customer systems, store design and layout, product displays,<br />
store signage, and knowledgeable salespeople.<br />
Search convenience is extremely important for retailers operating virtual stores. One of the<br />
greatest consumer benefits of shopping online is the advanced search capability and the ease with<br />
which consumers can locate product information (Hof 2001; Shop.org 2001; Burke 2002).<br />
Wolfinbarger and Gilly (2001, p. 35) support this by stating that the “the online medium facilitates<br />
utilitarian behavior as search costs for product information are dramatically reduced.” Thus,<br />
shopping on the Internet facilitates search convenience.<br />
Possession convenience. Seiders, Berry, and Gresham (2000, p. 85) define possession<br />
convenience as “the speed and ease with which consumers can obtain desired products.” Included<br />
within the domain of possession convenience are in-stock merchandise, timely production, and<br />
timely delivery of merchandise. One of the main reasons why consumers choose traditional stores<br />
over virtual stores is the ability to actually leave the store with the desired product. Online shoppers<br />
must wait for their order to be processed and then wait for delivery to their home or office. For<br />
consumers shopping online, low possession convenience may be seen as a cost rather than a benefit.<br />
Transaction convenience. Transaction convenience is defined as “the speed and ease with<br />
which consumers can effect or amend transactions” (Seiders, Berry, and Gresham 2000, p. 86) and<br />
includes the checkout process as well as the return process. Hence, transaction convenience<br />
addresses the ease of doing business with a retailer during and/or after the act of purchase. One<br />
benefit of online shopping is that consumers never have to wait in line at virtual stores, thus<br />
enhancing transaction convenience (Wolfinbarger and Gilly 2001). Traditional stores as well as<br />
virtual stores with quick checkouts and easy return policies also rank high in transaction<br />
convenience.<br />
32
The four dimensions of retail convenience share a common element - they each save the<br />
consumer time and effort in a unique way. Whether shopping online or in a physical store,<br />
consumers seek these various convenience dimensions to reduce time and effort costs associated<br />
with consumer decision-making. The next section addresses the different models of retail<br />
convenience for each shopping format.<br />
A Model of Retail Convenience for In-Store and Online Shoppers<br />
Consumers often cite convenience as a major benefit of shopping online (Szymanski and Hise<br />
2000; Hoffman 2000; Childers, Carr, Peck, and Carson 2001; Wolfinbarger and Gilly 2001). We<br />
argue that a consumer’s preference for a specific type of convenience influences his or her<br />
preference for a particular shopping format - either online or at a traditional store. Figure 1 contains<br />
the hypothesized models to be tested in this study.<br />
--------------------------------<br />
Figure 1 about here<br />
--------------------------------<br />
As the dimensions of convenience have only begun to be examined empirically, the first<br />
hypothesis relates to the different structures of retail convenience for in-store and online shoppers.<br />
We concur with Seiders, Berry, and Gresham (2000) that there exists four distinct dimensions of<br />
retail convenience. For traditional in-store shoppers, we feel an additional dimension of<br />
convenience should be considered. Hoffman (2000) found that in-store shoppers consider it<br />
convenient to ask for and receive assistance from a salesperson in making a purchase, especially if<br />
the consumer lacks the necessary information to complete the purchase himself. Particularly for<br />
purchases that require extensive problem solving, if the consumer lacks the necessary information,<br />
he will seek that information from expert problem solvers like knowledgeable salespeople (Dunn,<br />
Thomas, and Lubawski 1981; Hoffman 2000). Thus, “assisted search,” defined as the speed and<br />
ease with which consumers identify and select products they wish to buy due to assistance from a<br />
salesperson, is an additional convenience dimension applicable to traditional retailers. It is not<br />
33
appropriate, however, to consider search features on a retailer’s website as assistance in the same<br />
manner in which it takes place at a physical store. It is the knowledge, training, and advice from a<br />
human salesperson that may provide convenience in a way that a virtual store cannot. Thus, the<br />
following is hypothesized:<br />
H1a: For traditional in-store shoppers, retail convenience is a multidimensional<br />
construct containing five distinct dimensions: access, search, assisted search,<br />
transaction, and possession.<br />
H1b: For online shoppers, retail convenience is a multidimensional construct<br />
containing four distinct dimensions: access, search, transaction, and possession.<br />
In addition to testing the multidimensional nature of retail convenience, we also hypothesize<br />
about the relationship of these dimensions to in-store and online shoppers. As previously stated, the<br />
dimension of access convenience is defined as “the speed and ease with which consumers can reach<br />
a retailer” (Seiders, Berry, and Gresham 2000, p. 81). Consumers who frequently shop at online<br />
retail stores do so because they can shop from the comfort of their homes and at any time of the day<br />
or night. The ability to reach the retailer at a time most convenient to the consumer (access<br />
convenience) is certainly a benefit of online shopping. Compared to shopping at traditional<br />
locations, shopping online saves the consumer travel time to the location, time spent parking, and<br />
time spent traveling from the parking lot to the store (Bhatnagar, Misra, and Rao 2000). With<br />
traditional locations, however, customers are required to adjust their preferred shopping time to fit<br />
within the retailer’s hours of operation.<br />
The concept of cost-benefit analysis (Prest and Turvey 1965) may be used to explain why<br />
consumers who shop online benefit most from access convenience. Online shoppers believe that<br />
the benefit of time saved by being able to access retail outlets from the comfort of their home or<br />
office at anytime of the day or night far outweighs the costs of delayed merchandise possession and<br />
the risks associated with shopping online (Wolfinbarger and Gilly 2001; Morganosky and Cude<br />
34
2000). In-store shoppers receive the benefit of immediate possession of their purchases at the<br />
sacrifice of convenient store access. Formally stated:<br />
H2: Online shoppers realize the benefit of access convenience more than traditional<br />
in-store shoppers do.<br />
Consumers who <strong>value</strong> search convenience do so because of reduced time spent looking for a<br />
particular product and finalizing their product decision. Online shoppers are more likely to realize<br />
the benefit of search convenience than in-store shoppers, simply because they are able to compare<br />
product and pricing information without having to leave home. Benefits falling within the<br />
dimension of search convenience include site design (Szymanski and Hise 2000), navigation<br />
(Childers, Carr, Peck, and Carson 2001), and selection and availability of product information<br />
(Wolfinbarger and Gilly 2001). Many consumers who choose to shop online do so because of the<br />
organization and design of the website and the ease of navigation. E-tailers having a user-friendly<br />
site design facilitate search convenience as consumers arriving at such a site can easily find exactly<br />
what they are looking for. Also considered in the dimension of search convenience is the product<br />
selection offered by the retailer. A virtual retailer is not limited by shelf space like a traditional<br />
retailer; therefore, they are usually able to offer a wider selection of products. The ease and speed<br />
with which the consumer can find exactly what he or she wants is key. The final benefit classified<br />
under search convenience is the availability of product information. How much information is<br />
available directly from the e-tailer’s virtual store? Do they supply comparisons to similar products<br />
offered by competing e-tailers? This is also important as many consumers turn to the Internet<br />
specifically for their information search. To conduct as extensive a search via traditional retailers<br />
would consume considerable amounts of time and effort. This leads to hypothesis 3:<br />
H3: Online shoppers realize the benefit of search convenience more than traditional<br />
in-store shoppers do.<br />
Customers seeking possession convenience prefer to save the time associated with actually<br />
obtaining the desired product (Seiders, Berry, and Gresham 2000). These consumers would rather<br />
35
spend time on other aspects of their shopping experience (e.g., getting to the store’s location and<br />
physically moving through the store to find exactly what they want) in exchange for not having to<br />
wait on parcel delivery to have their desired purchase in their possession. Applying cost-benefit<br />
analysis to this situation (Prest and Turvey 1965), consumers valuing possession convenience prefer<br />
to shop at traditional brick-and-mortar stores because the benefit of having the desired product in<br />
their hands at the end of the shopping trip outweighs the costs associated with traveling to the<br />
physical location and physically searching through the store’s shelves to find exactly what they<br />
want. In other words, they do not mind putting in extra shopping time as long as the desired<br />
product is in their possession immediately as a result of the shopping trip. Hypothesis 4 states the<br />
following:<br />
Construct Measurement<br />
H4: Traditional in-store shoppers realize the benefit of possession convenience<br />
more than online shoppers do.<br />
Research Method<br />
In order to measure the different dimensions of convenience, appropriate scale development<br />
procedures were followed (Churchill 1979; DeVellis 1991; Spector 1992). An initial survey<br />
containing several open-ended questions was administered to 196 students enrolled in upper-level<br />
marketing courses at a major Southeastern university. Questions such as “Please describe below<br />
what the word ‘convenience’ means to you” and “Describe as specifically as possible what your<br />
ideal convenient shopping experience would be like” were asked in order to develop the most<br />
appropriate phrases to capture each dimension of retail convenience. Many items were developed<br />
for each dimension, then 14 expert judges were asked to select the items that most closely matched<br />
the definitions of each dimension. A pretest was then conducted in order to improve/clarify<br />
question wording and instructions. These pretest surveys were given to a sample of seventy-five<br />
upper-level undergraduate marketing students to determine the necessary modifications. This<br />
36
process resulted in slightly different item wordings for in-store and online shoppers. Table 2<br />
contains the final set of items for each convenience dimension.<br />
Sampling Procedure<br />
--------------------------------<br />
Table 2 about here<br />
--------------------------------<br />
The final survey version was administered to a convenience sample consisting of both<br />
students and non-students. Marketing students enrolled in upper-level undergraduate consumer<br />
behavior courses participated as both respondents and recruiters. Each student was asked to<br />
complete the survey and to recruit one other non-student to also complete the survey. Non-student<br />
names and phone numbers were collected and randomly checked to ensure authenticity. This<br />
process resulted in 308 total usable surveys (45% male, mean age 30); 241 completed their last<br />
major purchase in a traditional store, while 67 completed their last major purchase online.<br />
When answering the questions related to retail convenience, respondents were asked to think<br />
about their most recent major purchase. This was done to increase the chance that respondents<br />
would remember their purchase in as much detail as possible. Those respondents who made their<br />
most recent major purchase in a traditional store were directed to the scale items for in-store<br />
shopping, while those respondents who completed their most recent major purchase online were<br />
directed to the “online shopping” section of the survey.<br />
Statistical Technique<br />
Several statistical techniques were used to analyze the data. In order to test Hypothesis 1,<br />
statistics typically used in scale development were employed, including Cronbach’s alpha, principal<br />
components analysis, and confirmatory factor analysis using LISREL 8.3 for Windows. In order to<br />
test Hypotheses 2 through 4, analysis of variance was used to compare scale means of access,<br />
search, and possession convenience for in-store and online shoppers.<br />
37
Results<br />
In order to test Hypothesis 1, statistical procedures commonly used in scale development<br />
were employed. Reliabilities for each dimension of retail convenience were calculated using<br />
Cronbach’s alpha. Principal components analysis with varimax rotation was also undertaken in<br />
order to determine if five distinct dimensions were present for in-store shoppers, and four distinct<br />
dimensions were present for online shoppers. A more stringent confirmatory factor analysis using<br />
LISREL 8.3 for Windows was also undertaken in order to assess convergent and discriminant<br />
validity. Results for in-store shoppers are presented in Table 3, while results for online shoppers<br />
are presented in Table 4. Correlation matrices, means, and standard deviations of the scale items<br />
are provided for in-store shoppers in Table 5 and online shoppers in Table 6.<br />
--------------------------------<br />
Table 3 about here<br />
--------------------------------<br />
--------------------------------<br />
Table 4 about here<br />
--------------------------------<br />
--------------------------------<br />
Table 5 about here<br />
--------------------------------<br />
--------------------------------<br />
Table 6 about here<br />
--------------------------------<br />
Since all of the items within each dimension of retail convenience are reflective of their<br />
appropriate definitions, Cronbach’s alpha was used in order to examine the reliability of each<br />
dimension. As can be seen in the tables, these reliabilities were quite high, ranging from 0.7649 to<br />
0.9722. The dimensions of online retail convenience performed particularly well, as all were above<br />
the 0.9 level.<br />
For in-store shoppers, five dimensions of retail convenience were hypothesized to exist,<br />
while four dimensions of online retail convenience were hypothesized. In order to more carefully<br />
38
examine the dimensionality of these constructs, principal components analysis with varimax<br />
rotation was undertaken for each group separately. For in-store shoppers, five components with<br />
eigen<strong>value</strong>s greater than one were extracted from the data. Together, these five components explain<br />
77.9% of the total variance. For online shoppers, four components with eigen<strong>value</strong>s greater than<br />
one were extracted; together, they explain 84.4% of the total variance. Thus, there is strong<br />
evidence in support of Hypothesis 1; the dimensionality of retail convenience is different for the<br />
two different types of shopping formats. Evidence of discriminant validity is provided by the fact<br />
that these items did not want to load on other components with which they were not supposed to be<br />
associated. Further, evidence of convergent validity is provided by the high loadings of each item<br />
on their respective component.<br />
A more rigorous examination of the validity of these scales was conducted with<br />
confirmatory factor analysis using LISREL 8.3 for Windows. As can be seen in Tables 3 and 4, the<br />
statistically significant λ x parameter estimates provide evidence of convergent validity.<br />
Additionally, the majority of the squared multiple correlations (SMCs), defined as the percentage of<br />
variance in each item that is explained by the latent construct of interest, are above 50%, indicating<br />
that each item performed well in capturing its construct of interest.<br />
Modification indices associated with λ x and Θ δ reveal some problems with discriminant<br />
validity. Specifically, there were seven modification indices in the λ x matrix for in-store shoppers,<br />
indicating that items search2, help3, possess1, and possess2 wanted to be associated with other<br />
dimensions of convenience. Additionally, there were 13 modification indices in Θ δ that indicate<br />
some error terms wanted to correlate. These changes were not incorporated in the model, as<br />
theoretically it does not make sense to do so. These problematic modification indices explain the<br />
poor overall fit: chi-square=498.08, 198 df, p=0.00; RMSEA=0.08; RMR=0.06; GFI=0.85.<br />
Problematic modification indices also surfaced in the measurement model for online<br />
shoppers. Three items (access2, possess2, and possess4) wanted to be associated with other<br />
39
constructs, while 6 error terms wanted to correlate. Again, these changes were not implemented,<br />
resulting in poor overall model fit: chi-square=206.34, 97 df, p=0.00; RMSEA=0.13; RMR=0.09;<br />
GFI=0.71. The overall fit does substantially improve if paths are freed as suggested by the<br />
modification indices. Therefore, confirmatory factor analysis results are mixed; there is strong<br />
evidence of reliability and convergent validity, but discriminant validity must be improved in<br />
further scale refinement attempts.<br />
For Hypotheses 2 through 4, analysis of variance (ANOVA) was performed in order to<br />
compare the mean scale scores for online and in-store shoppers. Hypothesis 2 states that online<br />
shoppers benefit more from access convenience than in-store shoppers. A comparison of scale<br />
means for these two groups yields an F statistic of 37.59 (p=0.000). Access convenience is more<br />
beneficial for online shoppers (scale mean=6.55) than in-store shoppers (scale mean=5.65),<br />
providing evidence of support for H2. Hypothesis 3 states that online shoppers benefit more from<br />
search convenience than do in-store shoppers; ANOVA here produces an F statistic of 8.57<br />
(p=0.004). The scale mean of 5.88 for in-store shoppers is significantly less than the scale mean of<br />
6.26 for online shoppers; thus, there is evidence of support for H3. Finally, hypothesis 4 predicts<br />
that in-store shoppers benefit from possession convenience more than online shoppers. The F<br />
statistic from this ANOVA is significant (F=11.07, p=0.001); however, the scale means indicate<br />
that the reverse is true. The possession scale mean for in-store shoppers is 5.60, while the scale<br />
mean for online shoppers is 6.23. This finding is quite counter-intuitive; possible reasons for this<br />
result are provided in the next section.<br />
Discussion<br />
This study provides an important contribution to the marketing convenience literature<br />
because it is the first of its kind to utilize the different dimensions of retail convenience to better<br />
understand customer needs. The support for Hypothesis 1 suggests that the dimensions of<br />
convenience are different for the two different types of shopping formats. The expansion of<br />
40
Seiders, Berry, and Gresham’s (2000) four dimensions of retail convenience to include “assisted<br />
search” is warranted. The five-component solution resulting from the principal components<br />
analysis is evidence of the existence of this newly proposed dimension. Further work in this area<br />
should seek to establish a similar convenience dimension for online shoppers. Technological<br />
capabilities that allow customers to experience “live help” or to receive recommendations based on<br />
what he has in his shopping bag may be considered a different type of “assisted help” than what is<br />
provided in a traditional store. It may be difficult, however, to obtain a large enough sample of<br />
online shoppers who regularly use these convenience-oriented features.<br />
The scale items crafted to measure the different dimensions of retail convenience possess<br />
high reliability levels and strong evidence of convergent validity as shown by Cronbach’s alpha and<br />
statistically significant λ x parameter estimates respectively. A more stringent confirmatory factor<br />
analysis using structural equation modeling reveals problems with discriminant validity, as<br />
evidenced by large λ x and Θ δ modification indices. Some scale items want to be associated with<br />
constructs that they are not supposed to be associated with. In addition, some error terms want to<br />
correlate with other error terms. This means that insufficient evidence exists to suggest that the<br />
dimensions of retail convenience are in fact different dimensions. Further studies must be<br />
undertaken to ensure that the dimensions of access, search, assisted search, transaction, and<br />
possession convenience are all distinct dimensions of convenience.<br />
The support of Hypothesis 2 suggests that online shoppers do benefit from access<br />
convenience more than traditional in-store shoppers do. One implication of this finding is that<br />
when given a choice between the two retail formats (online shopping or traditional in-store<br />
shopping) customers who <strong>value</strong> access convenience above all other types of convenience will often<br />
choose to shop online. Hypothesis 3 (that online shoppers benefit from search convenience more<br />
than traditional in-store shoppers) is also supported. When given a choice between the two retail<br />
41
formats, customers who <strong>value</strong> search convenience above all other types of convenience will also<br />
choose to shop online.<br />
From a marketing standpoint, the results of Hypothesis 2 and 3 suggest that retailers should<br />
try to better understand their customers; specifically, they should try to find out what type of<br />
convenience their customers want. It is possible that customers may <strong>value</strong> multiple convenience<br />
dimensions. For example, a customer may <strong>value</strong> both search convenience and possession<br />
convenience. One way to better satisfy this customer is to offer multiple channel outlets (maintain<br />
both a traditional brick-and-mortar store and an online store). By having multiple channel outlets,<br />
the retailer facilitates both search convenience and possession convenience. In other words, the<br />
customer can use the online store for his information search, then go to the traditional store and<br />
leave with his desired purchase. Offering multiple channels to reach customers offers ultimate<br />
convenience.<br />
Upon further review of hypothesis 4, the seemingly counter-intuitive results can be easily<br />
explained. It is true that online shoppers must wait longer for their purchases than in-store<br />
shoppers. But a post hoc examination of the item wordings that measured possession convenience<br />
for online shoppers reveals that this wait was not adequately captured. Instead, we asked if the<br />
order was delivered in a timely fashion. This captures <strong>satisfaction</strong> with possession, rather than how<br />
conveniently the possession actually took place. In subsequent scale refinement attempts,<br />
possession convenience might be captured more precisely if an objective measure was used.<br />
Suppose the question was worded, “How long did it take for you to receive the product(s) you<br />
ordered?” An in-store shopper would answer “zero” (the most convenient possession), and the<br />
longer one had to wait for his online order, the less convenient his possession would be.<br />
Conclusion<br />
This study is an initial attempt to delineate the different retail convenience dimensions for<br />
in-store and online shoppers. Several limitations must be mentioned. A convenience sample was<br />
42
used, and the respondents were all concentrated in one geographical area. Additionally, we<br />
obtained a small sample size of online shoppers. Scale refinement will greatly benefit from a<br />
national sample with equally large numbers of in-store and online shoppers.<br />
As mentioned above, future research should aim to establish discriminant validity of the<br />
convenience scales. Additional comparisons of in-store and online shoppers are also warranted.<br />
Future studies should investigate the time and effort expenditures for these two groups as well as<br />
examine possible antecedents to convenience-seeking behaviors. Constructs such as time pressure<br />
and shopping orientation may lead consumers to seek different types of convenience. Retailers<br />
would greatly benefit from such an understanding of their customers’ needs and motivations.<br />
43
References<br />
Anderson Jr. WT. Convenience orientation and consumption behavior. Journal of Retailing<br />
1972;48(3):49-72.<br />
Berry LL. The time-buying consumer. Journal of Retailing 1979;55(4):58-69.<br />
Berry LL, Seiders K, Grewal D. Understanding service convenience. Journal of Marketing<br />
2002;66(3):1-17.<br />
Berry LL. The old pillars of new retailing. Harvard Business Review 2001;79(4):131-137.<br />
Bettman JR, Johnson EJ, Payne JW. A componential analysis of cognitive effort in choice.<br />
Organizational Behavior and Human Decision Processes 1990;45(February):111-139.<br />
Bhatnagar A, Misra S, Rao HR. On risk, convenience, and Internet shopping behavior.<br />
Communications of the ACM 2000;43(11):98-110.<br />
Brown LG. The strategic and tactical implications of convenience in consumer product marketing.<br />
Journal of Consumer Marketing 1989;6(3):13-19.<br />
Brown LG. Convenience in services marketing. Journal of Services Marketing 1990;4(1):53-59.<br />
Bucklin LP. Retail strategy and the classification of consumer goods. Journal of Marketing<br />
1963;27(1):50-55.<br />
Burke RR. Technology and the customer interface: what consumers want in the physical and<br />
virtual store. Journal of the Academy of Marketing Science 2002;30(4):411-432.<br />
Childers T L, Carr CL, Peck J, Carson S. Hedonic and utilitarian motivations for online retail<br />
shopping behavior. Journal of Retailing 2001;77(4):511-535.<br />
Churchill GA. A paradigm for developing better measures of marketing constructs. Journal of<br />
Marketing Research 1979;16(1):64-73.<br />
Copeland MT. Relation of consumers’ buying habits to marketing methods. Harvard Business<br />
Review 1923;1(3):282-289.<br />
Crist B. Myths about convenience food costs. Journal of Marketing 1960;24(4):49-55.<br />
Darian JC, Cohen J. Segmenting by consumer time shortage. Journal of Consumer Marketing<br />
1995;12(1):32-44.<br />
DeVellis RF. Scale development: theory and applications (Applied Social Research Methods<br />
Series, Vol. 26). Newbury Park: Sage Publications, 1991.<br />
Dunn DT, Thomas CA, Lubawski JL. Pitfalls of consultative selling. Business Horizons<br />
1981;24(5):59-65.<br />
44
Enis BM, Roering KJ. Product classification taxonomies: synthesis and consumer implications. In:<br />
Theoretical developments in marketing. Chicago: American Marketing Association, 1980.<br />
p. 186-189.<br />
Etgar, M. The household as a production unit. In: Sheth JN, editor. Research in marketing, vol. 1.<br />
Greenwich, CT: JAI Press, 1978. p. 79-98.<br />
Foote NN. The Image of the Consumer in the Year 2000. Proceedings, Thirty-fifth Annual Boston<br />
Conference on Distribution 1963, 13-18.<br />
Forster J. Hungry for convenience. Business Week (1/14/2002); Issue 3765: 120.<br />
Gardner EH. Consumer goods classification. Journal of Marketing 1945;9(3):275-276.<br />
Green H. Happy holidays – for e-tailers, at least. Business Week (11/11/02); Issue 3807:44-45.<br />
Gross BL. Time scarcity: interdisciplinary perspectives and implications for consumer behavior.<br />
In: Sheth JN, Hirschman EC, editors. Research in consumer behavior. Greenwich, CT: JAI<br />
Press, 1987. p. 1-54.<br />
Hof RD. Don’t cut back now. Business Week (10/1/2001); Issue 3751:EB34.<br />
Hofacker CF. Internet Marketing, 3 rd ed. New York: John Wiley & Sons, Inc., 2001.<br />
Hoffman NP. May I help you?: customer intimacy versus customer empowerment in a retail context.<br />
Presented at the Third Annual Retail Strategy and Consumer Decision Research Seminar 2000,<br />
Orlando, FL, November.<br />
Holbrook MB, Howard JA. Frequently purchased nondurable goods and services. In: Ferber R,<br />
editor. Selected aspects of consumer behavior: a summary from the perspective of different<br />
disciplines. Washington D.C.: National Science Foundation, Directorate for Research<br />
Applications, Research Applied to National Needs, 1977. p. 189-222.<br />
Jacoby J, Szybillo GJ, Berning CK. Time and consumer behavior: an interdisciplinary overview.<br />
Journal of Consumer Research 1976;2(4):320-339.<br />
Kaish S. Cognitive dissonance and the classification of consumer goods. Journal of Marketing<br />
1967;31(4):28-31.<br />
Kaufman-Scarborough C. , Lindquist JD. E-shopping in a multiple channel environment. Journal<br />
of Consumer Marketing 2002; 19(4):333-350.<br />
Kelley EJ. The importance of convenience in consumer purchasing. Journal of Marketing<br />
1958;23(1):32-38.<br />
45
Kotler P, Zaltman G. Social marketing: an approach to planned social change. Journal of<br />
Marketing 1971;35(3):3-12.<br />
Lovelock CH. Classifying services to gain strategic marketing insights. Journal of Marketing<br />
1983;47(3):9-20.<br />
Morganosky MA, Cude BF. Consumer response to online grocery shopping. International Journal<br />
of Retail and Distribution Management 2000;28(1):17-26.<br />
Murphy PE, Enis BM. Classifying products strategically. Journal of Marketing 1986;50(3):24-42.<br />
Prest AR, Turvey R. Cost-benefit analysis: a survey. Economic Journal 1965;75(300):683-735.<br />
Reilly MD. Working wives and convenience consumption. Journal of Consumer Research<br />
1982;8(4):407-418.<br />
Seiders K, Berry LL, Gresham LG. Attention, retailers! How convenient is your convenience<br />
strategy? Sloan Management Review 2000;41(3):79-89.<br />
Seiders K, Voss GB, Grewal D, Godfrey AL. Customer evaluation of service convenience: an<br />
empirical investigation. Proceedings, American Marketing Association Winter Educators’<br />
Conference, (Winter 2003), 163-164.<br />
Shop.org. The multi-channel retail report 2001. Washington D.C.: National Retail Federation,<br />
2001.<br />
Spector, PE. Summated Rating Scale Construction: An Introduction. Newbury Park: Sage<br />
Publications, 1992.<br />
Szymanski DM, Hise RT. E-<strong>satisfaction</strong>: an initial examination. Journal of Retailing<br />
2000;76(3):309-322.<br />
Wolfinbarger M, Gilly MC. Shopping online for freedom, control, and fun. California<br />
Management Review 2001;43(2):34-55.<br />
Youngdahl WE, Kellog DL. The relationship between service customers’ quality assurance<br />
behaviors, <strong>satisfaction</strong>, and effort: a cost of quality perspective. Journal of Operations<br />
Management 1997;15(1):19-32.<br />
46
Table 1<br />
Dimensions of Convenience<br />
General Convenience Definition<br />
(Brown 1989, 1990)<br />
1. Time Products/services may be provided at a time that is most<br />
convenient for the customer<br />
2. Place Products/services may be provided in a place that is more<br />
convenient for the customer<br />
3. Acquisition Firms may make it easier for the customer, financially and<br />
otherwise, to purchase their products/services<br />
4. Use Products/services may be made more convenient for the<br />
customer to use<br />
5. Execution Perhaps the most obvious convenience is simply having some<br />
one else provide the product/service for the consumer<br />
Service Convenience (Berry,<br />
Seiders, and Grewal 2002)<br />
1. Access convenience Involves consumers’ perceived time and effort expenditures to<br />
initiate service delivery<br />
2. Decision convenience Involves consumers’ perceived time and effort expenditures to<br />
make service purchase or use decisions<br />
3. Transaction convenience Involves consumers’ perceived expenditures of time and effort<br />
to effect a transaction<br />
4. Benefit convenience Involves consumers’ perceived time and effort expenditures to<br />
experience the service’s core benefits<br />
5. Post-benefit convenience Involves consumers’ perceived time and effort expenditures<br />
when reinitiating contact with a firm after the benefit stage of<br />
the service<br />
Retail Convenience (Seiders,<br />
Berry, and Gresham 2000)<br />
1. Access convenience The speed and ease with which consumers can reach a retailer<br />
2. Search convenience The speed and ease with which consumers can identify and<br />
select products they wish to buy<br />
3. Transaction convenience The speed and ease with which consumers can effect or amend<br />
transactions<br />
4. Possession convenience The speed and ease with which consumers can obtain desired<br />
products<br />
47
Dimension Items for In-Store Shoppers 1<br />
Table 2<br />
Scale Items Measuring Retail Convenience<br />
Items for Online Shoppers 1<br />
Access 1. The store was easy to get to. 1. The website was easy to find.<br />
2. The store had convenient hours. 2. I could order any time I wanted.<br />
3. Parking was reasonably available. 3. I could order from remote locations<br />
4. I was able to get to the store’s location<br />
quickly.<br />
(e.g., home, work, etc.)<br />
4. I was able to find the website quickly.<br />
Search 1. The store was well-organized. 1. The website was well-organized.<br />
2. I could easily find what I was looking 2. It was easy to find what I was looking<br />
for.<br />
for.<br />
3. The store was neat. 3. It was easy to navigate the website.<br />
4. The store was clean. 4. The website provided useful<br />
information.<br />
5. It was easy to get the information I<br />
needed to make my purchase decision.<br />
Help with Search 1. A salesperson was readily available to<br />
help me.<br />
2. The salesperson offered good advice.<br />
3. The salesperson helped me find exactly<br />
what I was looking for.<br />
4. The salesperson was knowledgeable.<br />
5. The salesperson gave me useful<br />
information.<br />
6. I thought the salesperson was welltrained.<br />
Transaction 1. The store has a fast checkout. 1. The checkout process was fast.<br />
2. My purchase was completed easily. 2. My purchase was completed easily.<br />
3. I was able to complete my purchase 3. It didn’t take a long time to complete<br />
quickly.<br />
4. I didn’t have to wait to pay.<br />
5. It didn’t take a long time to complete<br />
the purchase process.<br />
the purchase process.<br />
Possession 1. I got exactly what I wanted. 1. I got exactly what I wanted.<br />
2. It took a minimal amount of effort on 2. It took a minimal amount of effort on<br />
my part to get what I wanted.<br />
my part to get what I wanted.<br />
3. I got what I wanted when I wanted it. 3. My order was delivered in a timely<br />
fashion.<br />
4. I was properly notified of my order<br />
status.<br />
1All items were measured on a 7-point scale anchored by Strongly Agree and Strongly Disagree.<br />
48
Table 3<br />
Retail Convenience Scale Results for In-Store Shoppers<br />
Dimensio<br />
n<br />
Alpha Component CFA Results<br />
1 2 3 4 5 λx estimate t-<strong>value</strong> SMC<br />
Access1 0.7759 0.87<br />
7<br />
0.89 16.56 0.80<br />
Access2 .077<br />
1<br />
0.73 12.48 0.53<br />
Access3 .063<br />
1<br />
0.57 9.26 0.33<br />
Access4 0.85<br />
7<br />
0.79 13.95 0.62<br />
Search1 0.8860 0.72<br />
6<br />
Search2 0.62<br />
2<br />
Search3 0.85<br />
8<br />
Search4 0.82<br />
6<br />
Help1 0.9503 0.77<br />
3<br />
Help2 0.88<br />
1<br />
Help3 0.79<br />
9<br />
Help4 0.92<br />
3<br />
Help5 0.90<br />
5<br />
Help6 0.87<br />
1<br />
Transact1 0.9609 0.88<br />
5<br />
Transact2 0.88<br />
7<br />
Transact3 0.92<br />
1<br />
Transact4 0.87<br />
0<br />
Transact5 0.92<br />
3<br />
0.84 15.27 0.71<br />
0.76 13.28 0.58<br />
0.78 13.62 0.61<br />
0.73 12.43 0.53<br />
0.75 13.74 0.56<br />
0.90 18.15 0.81<br />
0.84 16.26 0.71<br />
0.94 19.71 0.89<br />
0.94 19.45 0.88<br />
0.88 17.33 0.77<br />
0.87 17.24 0.76<br />
0.95 20.05 0.90<br />
0.98 21.07 0.95<br />
0.84 16.27 0.70<br />
0.95 20.19 .091<br />
Possess1 0.7649 0.761 0.76 12.39 0.57<br />
Possess2 0.663 0.67 10.74 0.45<br />
Possess3 0.778 0.72 11.63 0.52<br />
n=241<br />
49
Dimensio<br />
n<br />
Table 4<br />
Retail Convenience Scale Results for Online Shoppers<br />
Alpha Component CFA Results<br />
1 2 3 4 λx estimate t-<strong>value</strong> SMC<br />
Access1 0.9298 0.866 0.86 8.26 0.73<br />
Access2 0.735 0.81 7.65 0.66<br />
Access3 0.852 0.93 9.59 0.87<br />
Access4 0.903 0.92 9.34 0.85<br />
Search1 0.9033 0.537 0.86 8.31 0.75<br />
Search2 0.508 0.87 8.46 0.76<br />
Search3 0.738 0.88 8.65 0.78<br />
Search4 0.866 0.66 5.61 0.43<br />
Search5 0.850 0.65 5.55 0.42<br />
Transact1 0.9722 0.921 0.96 10.22 0.93<br />
Transact2 0.914 0.97 10.35 0.94<br />
Transact3 0.918 0.95 10.04 0.91<br />
Possess1 0.9110 0.800 0.85 8.12 0.73<br />
Possess2 0.669 0.83 7.80 0.69<br />
Possess3 0.845 0.87 8.45 0.76<br />
Possess4 0.897 0.84 7.98 0.71<br />
n=67<br />
50
Table 5<br />
Correlations, Means, and Standard Deviations of Scale Items for In-store Shoppers<br />
Item A1 A2 A3 A4 S1 S2 S3 S4 H1 H2 H3 H4 H5 H6 T1 T2 T3 T4 T5 P1 P2 P3<br />
Acc1 1<br />
Acc2 .63 1<br />
Acc3 .49 .50 1<br />
Acc4 .73 .54 .40 1<br />
Sear1 .37 .41 .40 .31 1<br />
Sear2 .26 .29 .25 .21 .63 1<br />
Sear3 .23 .32 .30 .16 .67 .60 1<br />
Sear4 .27 .35 .34 .21 .63 .53 .80 1<br />
Help1 .20 .12 .10 .18 .38 .38 .38 .33 1<br />
Help2 .17 .14 .06 .10 .39 .41 .39 .35 .70 1<br />
Help3 .18 .17 .12 .11 .41 .48 .42 .37 .68 .81 1<br />
Help4 .19 .17 .07 .10 .40 .38 .38 .38 .70 .83 .78 1<br />
Help5 .18 .15 .07 .08 .35 .36 .39 .37 .66 .85 .75 .90 1<br />
Help6 .15 .11 .06 .14 .36 .40 .41 .38 .69 .76 .72 .84 .82 1<br />
Tran1 .21 .28 .23 .12 .37 .33 .22 .31 .25 .31 .35 .27 .26 .22 1<br />
Tran2 .21 .24 .22 .13 .33 .43 .33 .34 .29 .34 .42 .31 .29 .32 .83 1<br />
Tran3 .18 .22 .23 .11 .32 .42 .32 .32 .26 .31 .39 .27 .27 .27 .84 .93 1<br />
Tran4 .12 .12 .22 .03 .31 .38 .26 .36 .27 .28 .35 .28 .23 .25 .79 .77 .81 1<br />
Tran5 .18 .20 .17 .10 .29 .41 .30 .29 .26 .32 .39 .28 .25 .25 .83 .90 .93 .82 1<br />
Pos1 .07 .10 .03 .05 .27 .39 .27 .22 .39 .46 .56 .42 .44 .43 .30 .41 .36 .30 .37 1<br />
Pos2 .27 .24 .20 .16 .35 .36 .31 .30 .23 .30 .34 .20 .25 .21 .41 .46 .49 .40 .46 .49 1<br />
Pos3 .21 .25 .16 .13 .35 .42 .32 .33 .33 .29 .39 .24 .30 .30 .32 .39 .37 .29 .32 .57 .47 1<br />
Mean 5.6 5.9 5.8 5.3 5.8 5.8 5.9 6.0 6.0 5.7 5.8 6.0 5.8 5.9 5.1 5.3 5.1 5.2 5.1 6.0 5.0 5.8<br />
SD 1.4 1.2 1.3 1.7 1.1 1.2 1.2 1.0 1.4 1.5 1.5 1.3 1.3 1.3 1.5 1.6 1.6 1.7 1.7 1.3 1.8 1.5<br />
n=241<br />
Table 6<br />
Correlations, Means, and Standard Deviations of Scale Items for Online Shoppers<br />
Item A1 A2 A3 A4 S1 S2 S3 S4 S5 T1 T2 T3 P1 P2 P3 P4<br />
Acc1 1<br />
Acc2 .64 1<br />
Acc3 .77 .79 1<br />
Acc4 .85 .72 .86 1<br />
Sear1 .56 .66 .62 .59 1<br />
Sear2 .51 .67 .67 .55 .76 1<br />
Sear3 .47 .66 .60 .52 .78 .74 1<br />
Sear4 .29 .51 .38 .37 .52 .51 .71 1<br />
Sear5 .29 .46 .33 .28 .48 .59 .67 .77 1<br />
Tran<br />
1<br />
.24 .53 .34 .33 .43 .58 .48 .38 .42 1<br />
Tran<br />
2<br />
.16 .48 .26 .21 .39 .55 .49 .46 .54 .93 1<br />
Tran .15 .42 .27 .22 .37 .50 .48 .43 .50 .92 .93 1<br />
3<br />
Pos1 .44 .45 .46 .42 .62 .65 .50 .30 .42 .54 .47 .43 1<br />
Pos2 .41 .63 .56 .48 .60 .66 .51 .41 .43 .61 .53 .55 .74 1<br />
Pos3 .47 .47 .59 .52 .51 .59 .49 .20 .19 .38 .29 .29 .71 .70 1<br />
Pos4 .41 .35 .51 .43 .53 .48 .41 .19 .16 .31 .24 .24 .72 .65 .81 1<br />
Mean 6.5 6.6 6.5 6.6 6.2 6.3 6.2 6.3 6.3 5.7 5.7 5.6 6.4 5.9 6.2 6.4<br />
SD .89 .70 .80 .82 .91 .98 .91 .85 .88 1.2 1.4 1.3 .80 1.2 1.2 1.1<br />
51
n=67<br />
52
Error!<br />
Figure 1<br />
Retail Convenience for In-Store and Online Shoppers<br />
In-Store Retail<br />
Convenience<br />
Access Search Assisted<br />
Search<br />
Transaction Possession<br />
Online Retail<br />
Convenience<br />
Access Search Transaction Possession<br />
53
A study of the impact of shopping orientation and gender on the <strong>value</strong>-<strong>satisfaction</strong> link during<br />
an electronic catalog visit<br />
Christine Gonzalez, Toulouse Business School<br />
Abstract<br />
This paper studies how shopping orientation – shopping as work vs. shopping as recreation- and<br />
gender modify the links between online shopping <strong>value</strong>s and consumer <strong>satisfaction</strong>. An experience was<br />
conducted in which shopping orientation was manipulated. 417 students visited an electronic catalog with<br />
“shopping as recreation” scenario and another electronic catalog with a “shopping as work” scenario. The<br />
results lend support to the hypothesized moderating effects. Implications for e-marketers as well as<br />
directions for future research are discussed.<br />
Introduction<br />
Consumer <strong>satisfaction</strong> with online retailing has been recently investigated (Szymanski and Hise,<br />
2000; Zeithaml, Parasuraman and Malhotra, 2000; Zeithaml, Parasuraman and Malhotra, 2002). However,<br />
although consumer motives shape consumer responses to the traditional or online shopping environment<br />
(Bloch, Sherrell and Ridgway, 1986; Bloch, Ridgway and Sherrell, 1989; Hoffman and Novak, 1996;<br />
Hammond, McWilliam and Diaz, 1998), few studies consider their role in the online <strong>satisfaction</strong> process. A<br />
traditional or online store experience is evaluated on its ability to produce both hedonic and utilitarian<br />
outcomes (Babin, 1991; Babin, Darden and Griffin, 1994; Griffin, Babin and Modianos, 2000; Babin and<br />
Attaway, 2001; Mathwick, Malhotra and Ridgon, 2001; Senecal, Gharbi and Nantel, 2001). As the Internet<br />
has been depicted as a convenient shopping option (Szymanski and Hise, 2000; Seiders, Berry and Gresham,<br />
2000), it rises the question of the importance of the hedonic outcomes of the online experience in<br />
determining consumer <strong>satisfaction</strong>. Should online retailers focus only on efficiency or on both hedonic and<br />
utilitarian aspects of the shopping experience? How do online shopping <strong>value</strong>s influence consumer<br />
<strong>satisfaction</strong>?<br />
Although consumer situation shape consumer responses to the traditional or online shopping<br />
environment (Bloch, Sherrell and Ridgway, 1986; Bloch, Ridgway and Sherrell, 1989; Hoffman<br />
55
and Novak, 1996; Hammond, McWilliam and Diaz, 1998), few studies consider its role in the<br />
online <strong>satisfaction</strong> process. Product search, information search and recreation are common motives<br />
for surfing on the Internet (Hoffman and Novak, 1996; Hammond, McWilliam and Diaz, 1998).<br />
Purchasing conversion rate is only five per cent on the Internet (Moe and Fader, 2001). However all<br />
visitors-information seekers or recreation seekers- are valuable to an online retailer: as a shopper<br />
makes more visits to a store, he/she feels less anxiety toward buying on the web site (Moe and<br />
Fader, 2001). In addition to shopping motives others dimensions of consumer situation such as time<br />
pressure also influence consumer shopping behaviour and its response to the shopping environment<br />
(Iyer, 1989; Titus and Everett, 1997). Understanding consumer situation while e-shopping is a key<br />
requirement to build online retail patronage: How does consumer situation shape consumer<br />
shopping experience and the <strong>satisfaction</strong> process itself? Based on a synthesis of previous research,<br />
two specific shopping orientations have been defined here: a “shopping as work” orientation (“the<br />
consumer considers the visit ahead more as a job that has to be done and is oriented toward an<br />
efficient experience that accomplishes the job”) and a “shopping as recreation” orientation (“the<br />
consumer considers the visit ahead as being potentially pleasant and expects to gain gratification<br />
from the process itself"). What role do online shopping orientations play in shaping the <strong>satisfaction</strong><br />
process?<br />
Few researchers try to understand how males and females differ in their evaluation of a traditional or<br />
online shopping experience. However, because of socio-demographical changes- such as an increase in<br />
divorce rate in most western countries- or behavioural changes- men in their teens or mid-20s are, for<br />
example, shop more frequently and are beginning to shop in group like teenage girls (Bird, 2002), males are<br />
becoming an important part of the store clientele. At the end of 2002, in the United States, males represented<br />
51% of all internet users (Harris Interactive cited by Journal du Net, 2003) and 40% of Internet shoppers<br />
(BizRate cited by Journal du Net, 2003). It is thus important to understand how they react to an online<br />
56
shopping environment. How do males and females differ in their evaluation of an online shopping<br />
experience?<br />
In order to answer these questions, this article starts with a conceptual discussion of online<br />
shopping <strong>value</strong>s, <strong>satisfaction</strong>, shopping orientation and gender. Literature in consumer behavior<br />
with a focus on shopping behavior is used to understand the relationships between these variables.<br />
The results of an online experiment which validates some of these relationships are then presented.<br />
Finally, implications for theory and practice are addressed.<br />
Online shopping <strong>value</strong>s and consumer <strong>satisfaction</strong> with the electronic catalog visit<br />
Shoppers’ experiences in connection to an online or traditional store can be categorized into<br />
(1) experiences related to being in the store itself and (2) experiences related to consuming the<br />
products and services obtained from the retailer (Westbrook, 1981). Online store <strong>satisfaction</strong> results<br />
from shopping experience <strong>satisfaction</strong>, product delivery <strong>satisfaction</strong>, product <strong>satisfaction</strong> and when<br />
necessary complaining behavior <strong>satisfaction</strong> (Oliver, 1981). This article focuses on the first step of<br />
the process-the electronic catalog visit- and on consumer <strong>satisfaction</strong> with the electronic catalog<br />
visit. Satisfaction has been defined here as “an evaluation of the surprise inherent in a product<br />
acquisition and/or product experience” (Oliver, 1981).<br />
Consumption experiences have been described according to an information processing and<br />
an experiential perceptive (Holbrook and Hirschman, 1982; Hirschman and Holbrook, 1982). The<br />
information processing perspective describes the consumer as “a problem solver engaged in the<br />
goal directed activities of searching for information, retrieving memory cues, weighting evidence,<br />
and arriving at carefully considered judgmental evaluation” (Holbrook and Hirschman, 1982, p<br />
135) while the experiential view describes the consumer as an hedonist engaged in “playful leisure<br />
activities, sensory pleasures, daydreams, esthetic enjoyment, and emotional responses” (Holbrook<br />
57
and Hirschman, 1982, p 132). These two perspectives are complementary rather than contradictory<br />
(Holbrook, 1986; Babin, 1991; Holbrook, 1994; Babin, Darden and Griffin, 1994 Holbrook, 1999).<br />
As a matter of fact, a service or store experience is evaluated on both its hedonic and its utilitarian<br />
outcomes (Babin, 1991; Mano and Elliott, 1993; Babin, Darden and Griffin, 1994; de Ruyter,<br />
Wetzels, Lemmink and Mattsson, 1997; Lemmink, de Ruyter and Wetzels, 1998; Raman and<br />
Leckenby, 1998; Griffin, Babin and Modianos, 2000). In the e-retailing context, <strong>value</strong> is derived<br />
from Web sites that combine an efficient visit and excellent service quality with a fun and playful<br />
experience and an aesthetic shopping environment (Mathwick, Malhotra and Rigdon, 2001).<br />
Past research on patronage behavior made a distinction between shopping hedonic and<br />
utilitarian <strong>value</strong> (Babin, 1991; Mano and Elliott, 1993; Babin, Darden and Griffin, 1994; Griffin,<br />
Babin and Modianos, 2000). Hedonic <strong>value</strong> results from the recreation and pleasure provided by the<br />
shopping experience while utilitarian <strong>value</strong> is realized when the task is completed efficiently<br />
(Babin, Darden and Griffin, 1994; Griffin, Babin and Modianos, 2000). Hedonic and utilitarian<br />
<strong>value</strong>s are antecedents of consumer <strong>satisfaction</strong> with the service or shopping experience (Babin,<br />
Darden and Griffin, 1994; de Ruyter, Wetzels, Lemmink and Mattsson, 1997; Lemmink, de Ruyter<br />
and Wetzels, 1998; Babin and Attaway, 2001).<br />
« Shopping as work » versus « Shopping as Recreation » Orientation<br />
A variety of hedonic and utilitarian motives has been suggested in the retailing literature (Tauber,<br />
1972; Bellenger, Robertson and Greenberg, 1977; Bellenger and Korgaonkar, 1980; Westbrook and Black,<br />
1985; Arnold and Reynolds, 2003). Tauber (1972) identified personal (i.e. role playing, diversion, self-<br />
gratification, learning about new trends, physical activities and sensory stimulation) and social (i.e. social<br />
experiences outside the home, communication with others having a similar interest, peer group attraction,<br />
status and authority, pleasure of bargaining) motives for shopping. Later, Westbrook and Black (1985) added<br />
two more utilitarian motives to these hedonic motives for shopping: anticipated utility and choice<br />
58
optimization. More recently, Arnold and Reynolds (2003) provided a comprehensive inventory of<br />
consumers’ hedonic shopping motivations and have isolated adventure, gratification, role, <strong>value</strong>, social and<br />
idea shopping motivations. Westbrook and Black (1985) summarize these taxonomies of shoppers into three<br />
categories: product oriented motives- to acquire the product for which needs are experienced or to acquire<br />
product information, a combination of product oriented and experiential motives- both to acquire the desired<br />
product and to have a pleasurable recreational experience- and experiential motives- principally to have a<br />
pleasurable recreational experience.<br />
Shopping motives shape the shopping experience (Dawson, Bloch and Ridgway, 1990). For<br />
example, product oriented motives are associated with greater pleasure than arousal while experiential<br />
motives are linked with greater arousal than pleasure. Product oriented motives are a significant predictor of<br />
most dimensions of consumer preference including expectations met, product <strong>satisfaction</strong> and overall<br />
<strong>satisfaction</strong>. Experiential motives significantly predict facility <strong>satisfaction</strong> and overall <strong>satisfaction</strong>. Shopping<br />
motives should also shape consumer behavior online. For example, task completion and prepurchase<br />
deliberation motives should induce utilitarian and instrumental goal directed behavior and recreational<br />
motives should encourage a more ritualistic, transcendental, hedonic behavior (Hoffman and Novak, 1996).<br />
However Hammond, McWilliam and Diaz (1999) - who defined web browsing for general information as<br />
hedonic and web browsing for specific information as utilitarian - did not find relationships between motives<br />
and hedonic and utilitarian attitudes toward the web.<br />
Motives are however only one dimension of consumer situation while visiting the online or<br />
traditional store. As a matter of fact, Belk (1975) postulated that an interaction between an object<br />
and a situation determines consumer internal and behavioral responses. He isolated four dimensions<br />
of consumer situation in addition to motives: physical surroundings, social surroundings, temporal<br />
perspective and antecedent states. According to Lutz and Kakkar (1975; p. 440), “how the actor<br />
perceives the situation is as important as the actual elements found in the physical environment.”<br />
Thus the situation relevant for the understanding of consumer behavior is the psychological<br />
situation defined by Lutz and Kakkar (1975; p. 441) as “an individual’s internal responses to, or<br />
59
interpretations of, all factors particular to a time and place of observation.” Internal responses are<br />
captured by the three emotion dimensions: Pleasure, Arousal and Dominance (PAD) (Mehrabian<br />
and Russell 1974). Additionally, the consumer has expectations about things including efficiency<br />
and recreation that they use to judge a traditional or online shopping experience (Titus and Everett,<br />
1995). As a consequence, the subjective situation is framed by consumer expectations: hedonic<br />
expectations such as recreation, fun or pleasure and utilitarian expectations such as efficiency and<br />
accomplishment.<br />
Based on these researches we contrast a “shopping as work” and a “shopping as recreation”<br />
orientation. In the “shopping as work” orientation (SWO), before visiting the web site, the<br />
consumer does not consider the visit as being potentially gratifying in and of itself and is oriented<br />
more toward efficiency and task completion. In the “shopping as recreation” orientation (SRO),<br />
before visiting the web site, the consumer consider the visit as being potentially gratifying in and of<br />
itself and is oriented more toward recreation.<br />
Objective situation<br />
Subjective situation<br />
Shopping orientation<br />
Physical surroundings<br />
Social surroundings<br />
Temporal perspective<br />
Antecedent states<br />
Motives<br />
Emotional states<br />
Expectations<br />
Figure 1 – Shopping as work vs. Shopping as recreation orientation<br />
Shopping orientation shapes the <strong>satisfaction</strong> process and modifies relationships between the<br />
store environment and the evaluation of the shopping experience. For example, consumer<br />
<strong>satisfaction</strong> with a restaurant depends mainly on utilitarian <strong>value</strong> for a business lunch and mainly on<br />
hedonic <strong>value</strong> for a celebration meal (Lemmink, de Ruyter and Wetzels, 1998). Thus,<br />
60
H1 :<br />
H2 :<br />
The relationship between online shopping hedonic <strong>value</strong> and <strong>satisfaction</strong> will be<br />
stronger for a “shopping as recreation” orientation<br />
The relationship between online shopping utilitarian <strong>value</strong> and <strong>satisfaction</strong> will be<br />
stronger for a “shopping as work” orientation<br />
Hammond, McWilliam and Diaz (1998) posit that consumer motives (browsing vs finding a precise<br />
information) have an impact on the intensity of one's hedonic and utilitarian attitude toward the<br />
web.<br />
H3 :<br />
H4 :<br />
Online shopping hedonic <strong>value</strong> should be stronger for a “shopping as recreation”<br />
orientation<br />
Online shopping utilitarian <strong>value</strong> should be stronger for a “shopping as work”<br />
orientation<br />
Gender differences and the online shopping experience<br />
How do males and females evaluate a shopping experience? According to Ezell and Motes<br />
(1995), in a traditional store, males are more sensible than females to store characteristics that<br />
enable them to carry out the grocery shopping activity in minimum time: ease of finding desired<br />
items, convenience of location and ease of navigation inside the store. As a matter of fact, even<br />
when they engage in shopping willingly and enjoy this activity, males are goal-directed and “shop<br />
to win” (Otnes and McGrath, 2001). They shop to achieve shopping success, for example to defeat<br />
retailers by obtaining lower prices, status, for example by demonstrating expertise in certain product<br />
categories, or romantic success, by mastering feminine product categories such as lingerie or<br />
gourmet food for example (Otnes and McGrath, 2001). Gender differences in the evaluation of<br />
shopping should also be true in the context of e-shopping. Males are indeed more sensible than<br />
females to the instrumental aspects of new technologies: they are task-oriented and consider<br />
perceived usefulness to a greater extent in making their decisions regarding the adoption of a new<br />
technology (Venkatesh and Morris, 2000). As a consequence, females should be more sensible to<br />
61
the hedonic aspects of the online shopping experience and males should be more sensible to its<br />
utilitarian aspects.<br />
H 5 : The relationship between online shopping hedonic <strong>value</strong> and <strong>satisfaction</strong> will be<br />
stronger for females than males<br />
H 6 : The relationship between online shopping utilitarian <strong>value</strong> and <strong>satisfaction</strong> will be<br />
stronger for males than for females<br />
H 7 : Online shopping hedonic <strong>value</strong> should be stronger for females<br />
H 8 : Online shopping utilitarian <strong>value</strong> should be stronger for males<br />
Online shopping<br />
hedonic <strong>value</strong><br />
Online shopping<br />
utilitarian <strong>value</strong><br />
Research methods<br />
Experience<br />
Shopping orientation<br />
Gender<br />
Figure 2 – Conceptual framework<br />
Satisfaction<br />
An experiment manipulated the shopping purpose over two levels. 417 undergraduate and<br />
graduate business students participated in the study. Four electronic catalogs from online travel<br />
agencies were selected as stimuli for the study: online travel agencies were selected because travel<br />
is among the most successful product on the web. In order to test the links between online shopping<br />
<strong>value</strong>s and consumer <strong>satisfaction</strong>, each subject had to visit two electronic catalogs and then respond<br />
to a questionnaire. To avoid any bias, subjects who had already visited the electronic catalog were<br />
excluded from the sample, the final sample is of 322 students, 142 females and 180 males.<br />
62
Each subject experience both experimental conditions and visit an electronic catalog with a<br />
“shopping as work” scenario and another catalog with a “shopping as recreation” scenario. It<br />
guarantees that differences between the two scenarios are caused by the manipulation, and not by<br />
sampling differences. Confounding variables such as carryover effects were controlled by<br />
counterbalancing. Half the subjects visited first an electronic catalog with a “shopping as<br />
recreation” orientation and then another one with a “shopping as work” orientation and the other<br />
half visited first an electronic catalog with a “shopping as work” orientation and then another one<br />
with a “shopping as recreation” orientation.<br />
A scenario was developed for each orientation and for each electronic catalog. A pre-test was<br />
performed to check that the “shopping as work” scenario was perceived as work and that the<br />
“shopping as recreation” scenario was perceived as recreation. Additionally a manipulation check<br />
was introduced in the final questionnaire: “How did you consider the visit before visiting the web<br />
site: as work � as recreation”.<br />
Measures<br />
Literature on retailing, services marketing and environmental psychology was used to<br />
identify pre-existing measures. Measures were then adapted to the online retailing context. Two<br />
studies were realized in order to adapt and validate our measures.<br />
The first study evaluated each scale performance: 60 students had to visit two electronic<br />
catalogs and to respond to a questionnaire after each visit. Online shopping hedonic or utilitarian<br />
<strong>value</strong>s were assessed by the Personal Shopping Value (PSV) scale (Babin, Darden and Griffin<br />
1994). Four items measure hedonic <strong>value</strong> and three items measure utilitarian <strong>value</strong>. Responses are<br />
anchored on a 7 point scale from 1=strongly disagree to 7= strongly agree. Coefficient alpha is<br />
0.8767 for online shopping hedonic <strong>value</strong> and 0.8411 for online shopping utilitarian <strong>value</strong>.<br />
Satisfaction is assessed by a scale by Llosa (1996). One item measure the cognitive dimension of<br />
63
<strong>satisfaction</strong> (Oliver, 1980; Westbrook and Oliver, 1981; Oliver and Bearden, 1983), one item its<br />
affective dimension (Oliver, 1980; Westbrook, 1987; Westbrook and Oliver, 1981; Oliver and<br />
Bearden, 1983; Oliver, 1996) and two items its conative dimension (Westbrook and Oliver, 1981)<br />
(Hausknecht, 1990). Responses are anchored on a 7 point scale. Coefficient alpha is 0.9305.<br />
A second study developed a measure of shopping orientation. Expectations were assessed on<br />
a seven point semantic differential scale by a single item: “I expect: to be efficient � to spend a<br />
good time”. Consumers’ responses to their environment have been classified according to four<br />
dimensions representing affective quality: (1) arousing versus sleepy, (2) exciting versus gloomy,<br />
(3) pleasant versus unpleasant and (4) distressing versus relaxing (Russell, 1980; Russell and Pratt,<br />
1980; Darden and Babin, 1994; Babin and Darden, 1996). In this research, we use the pleasant<br />
versus unpleasant dimension for a parsimonious representation of affective quality. Eleven items<br />
measure consumer perceptions of the web site’s affective quality and were pre-tested with 110<br />
students. Five items were selected. Responses were anchored on a 7 point scale from 1= strongly<br />
disagree to 7=strongly agree. Coefficient alpha is 0.9114.<br />
Shopping orientation manipulation<br />
Scenarios have been used by prior research (Eroglu and Machleit, 1990; Dabholkar, 1994;<br />
Dabholkar and Bagozzi, 2002) to manipulate the shopping or service situation. In this research, two<br />
scenarios were created to induce a “shopping as work” and a “shopping as recreation” orientation.<br />
We used consumer role, time pressure and shopping motives to effect the manipulation and we<br />
controlled the effects of the physical and social environment - each subject visited the electronic<br />
catalog in a similar setting- computer laboratories of business schools – and antecedent states – each<br />
subject had to visit an electronic catalog with a “shopping as work” or a “shopping as recreation”<br />
scenario. A scenario was developed for each electronic catalog for a total of 8 scenarios.<br />
64
In the “shopping as work” condition, students had five minutes to visit an online travel (time<br />
pressure) agency web site to plan a specific trip – a destination, hotel description, room description<br />
and travel conditions were provided – (prepurchase information search) for their parents (shopping<br />
for somebody else) and send them an email. In the “shopping as recreation” condition, students had<br />
unlimited time (no time pressure) to visit an online travel agency to find ideas – only some general<br />
ideas about possible destinations were provided - (browsing) for their next trip or holiday (shopping<br />
for themselves).<br />
A further study was conducted using 58 students to pre-test each scenario. Our goal was to<br />
test the existence of significant differences between the “shopping as recreation” and “shopping as<br />
work” scenario with regards to affective quality and expectations. Students were instructed to read<br />
the scenario, to put themselves in the particular situation described by the scenario and then to<br />
complete a questionnaire measuring the affective quality of the online shopping situation described<br />
in the scenario and their expectations in this situation. Each student had to read a “shopping as<br />
work” and “a shopping as recreation” scenario. A paired sample t-test show that the affective<br />
quality of the online shopping situation is significantly higher for the “shopping as recreation”<br />
scenario (t = -11.274, p=0.000) and that consumers expects recreation to a greater degree for the<br />
“shopping as recreation” scenario (t = -11.634, p = 0.000). This difference was validated for each<br />
electronic catalog.<br />
A manipulation check was introduced in the final questionnaire: “How did you consider<br />
the visit before visiting the web site: as work � as recreation”.<br />
Data analysis<br />
A technique proposed by Sauer and Dick (1993) and applied by Homburg and Giering (2001)<br />
was used to test moderating variables in a structural equation model (Hypotheses H1, H2, H5 and<br />
65
H6). It involves performing a multi-group analysis with each sub-sample of the moderating<br />
variables (gender and shopping orientation). Two models are compared: one model in which the<br />
parameters are allowed to vary freely across groups (general model) and another model in which<br />
parameters are constrained to be equal across groups (restricted model). If there is a significant<br />
difference between the groups, the general model should fit better (χ²) than the restricted model. It is<br />
necessary to calculate the difference between the χ² of the general model and the χ² of the restricted<br />
model (dχ²). A significant dχ² suggest that the relationships are different between the groups and is<br />
consistent with moderation.<br />
Research results<br />
Confirmatory factor analysis (CFA) was conducted on all measures: online shopping <strong>value</strong>s<br />
and consumer <strong>satisfaction</strong> with the electronic catalog visit. Two items had high modification indices<br />
and were dropped from the analysis. Another CFA was conducted. Fit indices are correct for each<br />
scenario: χ²=42.4. RMSEA=0.049, RMR=0.078, GFI=0.972, AGFI=0.947, TLI=0.985, CFI=0.990<br />
for the “shopping as recreation” scenario and χ²=38.5, RMSEA=0.043, RMR=0.109, GFI=0.974,<br />
AGFI=0.950, TLI=0.988, CFI=0.992 for the “shopping as work” scenario. Correlations between<br />
constructs were examined to test discriminant validity. Some variables such as <strong>satisfaction</strong> and<br />
online shopping hedonic <strong>value</strong> are highly correlated in the “shopping as recreation” condition (see<br />
table 1).<br />
Table 1 – Correlation between variables in the “shopping as recreation” scenario<br />
Satisfaction Hedonic <strong>value</strong> Utilitarian <strong>value</strong><br />
Satisfaction 1 0.828 0.660<br />
Hedonic <strong>value</strong> 0.828 1 0.454<br />
Utilitarian <strong>value</strong> 0.660 0.454 1<br />
66
This pattern is consistent with our research hypotheses. Online shopping hedonic <strong>value</strong> was<br />
predicted to have a relatively stronger effect on consumer <strong>satisfaction</strong> in this condition. A procedure<br />
used by Dabholkar and Bagozzi (2002) which involves conducting a simple CFA with the two<br />
constructs as one was applied in this scenario to assess the degree of discriminability in light of the<br />
high correlations. In each case, the CFA with two constructs has better fit indices than the CFA with<br />
two constructs as one. Coefficient alphas are correct for each scale: 0.832 for online shopping<br />
hedonic <strong>value</strong>, 0.878 for online shopping utilitarian <strong>value</strong> and 0.907 for consumer <strong>satisfaction</strong>.<br />
Manipulation check<br />
A single item was used to assess manipulation success: : “How did you consider the visit before<br />
visiting the web site: as work � as recreation”. A paired sample t-test was realized to compare consumer<br />
responses to this question for each scenario. Results show a significant difference (t=4.714, p=0.000)<br />
between the “shopping as recreation” scenario (4.608) and for the “shopping as work” scenario (4.232).<br />
Moderating impact of shopping orientation<br />
Model fit is satisfying: χ²=80.862, RMSEA=0.033, RMR=0.095, GFI=0.973, AGFI=0.949,<br />
TLI=0.987, CFI=0.991. In the “shopping as recreation” condition (see figure 3), consumer<br />
<strong>satisfaction</strong> with the electronic catalog visit is determined mainly by online shopping hedonic <strong>value</strong><br />
(0.666). The correlation between online shopping hedonic <strong>value</strong> and online shopping utilitarian<br />
<strong>value</strong> is 0.454. In the “shopping as work” condition (see figure 3), consumer <strong>satisfaction</strong> with the<br />
electronic catalog is determined by both visit hedonic (0.473) and utilitarian (0.469) <strong>value</strong>. The<br />
correlation between online shopping hedonic <strong>value</strong> and online shopping utilitarian <strong>value</strong> is 0.266<br />
67
Differences between the “shopping as recreation” and the “shopping as work” models were<br />
tested globally and at the individual parameter level. These analyses suggest: (1) a significant<br />
difference in overall fit between the models (dχ² =21.661 dDL=9, p
Figure 3 – Shopping orientation and the <strong>value</strong>-<strong>satisfaction</strong> chain<br />
Hypotheses 3 and 4 are supported. Online shopping hedonic <strong>value</strong> is significantly higher in<br />
the “shopping as recreation” scenario (-4.743, p
(Hypothesis 5) and online shopping utilitarian <strong>value</strong> has a stronger impact on consumer <strong>satisfaction</strong><br />
for males, but the difference is not significant (Hypothesis 6).<br />
Hypothesis 7 is supported. Online shopping hedonic <strong>value</strong> is significantly higher for females<br />
than for males (2.621, p
Should an online shopping web site deliver both hedonic and utilitarian <strong>value</strong>? Both online<br />
shopping hedonic and utilitarian shopping <strong>value</strong> have a strong impact on consumer <strong>satisfaction</strong>. Our<br />
results suggest however that consumers attach importance to the hedonic aspects of a web site visit,<br />
whatever the orientation. The online shopping hedonic <strong>value</strong> has a stronger impact on consumer<br />
<strong>satisfaction</strong> when shopping for recreation than when shopping with a specific task in mind.<br />
However, the online shopping utilitarian <strong>value</strong> does not have a stronger impact on consumer<br />
<strong>satisfaction</strong> when shopping with a specific task in mind than when shopping for recreation.<br />
Consistent with patronage theory, online shopping hedonic <strong>value</strong> is higher when shopping for<br />
recreation and utilitarian <strong>value</strong> is higher when shopping with a specific task in mind. Previously,<br />
this hypothesis was not supported (Hammond, McWilliam and Diaz, 1998). Our results also show<br />
differences between males and females evaluation of the e-shopping experience. Although the<br />
differences are not significant, online shopping utilitarian <strong>value</strong> has a stronger impact on consumer<br />
<strong>satisfaction</strong> for males and online shopping hedonic <strong>value</strong> has a stronger impact on consumer<br />
<strong>satisfaction</strong> for females. Females experience greater hedonic <strong>value</strong> than males when shopping on<br />
the Internet. Interestingly, the link between hedonic <strong>value</strong> and utilitarian <strong>value</strong> is higher for females<br />
than for males which mean shopping efficiency and shopping enjoyment are linked to a greater<br />
extent for females.<br />
Our findings suggest that designers should consider both hedonic and utilitarian aspects of a<br />
web site, but should take into account the consumer’s orientation and gender. We showed that<br />
females experienced greater hedonic <strong>value</strong> when shopping on the Internet and that shopping<br />
efficiency and shopping enjoyment were closely related for them. Consumers evaluate online<br />
shopping mainly on its hedonic aspects when shopping for hedonic purposes and on both hedonic<br />
and utilitarian aspects when shopping with a specific task orientation. This research also<br />
71
demonstrates the importance of measuring both hedonic and utilitarian <strong>value</strong> and of controlling for<br />
shopping orientation and gender when pre-testing an electronic catalog.<br />
Some limitations of our study should be noted. First, our study only considers electronic<br />
catalogs from online travel agencies. As such the external validity may be limited. Generalizability<br />
could be established if additional studies validate the conceptual framework for other industries<br />
such as banking or computers. Second, the conceptual framework was tested with students.<br />
Although according to Calder, Phillips and Tybout (1981), using students reduces extraneous<br />
sources of variance, additional research is needed to validate the results with a non student sample.<br />
Third, subjects who had already visited the electronic catalog were excluded from the final sample.<br />
This procedure was necessary to ensure the internal validity of our research but limits its external<br />
validity.<br />
References<br />
Arnold, Mark J. Reynolds Kristy E. Hedonic shopping motivations. Journal of Retailing 2003; 79,<br />
2: 77-95<br />
Babin Barry J. Attaway Jill S. Atmospheric affect as a tool for creating <strong>value</strong> and gaining share of<br />
customer. Journal of Business Research 2000; 49: 91-99.<br />
Babin Barry J. Darden William R. Good and bad shopping vibes: spending and patronage<br />
<strong>satisfaction</strong>. Journal of Business Research 1996; 35 (3): 201-206.<br />
Babin Barry J. Darden William R. Griffin Mitch. Work and/or fun: measuring hedonic and<br />
utilitarian shopping <strong>value</strong>. Journal of Consumer Research 1994; 20: 644-656.<br />
Babin Barry J. The in-store retail experience: A CEV approach to consumer shopping activity.<br />
Dissertation, Louisiana State University, 1991.<br />
72
Belk Russell W. Situational variables and consumer behavior. Journal of Consumer Research 1975;<br />
2 (3): 157-164.<br />
Bellenger, Danny N. Korgaonkar P.K. Profiling the recreational shopper. Journal of Retailing<br />
1980; 56 (3): 77-92<br />
Bellenger, Danny, Robertson Dan H. Greenberg Barnett A. Shopping center patronage. Journal of<br />
Retailing 1977; 53 (2): 29-38<br />
Bird, Michael. Let’s Talk about Sex. In Store Marketing 2002; July 2002: 21-22<br />
Bloch Peter H. Ridgway Nancy M. Sherrell Dan L. Extending the concept of shopping: An<br />
investigation of browsing activity. Journal of the Academy of Marketing Science 1989; 17 (1): 13-<br />
21.<br />
Bloch Peter H. Sherrell Dan L. Ridgway Nancy M. Consumer search: An extended framework.<br />
Journal of Consumer Research 1986; 13: 119- 126.<br />
Calder Bobby J. Phillips Lynn W. Tybout Alice M. Designing research for application. Journal of<br />
Consumer Research 1981; 8 (2): 197-207.<br />
Chen, Zhan Dubinsky Alan A conceptual model of perceived customer <strong>value</strong> in e-commerce: A<br />
preliminary investigation. Psychology and Marketing 2003; 20: 323-347.<br />
Childers Terry L. Carr Christopher L. Peck Joann Carson Stephen Hedonic and utilitarian<br />
motivations for online retail shopping behavior. Journal of Retailing 2001; 77: 511-535.<br />
Cooper-Martin, E. (1991), Consumers and movies: some findings on experiential products, R.<br />
Holman and M. Solomon (eds), Advances in Consumer Reseach, Provo UT: Association for<br />
Consumer Research, 372-378<br />
Dabholkar Pratibha A. Bagozzi Richard P. An attitudinal model of technology based self-service:<br />
moderating effects of consumer trait and situational factors. Journal of the Academy of Marketing<br />
Science 2002; 20 (3): 184-201.<br />
73
Dabholkar, Pratibha A. Incorporating choice into an attitudinal framework: analyzing models of<br />
mental comparison processes. Journal of Consumer Research 1994; 21: 100-118<br />
Darden William R. Babin Barry J. Exploring the concept of affective quality: expanding the concept<br />
of retail personality. Journal of Business Research 1994; 29 (2): 101-109.<br />
Dawson Scott Bloch Peter H. Ridgway Nancy M. Shopping motives, emotional states, and retail<br />
outcomes. Journal of Retailing 1990; 66 ( 4): 408-427.<br />
De Ruyter Ko Wetzels Martin Lemmink Jos Mattsson J. The dynamics of the service delivery<br />
process: a <strong>value</strong>-based approach. International Journal of Research in Marketing. 1997; 14: 231-<br />
243.<br />
Donovan, R. J. Rossiter John R. Store atmosphere: an environmental psychology approach. Journal<br />
of Retailing, 1982; 58 (Spring): 34-57.<br />
Eroglu, Sevgin A. Machleit, Karen A. An empirical study of retail crowding: antecedent and<br />
consequences. Journal of Retailing 1990; 66 (2): 201-221<br />
Ezell Hazel F Motes William H. Differentiating between the sexes: a focus on male-female grocery<br />
shopping attitudes and behavior. Journal of Consumer Marketing 1985; 2 (2); 29-40.<br />
G.V.U. GVU’s 10 th WWW User Surveys, http://www.gvu.gatech.edu/ 1999<br />
Griffin Mitch Babin Barry J. Modianos Doan Shopping <strong>value</strong> of russian consumers: the impact of<br />
habituation in a developing economy. Journal of Retailing 2000; 76 (1): 33-52.<br />
Hammond Kathy McWilliam Gil Diaz Andrea Fun and work on the web: differences in attitudes<br />
between novices and experienced users. Advances in Consumer Research. J.W. Alba J.W.<br />
Hutchinson (eds). Provo UT: Association for Consumer Research (25): 372-378.<br />
Hausknecht, Douglas R. Measurement scales in consumer <strong>satisfaction</strong>/dis<strong>satisfaction</strong>. Journal of<br />
Consumer Satisfaction, Dis<strong>satisfaction</strong> and Complaining Behavior 1990; 3: 1-11<br />
Hirschman, Elisabeth C. Holbrook Morris B. Hedonic consumption: emerging concepts, methods<br />
and propositions. Journal of Marketing 1982; 46 (3): 92-101<br />
74
Hoffman Donna L. Novak Thomas P. Marketing in hypermedia computer-mediated environments:<br />
conceptual foundations. Journal of Marketing 1996; 60 (3): 64-77.<br />
Holbrook, M.B. The Nature of Consumer Value: An Axiology of Services in the Consumption<br />
Experience. In Richard T. Rust and Richard T. Oliver, editors, Service <strong>Quality</strong>: New Directions in<br />
Theory and Practice., Sage Publications Inc.: Thousand Oaks, California, 1994, pp. 21-71<br />
Holbrook, Morris B. Hirschman, Elisabeth C. The experiential aspects of consumption: consumer<br />
fantasies, feelings and fun. Journal of Consumer Research 1982; 9 (2): 132-140<br />
Holbrook, Morris B. Consumer <strong>value</strong>: a framework for analysis and research. Routledge<br />
Intepretative Marketing Research Series: London and New York, 1999<br />
Holbrook, Morris B. Emotion in the consumption experience: toward a new model of the human<br />
consumer, In R.A. Peterson, H.D. Hoyer and W.R., Wilson, editors, The Role of Affect in<br />
Consumer Behavior: Emerging Theories and Applications¸ Lexington Books, D.C. Heath and<br />
Company/Lexington, Massachusetts/Toronto, 1986, pp. 17-52<br />
Homburg Christian Giering Annette Personal characteristics as moderators of the relationship<br />
between customer <strong>satisfaction</strong> and loyalty – an empirical analysis. Psychology and Marketing 2001;<br />
18 (1): 43-66.<br />
Journal du Net Les Chiffres Clés, http://www.journaldunet.com/chiffres-cles.shtml 2003<br />
Lemmink Jos de Ruyter Ko Wetzels Martin The role of <strong>value</strong> in the delivery process of hospitality<br />
services. Journal of Economic Psychology 1998; 19: 159-177.<br />
Llosa, Sylvie Contributions à l’Etude de la Satisfaction dans les Services, Dissertation, Université<br />
de Droit, d’Economie et des Sciences d’Aix Marseille, Institut d’Administration des enterprises,<br />
2001<br />
Lutz Richard J. Kakkar Pradeep Situational influence in interpersonal persuasion. Advances in<br />
Consumer Research, Beverlee Anderson (ed). Ann Arbor, MI: Association for Consumer Research.<br />
1976; 3: 370-378.<br />
75
Mano Haim Elliott Michael T. Smart shopping: the origins and consequences of price savings.<br />
Advances in Consumer Research Merrie Brucks and Deborah J. MacInnis (Eds.) Provo UT:<br />
Association for Consumer Research. 1997; (24) 504-510.<br />
Mano Haim Oliver Richard L. Assessing the dimensionality and structure of the consumption<br />
experience: evaluation, feeling, and <strong>satisfaction</strong>.” Journal of Consumer Research 1993; 20: 451-<br />
466.<br />
Mao Wendy W. Fader Peter S. Dynamic conversion behavior and e-commerce sites. Working<br />
Paper. Wharton Business School 2002.<br />
Mathwick Charla Malhotra Naresh K. Rigdon Edward Experiential <strong>value</strong>: conceptualization,<br />
measurement and application in the catalog and Internet shopping environment. Journal of Retailing<br />
2001; 77: 39-56.<br />
Oliver Richard L. Measurement and evaluation of <strong>satisfaction</strong> processes in retail settings. Journal of<br />
Retailing 1981; 57 (3): 25-48.<br />
Oliver, Richard L. A cognitive model of the antecedents and consequences of <strong>satisfaction</strong> decisions.<br />
Journal of Marketing Research 1980; 27: 460-469<br />
Oliver, Richard L. Bearden, William O. The role of involvement in <strong>satisfaction</strong> processes. In<br />
Richard Bagozzi and Ann Tybout, editors, Advances in Consumer Research, 10, Ann Arbor, MI:<br />
Association for Consumer Research, 1983: pp. 250-255<br />
Otnes Cele McGrath Mary Ann. Perceptions and realities of male shopping behavior. Journal of<br />
Retailing 2001; 77 (1): 111-137.<br />
Raman Niranjan. V. Leckenby John D. Factors affecting consumer « WebAd » visits. European<br />
Journal of Marketing 1998; 32 (7/8): 737-748.<br />
Russell James A. A circumplex model of affect. Journal of Personality and Social Psychology 1980;<br />
39 (6): 1161-1178.<br />
76
Russell James A. Affective space is bipolar. Journal of Personality and Social Psychology 1980; 37<br />
(3): 345 – 356.<br />
Russell James A. Pratt G. A description of the affective quality attributed to environments. Journal<br />
of Personality and Social Psychology 1980; 38 (3): 311 – 322.<br />
Sauer Peter L. Dick Alan. Using moderator variables in structural equation models. Advances in<br />
Consumer Research Leight McAlister and Michael Rothschild (eds). Provo UT: Association for<br />
Consumer Research 1993; (20): 636-640.<br />
Seiders, Kathleen, Leonard Berry Gresham, Larry G. Attention Retailers! How Convenient is your<br />
Convenience Strategy. Sloan Management Review 2000: 79-89<br />
Senecal Sylvain Gharbi Jamel E. Nantel Jacques The influence of flow on hedonic and utilitarian<br />
shopping <strong>value</strong>s. Advances in Consumer Research. S Broniarczyk and K. Nakamoto (eds) Provo,<br />
UT: Association for Consumer Research 2001. (29), www.acrweb.com.<br />
Szymanski David M. Hise Richard T. E-Satisfaction: An initial examination. Journal of Retailing<br />
76 2000; (3): 309-322.<br />
Szymanski, David M. Hise Richard T. E-<strong>satisfaction</strong>: an initial examination. Journal of Retailing<br />
2001; 76: 309-322.<br />
Tauber Edward M. Why do people shop? J.ournal of Marketing 1972; 36: 46-49.<br />
Venkatesh Viswanath Morris Michael G. Why don’t men ever stop to ask for Directions? gender,<br />
social influence, and their role in technology acceptance and usage behavior. MIS Quaterly 2000;<br />
24 (1): 115-139.<br />
Westbrook Richard A. Black William C. A motivation-based shopper typology. Journal of Retailing<br />
1985; 61 (1): 78-103.<br />
Zeithaml V., Parasuraman A. & Malhotra Arvind A conceptual framework for understanding e-<br />
service quality: implications for future research and managerial practice. Report N°.00.115.<br />
Marketing Science Institute. Working Paper Series 2000<br />
77
Zeithaml V., Parasuraman A. Malhotra Arvind Service quality delivery through Web sites: A<br />
critical review of extant knowledge. Journal of the Academy of Marketing Science 2002; 30: 162-<br />
175.<br />
78
The Influence of Intangibility on Perceived Evaluation Difficulty and Risk: Brand and<br />
Generic Product-Category Perspectives<br />
Michel Laroche, Concordia University<br />
Maria Kalamas, Concordia University<br />
Gordon H. G. McDougall, Wilfrid Laurier University<br />
Filip Bartos, Concordia University<br />
Yi Zhong, Concordia University<br />
Abstract<br />
As virtual products/services have emerged in consumer markets, intangibility has assumed an important role<br />
in marketing, shifting from a service-exclusive term to a product-related one as well. A three-dimensional<br />
intangibility construct, which includes physical intangibility, mental intangibility, and generality, has<br />
recently been identified. While this finding has advanced our understanding of intangibility per se, little has<br />
been done in relating this new operationalization to consumer behavior and especially branding strategies.<br />
Thus, the focus of this research is to study whether brands, as opposed to generic product-categories,<br />
efficiently reduce risk and evaluation difficulty when the product/service is perceived to be intangible. Our<br />
results show brands to be major intangibility-reducers for services but not for products. Brands also variably<br />
reduce the effects of the three types of intangibility on perceived evaluation difficulty and risk. In our holistic<br />
model, knowledge and/or involvement moderate the relationships between intangibility and, perceived risk<br />
and/or difficulty of evaluation. We also uncover differences between the moderating effects of knowledge<br />
and involvement in our comparisons of the branded and generic contexts. In light of our findings, we make<br />
brand-related recommendations, which are of interest to both academicians and practitioners.<br />
79
1. Introduction<br />
Like inseparability, heterogeneity, and perishability, intangibility is one of the four major<br />
characteristics used to classify services (Rust et al. 1996; Shostack 1977; Zeithaml et al. 1985).<br />
Considered to be the key characteristic that differentiates products from services (Bebko 2000;<br />
Zeithaml and Bitner 2000), the role of intangibility has shifted from a service-exclusive term to a<br />
product-related one as well. Faced with the changes and challenges brought forth by a new<br />
category of virtual or semi-virtual products/services (e.g., Web browsers, MP3 music files),<br />
academicians are now equipped to study the effects of intangibility on perception of risk and<br />
evaluation difficulty using a three-dimensional intangibility construct. Developed by Laroche,<br />
Bergeron and Goutaland (2001), the intangibility construct now comprises three dimensions:<br />
physical intangibility, mental intangibility, and generality. Each of these dimensions may have a<br />
differential impact on consumers’ decision making processes both for branded and generic<br />
products/services. The importance of studying intangibility within a branding context rests on<br />
the premise that brands are believed to reduce consumers’ perceived risk and difficulty of<br />
evaluation.<br />
Given the dearth of research on intangibility, the focus of this study is, first, to confirm<br />
the with new data the three dimensions of intangibility (Laroche, Bergeron and Goutaland 2001)<br />
and then to study the effects of intangibility on perceived risk and difficulty of evaluation (for<br />
the proposed model, see Figure 1). Another aim of this study is to determine how knowledge and<br />
involvement, acting as moderators, affect the relationships between intangibility and difficulty of<br />
evaluation, and intangibility and perceived risk. By comparing generic products/services with<br />
branded ones, we also explore how the two strategies impact the relationships among the<br />
proposed constructs. The overall goal of this research is thus to determine whether branding<br />
80
educes risk and evaluation difficulty when the branded product/service is perceived as<br />
intangible.<br />
2. Literature Review and Hypotheses<br />
2.1. Intangibility<br />
2.1.1. Definition of Intangibility<br />
[Figure 1 about here]<br />
Lovelock (2001) recently identified nine basic differences between products and services<br />
with intangibility as one of the major distinguishing factors. Shostack (1977) illustrated the<br />
differences between tangible products and intangible services by suggesting that the former<br />
could be described precisely, be replicated exactly, be modified, and be duplicated while the<br />
latter were dynamic, evolving, and hard to quantify. Along the same lines, Berry (1980) defined<br />
intangibility as something impalpable. Adding another level of complexity, Bebko (2000)<br />
recently proposed that intangibility should include lack of physical evidence of the process<br />
instead of being defined exclusively as lack of physical attributes of the outcome.<br />
2.1.2. Dimensions of Intangibility<br />
Usually defined as inaccessible by the senses, subjective, and difficult to measure, most<br />
scholars agree that intangibility is one of the most distinguishing characteristics of services<br />
(Bateson 1979, Berry 1980, Lovelock 2001, Shostack 1977, Van Dierdonck 1992).<br />
Characterizing services as physically and mentally intangible, a number of researchers<br />
conceptualized intangibility as a two-dimensional construct (Bateson 1979; Berry 1980;<br />
McDougall and Snetsinger 1990). Among them, Dubé-Rioux, Regan and Schmitt (1990)<br />
proposed a two-dimensional intangibility construct composed of concreteness and specificity.<br />
Their findings revealed that services differed in their cognitive representations with abstract<br />
services represented by means of generic attributes and concrete services represented using more<br />
81
specific attributes. Dealing with products, Breivik, Troye and Olsson (1998) also developed a<br />
two-dimensional model of intangibility with inaccessibility to the senses and generality as the<br />
two components. Compared to tangible product attributes, which are perceived upon exposure,<br />
intangible product attributes are mentally constructed and hence, subject-dependent and<br />
inaccessible to the senses. Generality, in this study, encompassed the general product attributes<br />
that lead to general outcomes (e.g., car safety). Common among all the studies described thus far<br />
is a two-dimensional conceptualization of intangibility.<br />
Unlike previous conceptualizations, the most recent study proposed a three-dimensional<br />
construct of intangibility, composed of physical intangibility (i.e., not easy to see or touch),<br />
mental intangibility (i.e., not easy to grasp mentally), and generality (as opposed to specificity)<br />
(Laroche, Bergeron and Goutaland2001). The finding of the third dimension, mental<br />
intangibility, confirmed Laroche, Bergeron and Goutaland (2001)’s proposition that<br />
inaccessibility to the senses (i.e., physical intangibility) and generality were not sufficient to<br />
fully measure the overall construct since intangibility was subject-specific (Hirschman 1981,<br />
Breivik, Troye and Olsson 1998). Briefly, Laroche, Bergeron and Goutaland (2001) concluded<br />
that the new three-dimensional concept of intangibility provides valuable insights into the<br />
tangibility of goods and the intangibility of services. In all, their findings showed that goods<br />
could be both physically tangible and mentally intangible, whereas services could be both<br />
physically intangible and mentally tangible.<br />
2.1.4. Intangibility and Related Marketing Strategies<br />
As a result of its inherent characteristics, intangibility has brought forth many challenges<br />
for marketers including storability (Berry 1980), communicability (Rathmell 1974), risk<br />
perceptions, and evaluation difficulties. To deal with the inherent problems of intangibility,<br />
academicians recommend tangibilizing products/services through management of physical<br />
82
surroundings and presentations (Berry and Clark 1986), mental visualization and association<br />
(Berry and Clark 1986), effective advertising (Berry and Clark 1986, Mittal and Baker 2002,<br />
Zeithaml and Bitner 2000), and the use of image and brand management (Berry 2000, Edgett and<br />
Parkinson 1993).<br />
2.1.5. Intangibility from the Brand and Generic Product-Category Perspectives<br />
Consumer choices follow a somewhat hierarchical process whereby different choices are<br />
related to different levels of abstraction (Howard 1977). Choices at the product-category level<br />
are higher-level, more abstract choices, while lower-level choices involve more concrete<br />
alternatives such as the brands within a category. Unlike Howard’s hierarchical process, Johnson<br />
and Fornell (1984) hypothesized a continuum of attributes from concrete to abstract and showed<br />
that the more noncomparable (dissimilar) products become the more abstract their product<br />
attributes. Building on these hypotheses, the authors showed that specific product attributes are<br />
associated with brands while generic attributes are associated with product categories. Since<br />
generic product categories are more abstract and brands are more specific and concrete, we<br />
hypothesize that:<br />
H1: The degree of generality associated with generic category-level choices is higher than it is for brand-level choices.<br />
Mental tangibility and specificity appear to be the most efficient tools for reducing customer perceived intangibility especially for<br />
information and virtual products (Laroche, Bergeron and Goutaland 2001). Along the same lines, Mittal and Baker (2002) suggested<br />
that brand identity and brand positioning were useful advertising strategies in fighting against the intangibility of hospitality<br />
services. Brands, like pictures and company logos, may help consumers visualize services and therefore, increase mental tangibility.<br />
Based on the limited evidence in the services literature, we infer that brands reduce mental intangibility for both products and<br />
services, leading us to hypothesize that:<br />
H2: The degree of mental intangibility associated with generic category-level choices is higher than it is for brand-level choices.<br />
Since physically intangible products are not easily seen or touched, physical intangibility should be independent of whether the<br />
product is branded or belongs to a generic product category. Be it a Sony or a generic version, for example, the physical intangibility<br />
of an MP3 file always exists. For services, however, the independence of physical intangibility from brand and generic perspectives is<br />
questionable. Being physically intangible, services necessitate a physical representation strategy aimed at enhancing service tangibility<br />
through physically accessible objects, which are directly or peripherally a component of the service (e.g., buildings) (Berry and Clark<br />
1986). For instance, some hotels purposely park luxury cars before their entrances in order to make their services appear more<br />
physically tangible (Kotler et al. 1999). We thus infer that the physical representation required to tangibilize services will be more<br />
easily achieved through branding as opposed to a generic strategy.<br />
H3: The degree of physical intangibility associated with generic category-level choices is a) higher than it is for brand-level choices<br />
of services and b) similar to it for brand-level choices of products.<br />
83
2.2. Perceived Difficulty of Evaluation<br />
Intangibility makes it harder for marketers to promote intangible products/services and for<br />
consumers to evaluate offerings with intangible attributes (Zeithaml 1981). Much of the<br />
literature in services marketing has linked intangibility to consumers’ decision-making<br />
difficulties including decreased certainty of evaluation (Mitchell and Greatorex 1993; Murray<br />
1991) and increased difficulty of evaluation (McDougall 1987; McDougall and Snetsinger 1990;<br />
Zeithaml 1981) and processing effort (McDougall 1987). Zeithaml postulated that most goods<br />
fell to the left of the tangibility-intangibility continuum because most goods were easy to<br />
evaluate, whereas most services fell to the right since most services were difficulty to evaluate.<br />
Empirically corroborating Zeithaml’s postulations, Goutaland (1999) found mental intangibility<br />
and generality to be positively related to difficulty of evaluation and no relationship between<br />
physical intangibility and difficulty of evaluation. Likewise, Breivik, Troye and Olsson (1998)<br />
found a positive association between generality and difficulty of evaluation but contrary to<br />
expectations, their empirical study also revealed that inaccessibility to the senses was negatively<br />
associated with perceived difficulty of evaluation.<br />
2.3. Perceived Risk<br />
2.3.1. Types of Perceived Risk<br />
Cox and Rich (1964) first identified two types of perceived risk namely, financial risk<br />
and social-psychological risk. Later on, Jacoby and Kaplan (1981) suggested that overall<br />
perceived risk should include performance risk, physical risk, social risk, psychological risk, and<br />
time risk. Extending previous conceptualizations, researchers identified six types of risk (i.e.,<br />
financial risk, performance risk, physical risk, psychological risk, social risk and convenience<br />
loss or time-related risk) (Murry and Schlacter 1990; Stone and Grønhaug 1993). Although<br />
Murry and Schlacter (1990) believed that all six types of risks were perceived as greater for<br />
84
services than for goods, financial and performance risks were found not to be statistically<br />
significant.<br />
2.3.2. Risk Reduction<br />
Perceived risk is generally recognized as being influential on consumer decision-making<br />
because of the uncertainty and possible negative consequences involved with consumption.<br />
Bauer (1960) suggested that consumers might have preferences towards risk reduction strategies<br />
citing brand loyalty as a preferred risk reducer. Among the risk reduction strategies explored and<br />
recommended by researchers, branding is recognized as a major risk-reducer (Roselius 1971,<br />
Sheth and Venkatesan 1968, Wernerfelt 1988). Included in the arsenal of risk-reduction<br />
strategies we also find advertising (Barach 1969; Cox 1967), word of mouth (Cunningham 1967;<br />
Roselius 1971), company loyalty (Bauer 1961), personal and group influence (Perry and Hamm<br />
1968), and price-quality issues (Roselius 1971).<br />
2.3.3. Difficulty of Evaluation, Perceived Risk, and Intangibility<br />
Using a different conceptualization of intangibility, Breivik, Troye and Olsson (1998)<br />
found inaccessibility to the senses to be negatively related to difficulty of evaluation. McDougall<br />
drew a similar conclusion in an exploratory study where tangibility was conceptualized as “easy<br />
to picture or visualize before purchase” (1987, p. 430). He later explained that the nonsignificant<br />
influence of physical intangibility on difficulty of evaluation might have been due to the<br />
oversimplified tangibility measure and non-representative sample used in the research. Likewise,<br />
Goutaland (1999) found no significant relationship between the two constructs. Despite these<br />
findings, we posit a positive relation between physical intangibility and difficulty of evaluation.<br />
With respect to the other dimensions of intangibility, namely generality and mental intangibility,<br />
no specific studies exist from which we can draw, thus leading us to infer that the more general<br />
85
and mentally intangible a product/service is the more difficult it will be for consumers to<br />
evaluate it.<br />
Previous research suggests the more intangible a product/service is, the greater the<br />
perceived risk (Mitchell and Greatorex 1993; Murray and Schlacter 1990; Zeithaml 1981). While<br />
empirically demonstrated, this finding is solely based on the physical intangibility construct. In<br />
Goutaland’s study (1999) mental intangibility was positively related to perceived risk while<br />
physical intangibility and generality were not. Compared to mental intangibility, physical<br />
intangibility and generality appeared to contribute very little in stimulating perceived risk,<br />
especially in the context of a three-dimensional intangibility construct. While past literature<br />
supports the idea that intangibility results in greater risk perceptions, the links between the<br />
multidimensional intangibility and risk constructs necessitate further exploration. Based on<br />
previous findings, the following hypotheses ensue:<br />
H4: The more mentally intangible a product/service is, a) the more difficult it is to evaluate<br />
and b) the more risky it is perceived.<br />
H5: The more general a product/service is, a) the more difficult it is to evaluate and b) the<br />
more risky it is perceived.<br />
H6: The more physically intangible a product/service is, a) the more difficult it is to evaluate<br />
and b) the more risky it is perceived.<br />
2.3.4. Difficulty of Evaluation and Perceived Risk at the Brand and Product-Category Levels<br />
Brands facilitate consumer decision making particularly by improving decision-making<br />
efficiency (Alba and Hutchinson 1987; Johnson and Russo 1984) and reducing perceived risk<br />
(Wernerfelt 1988). Umbrella branding also eliminates consumers’ perceived risks, difficulty of<br />
evaluation, and product uncertainty (Erdem 1998). Branding plays an especially important role<br />
in the service arena by enabling customers to tangibilize and visualize the service and thereby<br />
reduce perceived social and monetary risks (Berry 2000). While Berry did not empirically test<br />
86
his propositions, his arguments on branding, perceived risk, and tangibilization are constructive.<br />
Extending previous findings to incorporate intangibility, we hypothesize that:<br />
H7: The impact of intangibility on a) difficulty of evaluation and b) perceived risk is greater<br />
for generic-category level choice than brand-level choice.<br />
2.4. Knowledge<br />
As a unidimensional construct (Alba and Hutchinson 1987), knowledge was traditionally operationalized<br />
using such measures as frequency of purchase (Anderson et al. 1979; Bettman and Park 1980), objective tests<br />
(Brucks 1985), and self-report measures (Johnson and Russo 1984). Given the diversity and difference in measures<br />
of knowledge and the inherent complexity of the construct, researchers called for a multi-dimensional<br />
operationalization (Bettman 1986, Brucks 1986; Brucks and Mitchell 1981). Some proposed a two-dimensional<br />
measure of consumer knowledge with familiarity and expertise as the two factors (Alba and Hutchinson 1987),<br />
while others came up with experience and expertise as the two dimensions. Murry and Schlacter (1990) proposed<br />
five items to measure experience (i.e., purchase experience, product utilization and exposure, brand familiarity,<br />
purchase frequency, and purchase confidence) and concluded that experience reduces consumers’ perceived risk.<br />
The most common approach used by researchers to operationalize experience is to treat it as familiarity (Alba and<br />
Hutchinson 1987; Johnson and Russo 1984). Familiarity improves consumers’ ability to categorize information at a<br />
more specific rather than generic level (Alba and Hutchinson 1987). Expertise, the second dimension of knowledge<br />
and distinct from experience, is commonly defined as consumers’ capacity to successfully perform a product-related<br />
task (Alba and Hutchinson 1987). The authors proposed that expertise was composed of five dimensions: cognitive<br />
effort and automaticity, cognitive structure, analysis, elaboration, and memory. However, the authors did not<br />
provide operational methods to measure the proposed dimensions. Zaichkowsky (1985) suggested that expertise and<br />
experience were strongly related when expertise was measured subjectively, but the relationship was weak when it<br />
was measured objectively thus making it is necessary to examine both subjective and objective perceptions of<br />
knowledge.<br />
87
2.4.1. Knowledge and Intangibility<br />
In Goutaland’s empirical study (1999), subjective knowledge had a negative influence on<br />
both difficulty of evaluation and perceived risk. As a moderator, subjective knowledge interacted<br />
with physical intangibility (mental intangibility) to increase (decrease) perceived risk. However,<br />
the expected moderating effect of knowledge on the relationship between intangibility and<br />
difficulty of evaluation was not found. These somewhat inconsistent findings necessitate further<br />
testing of the relationships between knowledge, intangibility, risk, and difficulty of evaluation.<br />
Moreover, the moderating effect of knowledge will be retested from the brand and generic<br />
category perspectives. Since brands reduce perceived risk and difficulty of evaluation, as<br />
explained in earlier sections, the moderating effect of knowledge will be less in a brand context<br />
than in a generic one. We thus hypothesize that:<br />
H8: Knowledge moderates the relationships between the three dimensions of intangibility<br />
(i.e., generality, physical intangibility and mentally intangibility) and a) difficulty of<br />
evaluation and b) perceived risk.<br />
H9: The more knowledgeable a consumer perceives himself to be regarding a<br />
product/service a) the less difficult it is to evaluate it and b) the less risky it is perceived.<br />
H10: The moderating effects of knowledge on a) difficulty of evaluation and b) perceived<br />
risk at the generic level are greater than those at the brand level.<br />
2.5. Involvement<br />
Zaichkowsky (1985) stated that involvement had been diversely defined and measured<br />
due to its different applications. In fact, involvement, applied under various objectives, led to<br />
different responses for products (Howard and Sheth 1969), for advertisements (Krugman 1977),<br />
and for purchase decisions (Clarke and Belk 1978). For the purpose of developing a scale,<br />
Zaichkowsky defined involvement as “a person’s perceived relevance of the object based on<br />
inherent needs, <strong>value</strong>s, and interests” (1985, p. 342). Based on the definition proposed,<br />
Zaichkowsky (1985) empirically developed the personal involvement inventory – a scale used to<br />
measure one’s product involvement. Other researchers argued that the construct was<br />
multidimensional rather than unidimensional. According to Laurent and Kapferer (1985), there<br />
88
was more than one type of involvement in consumer research as different antecedents of<br />
involvement resulted in different corresponding behaviors. As such, an involvement profile<br />
might serve as a better measurement in specifying the relationship between consumers and<br />
product categories.<br />
2.5.1. Involvement and Intangibility<br />
McDougall (1987) found that both intangibility and involvement were significantly<br />
related to product evaluation. Adding further insights, Goutaland’s empirical study (1999)<br />
revealed that involvement was positively associated with difficulty of evaluation and perceived<br />
risk. Both mental intangibility and generality, two of the three dimensions of intangibility,<br />
interacted with involvement to produce a negative effect on difficulty of evaluation. Moreover,<br />
the interaction between involvement and physical intangibility (generality) had a negative<br />
(positive) effect on perceived risk. Based on previous findings, both the predictive and<br />
moderating roles of involvement will be tested here.<br />
H11: Involvement moderates the relationships between the three dimensions of intangibility<br />
(i.e., generality, physical intangibility, and mental intangibility) and a) difficulty of<br />
evaluation and b) perceived risk.<br />
H12: The more involving a product/service is for a consumer, a) the more difficult it is to evaluate it<br />
and b) the more risky it is perceived.<br />
H13: The moderating effects of involvement on a) difficulty of evaluation and b) perceived<br />
risk at the generic level are greater than those at the brand level.<br />
3. Methodology<br />
3.1. Questionnaire<br />
3.1.1. Product and Service Selection<br />
Selected based on their suitability for a student population, the goods (i.e., a pair of jeans, a<br />
computer, and a music CD) and services (i.e., a pizzeria dinner, a checking account, and an<br />
Internet browser) used in this study varied in their degree of intangibility. In each good/service<br />
89
category, we included both generic and well-known brands (i.e., a pair of Levi’s jeans, an IBM<br />
computer, a Beatles CD, Pizza Hut pizza, a Royal Bank checking account, and Netscape).<br />
3.1.2. Questionnaire Design<br />
We developed a total of sixteen versions of the questionnaire (Table 1), half of which related to<br />
online purchasing and the remainder focused on offline purchasing. In addition to demographic<br />
information such as age, gender, education, part-time or full-time student status, language, and cultural<br />
background, each questionnaire included measures of all constructs for one tangible good, one less<br />
tangible good, and one service.<br />
3.2. Measures<br />
3.2.1. Intangibility<br />
[Table 1 about here]<br />
We adopted the measures for the three dimensions of intangibility from Laroche, Bergeron and<br />
Goutaland (2001).<br />
3.2.2. Difficulty of Evaluation and Perceived Risk<br />
We measured difficulty of evaluation using this general statement: “Given that I have to acquire a<br />
product (“a product on the Internet” for online versions), choosing among the available brands will be”<br />
(“evaluating the product/service will be” for the online and brand versions) difficult, problematic,<br />
complex, and complicated. We measured perceived risk using five dimensions, namely, financial risk,<br />
psychological risk, performance risk, social risk, and time risk (Stone and Grønhaug 1993).<br />
3.2.4. Knowledge and Involvement<br />
In line with the literature, we measured both subjective knowledge and practical experience using<br />
items adapted from Biehal (1983), Oliver and Bearden (1983), and Park et al. (1994). Reducing<br />
Zaichkowsky’s (1985) 20-item measure to 11 items, based on Mittal (1989)’s arguments, Goutaland<br />
(1999) measured involvement as a unidimensional construct. We used 5 of the most relevant items from<br />
Goutaland (1999)’s 11-item measure of involvement.<br />
90
3.3. Pretests and Data Collection<br />
We pretested each version of the questionnaire with a small group of students, following which we<br />
made some minor modifications to the wording of the questions. During the pretests, we also verified<br />
participants’ level of familiarity with the chosen brands. The data collection took place at a major North<br />
American university where we randomly distributed a total of eight hundred questionnaires (i.e., fifty<br />
copies for each of the sixteen versions).<br />
4. Analysis and Results<br />
4.1. Sample<br />
We collected a total of 783 usable questionnaires (i.e., a 97.9% response rate), which were by-<br />
and-large evenly distributed among the sixteen versions, the online/offline offerings, and the<br />
brand/generic contexts (Table 2). Reflecting the student body, over half (59.1%) of the respondents were<br />
concentrated in the 21 to 25 age group and about a quarter were in the under 20 category. With only a<br />
small percentage of graduate students, the vast majority of respondents were undergraduates (93.7%).<br />
Approached during daytime classes, 84.3% of respondents were full-time students while the rest were<br />
part-time students. Males and females were evenly represented in our sample.<br />
4.2. Factor Analysis<br />
Before testing the hypotheses, we ran an exploratory factor analysis using principal component<br />
extraction and oblimin rotation, to verify the existence of the dimensions proposed in the literature review<br />
and to examine the reliability of the measures used. After deleting two items which cross-loaded on other<br />
factors, we reran the factor analysis and found the eleven distinct constructs originally posited (Table 3).<br />
Among them, time risk explained most of the variance (25.5%), followed by knowledge (16.4%), and<br />
involvement (9.1%). With Cronbach’s alphas exceeding 0.82, our measures are highly reliable.<br />
4.3. Test of Hypotheses<br />
4.3.1. T-tests: H1 to H3<br />
To conduct the following analyses across the brand and generic categories, the data file was rearranged<br />
such that each single good and service studied became a unit. This enlarged the sample size to 2,349 (783<br />
respondents*3 goods/services) responses for the twelve products and services studied. To test hypotheses 1 to 3, we<br />
then conducted t-tests and found H1a, H2a, and H3a to be supported (for a summary of all results, see Table 4).<br />
Whereas the branded goods exhibit higher levels of generality, and physical and mental intangibility, than the<br />
generic counterparts, the reverse holds true for services. We then compared the branded and generic versions of<br />
each good/service to determine differences in physical and mental intangibility, and generality. All the branded<br />
91
goods exhibit higher levels of physical intangibility than the generic ones. Across the board, the branded goods also<br />
display higher levels of mental intangibility and generality. Unlike the branded goods, the branded services display<br />
lower levels of generality, physical and mental intangibility. The one exception, the Royal Bank checking account,<br />
exhibits higher levels of generality than the generic option.<br />
[Tables 2 to 4 about here]<br />
4.3.2. Regression analysis: H4 to H13<br />
We used multiple regressions to test the remaining hypotheses, applying the stepwise method in<br />
order to minimize multicollinearity effects. A summary of the results follows:<br />
INTANGIBILITY, KNOWLEDGE, AND INVOLVEMENT WITH DIFFICULTY OF EVALUATION (TABLE 5).<br />
Supporting H4a, H5a, H6a, H9a, and H12a, the results showed the three dimensions of intangibility,<br />
knowledge, and involvement, to be significantly related to difficulty of evaluation.<br />
INTANGIBILITY, KNOWLEDGE, AND INVOLVEMENT WITH PERCEIVED RISK (TABLE 6). We found<br />
support for H4b in that mental intangibility was positively related to all five types of risk, but only partial<br />
support for H5b since generality was only related to social and psychological risk. Contrary to H6b,<br />
physical intangibility was negatively related to social risk. The hypothesized relationship between<br />
knowledge and perceived risk also held for all types of risk, except social risk, providing strong support<br />
for H9b. Likewise for H12b, which was partially supported by virtue of the positive relationship between<br />
involvement and social and financial risk. For time risk, the relationship was found to be negative, in the<br />
opposite direction of what was hypothesized.<br />
MODERATING EFFECTS OF KNOWLEDGE AND INVOLVEMENT: INTANGIBILITY AND DIFFICULTY<br />
OF EVALUATION (TABLE 7). While knowledge interacted with mental intangibility to reduce difficulty of<br />
evaluation, involvement did not interact with any of the three dimensions of intangibility. Hence, H8a<br />
was partially supported, whereas H11a was not.<br />
MODERATING EFFECTS OF KNOWLEDGE AND INVOLVEMENT: INTANGIBILITY AND PERCEIVED<br />
RISK (TABLE 8). Overall, we found partial support for H8b and H11b. Knowledge moderates the<br />
relationship between mental intangibility and social and psychological risk; generality and time risk;<br />
physical intangibility and social risk. Likewise, involvement moderates the relationship between mental<br />
intangibility and social and psychological risk but, the moderating effect follows a different pattern when<br />
92
it comes to generality and physical intangibility. There, involvement moderates the relationship between<br />
generality and time and social risk; physical intangibility and four types of risk, except time risk.<br />
INTANGIBILITY AND DIFFICULTY OF EVALUATION: BRAND AND GENERIC PRODUCT CATEGORIES<br />
(TABLE 9). Since generality and physical intangibility have a greater effect on difficulty of evaluation in<br />
the generic context, as opposed to the branded one, H7a is partially supported.<br />
INTANGIBILITY AND PERCEIVED RISK: BRAND AND GENERIC PRODUCT CATEGORIES (TABLE 10).<br />
Looking at the magnitude of the standardized coefficients, we find that physical intangibility has a greater<br />
effect on social, financial, and performance risk at the generic level as opposed to the branded one. For<br />
generality, the coefficients at the generic level are all greater than those at the brand level, with the pattern<br />
repeated for all five types of risk. For mental intangibility, the effect is opposite to what had been<br />
hypothesized in H7b, as it appears to have a greater impact at the brand level as opposed to the generic<br />
one, with the exception of social risk where the comparison between generic and brand contexts is<br />
consistent with the hypothesis. Based on these findings, H7b is partially supported.<br />
MODERATING EFFECTS OF KNOWLEDGE AND INVOLVEMENT ON DIFFICULTY OF EVALUATION:<br />
BRAND AND GENERIC PRODUCT CATEGORIES (TABLE 11). Although we hypothesized that the<br />
moderating effects of knowledge and involvement would be greater in the generic context, this only held<br />
true for the moderating effect of involvement on the relationship between physical intangibility and<br />
difficulty of evaluation. Hence, we found no support for H10a and only partial support for H13a.<br />
MODERATING EFFECTS OF KNOWLEDGE AND INVOLVEMENT ON PERCEIVED RISK: BRAND AND<br />
GENERIC PRODUCT CATEGORIES (TABLE 12). We found partial support for H10b and H13b in that the<br />
moderating effects of knowledge were evident between physical intangibility/generality and social risk;<br />
generality and psychological risk; and physical/mental intangibility and performance risk. Moreover, we<br />
found the hypothesized moderating effects of involvement between physical/mental intangibility and time<br />
risk; mental intangibility and social risk; mental/physical intangibility and psychological risk; and<br />
mental/physical intangibility and financial risk.<br />
5. Discussion<br />
[Tables 5 to 12 about here]<br />
93
5.1. Intangibility: Brand and Generic Product Categories (H1, H2, and H3)<br />
The proposed differences between the generic and brand perspectives for the three dimensions of<br />
intangibility (H1 to H3) held true for services. Physical and mental intangibility for both the checking<br />
account and the pizzeria dinner were lower for the branded services as opposed to the generic ones. While<br />
generality showed the same result for the pizzeria dinner, the Royal Bank checking account appeared as<br />
more general than the generic option. Perhaps the specific nature of the service (i.e., checking account),<br />
along with the online purchase scenario, reduce the impact of the brand on consumers’ perceived<br />
generality compared with the generic option. Our reasoning follows from the fact that the Internet allows<br />
consumers to access detailed and specific information relating to products and services (Hoffman and<br />
Novak 1996).<br />
For almost all the products studied, the brand increased all three dimensions of consumers’<br />
perceived intangibility. A possible explanation for these unexpected results stems from the Internet’s<br />
ability to reduce generality and mental intangibility, especially in a generic context, by efficiently<br />
distributing product-related information to consumers (Hoffman and Novak 1996). All branded goods<br />
were also rated as more physically intangible than the generic counterparts. Regarding the internet<br />
browser, Goutaland (1999) found as physically intangible as other services (i.e., charter flight for a<br />
vacation). It is therefore not surprising to find the Internet browser mimicking the services studied on the<br />
brand-generic category comparison. Respondents perceived all three goods (i.e., a pair of Jeans, a<br />
computer, and a CD) as more physically intangible in a branded context as opposed to a generic one. This<br />
phenomenon may be partly due to the underlying impact of the Internet, which increases physical<br />
intangibility and prevents consumers from having a sensory experience. Respondents’ online purchase<br />
experience may also explain this finding for their online purchase frequency of generic products was<br />
higher than that of branded ones.<br />
5.2. Intangibility, Knowledge, and Involvement: Difficulty of Evaluation (H4a, H5a, and H6a)<br />
Finding support for H4a, H5a, and H6a, we conclude that the three dimensions of intangibility,<br />
knowledge, and involvement are positively related with difficulty of evaluation. The real contribution of<br />
94
these findings rests on the positive association between all three dimensions of intangibility and difficulty<br />
of evaluation, something not previously demonstrated.<br />
5.3. Intangibility, Knowledge, and Involvement: Perceived Risk (H4b, H5b, and H6b)<br />
Like Goutaland (1999), who found a positive relationship between mental intangibility and overall<br />
perceived risk, we uncovered links between mental intangibility and all five types of risk (H4b). The<br />
finding that generality only affects social and psychological risk (H5b) may also explain why it had no<br />
significant effect on overall perceived risk in Goutaland’s study. Though a positive relationship between<br />
physical intangibility and risk was expected (e.g., Mitchell and Greatorex 1993), Goutaland (1999) found<br />
no such association. Similar findings were reproduced here across all four types of risk, except social risk<br />
(H6b). Mental intangibility, which is more apt to impact perceived risk than generality or physical<br />
intangibility, should therefore be targeted to reduce perceived risk associated with virtual and traditional<br />
products/services.<br />
5.4. Intangibility, Difficulty of Evaluation, and Perceived Risk: Brand and Generic Product Categories<br />
(H7a and H7b)<br />
Since the features/characteristics of generic products/services are harder to describe and to<br />
physically grasp than those of branded ones, the effects of generality and physical intangibility on<br />
evaluation difficulty and risk were consistently greater in the generic context. The impact of mental<br />
intangibility on both difficulty of evaluation and perceived risk, was systematically greater at the brand<br />
level as opposed to the generic one. This finding is contrary to the general belief that brands tangibilize<br />
goods/services and thus help reduce evaluation difficulty and perceived risk.<br />
5.5. Knowledge and Involvement (H8 to H13)<br />
5.5.1. Knowledge and Involvement: Direct Relationships (H9a, H9b, H12a, and H12b)<br />
Similar to other studies, we found full or partial support for all the hypotheses linking knowledge<br />
and involvement with difficulty of evaluation and perceived risk (i.e., H9a, H9b, H12a, and H12b) (e.g.,<br />
Goutaland 1999). The relationship between involvement and time risk proved to be an important<br />
exception. Consumer’s willingness to spend time on purchase-related information search translates into<br />
95
greater involvement with the purchase and less time risk. Being of greater interest, we discuss the<br />
moderating effects of knowledge and involvement in more detail in the following sections.<br />
5.5.2. Moderating Effects of Knowledge and Involvement (H8a, H8b, H11a, and H11b)<br />
As expected, knowledge moderated the link between mental intangibility and difficulty of<br />
evaluation (H8a). This finding is in line with many scholars who agree that consumer knowledge is<br />
accumulated from product-related information search and experience (Anderson et al. 1979; Bettman and<br />
Park 1980). Associated with information search and product/service exposure, the mental dimension of<br />
consumer experience serves to make good/service evaluations less difficult. It is possible for physical<br />
intangibility and generality to not affect the evaluation process since neither increase consumers’<br />
processing efforts nor reduce their objective knowledge to perform the evaluation (Wendler 1983).<br />
Knowledge also moderated the relationships between: physical intangibility and social risk, generality<br />
and time risk, and mental intangibility and social and psychological risk (H8b). While consumers’<br />
objective knowledge may be present, their subjective knowledge (Cox 1967) appears to be affected by the<br />
intangibility of the good/service under consideration. Consequently, this subjective uncertainty results in<br />
greater perceived risk of the purchase decision.<br />
Although we expected involvement to moderate the relationship between intangibility and<br />
difficulty of evaluation, such was not the case (H11a). This result is contrary to other studies where<br />
involvement acted as moderator between physical intangibility and difficulty of evaluation (see<br />
McDougall 1987), and between mental intangibility, generality, and difficulty of evaluation (see<br />
Goutaland 1999). Since purchase involvement encompasses information search and time spent in making<br />
a correct decision, consumers probably spend more time and effort in screening information on the<br />
Internet (Clarke and Belk 1978). As a result, the proposed moderating effects of involvement are much<br />
less influential. Partially supporting H11b, involvement moderated the links between the various<br />
dimensions of intangibility and risk. It is said that the more involved a consumer is with a good/service,<br />
the more perceptive s/he will be regarding attribute differences, product importance, and brand<br />
96
commitment (Howard and Sheth 1969). Similarly, intangibility appears to influence consumers’ risk<br />
perceptions with physical intangibility having the most widespread effect.<br />
5.5.3. Moderating Effects of Knowledge and Involvement: Brand and Generic Product Categories (H10a,<br />
H10b, H13a, and H13b)<br />
Knowledge acted as a moderator between mental intangibility and difficulty of evaluation. Since<br />
this moderating effect was greater at the brand level than the generic one, H10a was not supported.<br />
Finding no support for our hypothesis (H10a), led us to speculate that respondents’ prior experience with<br />
the branded and generic products/services chosen was enough to suppress any brand/generic differences,<br />
especially those relating to difficulty of evaluation. Respondents’ level of involvement with the chosen<br />
goods/services may have been too weak for the moderating effect to surface in the brand/generic context.<br />
Thus, H13a was partially supported with involvement only moderating the link between physical<br />
intangibility and difficulty of evaluation, and this effect being greater in the generic context.<br />
Contrary to difficulty of evaluation, respondents’ level of perceived risk vis-à-vis the chosen<br />
goods/services was ubiquitous. This led to us finding partial support for both H10b and H13b with<br />
knowledge and involvement acting as moderators between various dimensions of intangibility and risk,<br />
and the effects being greater in the generic context. These results are to be expected for brands are known<br />
to reduce perceived risk (Roselius 1971; Sheth and Venkatesan 1968; Wernerfelt 1988).<br />
6. Theoretical and Managerial Implications<br />
Since the tested model shows that the three dimensions of intangibility all affect consumer<br />
difficulty of evaluation and perceived risk, marketers should rate their goods and services on an<br />
intangibility scale and/or position their goods/services on an intangibility map, determine the most<br />
influential dimension of intangibility, and ultimately design marketing strategies that will lessen<br />
perceived risk and simplify evaluations. In our study, for example, the Internet browser was perceived as<br />
more physically, as opposed to mentally, intangible suggesting that marketers could lessen consumers’<br />
perceived risk and evaluation difficulty by decreasing the perceived physical intangibility of their<br />
offerings. For other goods/services, marketers should also bear in mind that mental intangibility, along<br />
97
with generality, may also affect consumers’ perceptions of risk and evaluation difficulty. Hence, their<br />
corresponding marketing strategies should decrease, or at least, not increase mental intangibility and<br />
generality.<br />
An important theoretical contribution of this study is that brands function to reduce intangibility in<br />
both offline and online purchase situations. While the branding strategies employed by service companies<br />
are still useful when moving into the world of e-commerce, such is not the case for products purchased<br />
online. In addition, the five types of perceived risk turn out to have different relationships with the<br />
different variables studied here. For example, involvement interacts with mental intangibility to reduce<br />
social and psychological risk, while knowledge interacts with generality to increase perceived time risk.<br />
By mapping their goods/services according to the different types of risk associated with each, marketers<br />
will be better able to communicate their risk-reduction strategies.<br />
The appearance of very intangible goods and very tangible services brings forth challenges for all<br />
marketers as to how best to communicate the perceived intangible attributes of a virtual good/service,<br />
how to position the product/service, and how to reduce consumers’ purchase-related perceived risks and<br />
evaluation difficulty. These challenges suggest that branded and generic goods/services, and their<br />
intangibility-related consequences, should be studied in greater detail.<br />
7. Limitations and Directions for Future Research<br />
Even though students are generally familiar with online purchases, a more diverse sample with<br />
online purchase experience should be tapped. More variety in the goods/services used would also help<br />
matters especially since the intangibility exhibited by some virtual products (e.g., Internet browser) is<br />
similar to that displayed by services. Generally, the distribution of online purchase frequency of branded<br />
products was considerably lower than that of generic products, which may explain why the means of<br />
branded products were higher than those of generic products. Future studies should thus control for these<br />
differences in distribution.<br />
This study is meaningful in that it confirms the three-dimensional intangibility construct and finds<br />
brands to be major intangibility-reducers especially for services. While brands reduce consumers’<br />
98
perceived physical intangibility, mental intangibility, and generality for services such is not the case for<br />
goods. Future research should consider how the Internet will affect consumers’ perceived intangibility of<br />
‘virtual’ goods/services be they branded or not. Brands also reduce consumers’ perceived evaluation<br />
difficulty and risk, especially for goods/services with high perceived physical intangibility and generality.<br />
Since mental intangibility associated with branded goods/services only helps reduce perceived social risk,<br />
future research should explore whether other factors influence mental intangibility. While brands reduce<br />
the moderating effects of knowledge and involvement, this finding does not hold true in all cases. Future<br />
research should thus explore the reasons behind these results by studying a varied array of goods/services.<br />
Knowledge and involvement also directly affect consumer evaluation difficulty and perceived risk and act<br />
as moderators. Future research should consider the moderating effects of knowledge and involvement<br />
while controlling for online offerings (i.e., online goods/services held as covariates).<br />
References<br />
Alba JW, Hutchinson JW. Dimensions of consumer expertise. Journal of Consumer Research<br />
1987;13(March):411-454.<br />
Anderson RD, Engledow JL, Becker H. Evaluating the relationships among attitude toward business<br />
product <strong>satisfaction</strong>, experience, and search effort. Journal of Marketing Research<br />
1979;16(August):394-400.<br />
Barach JA. Advertising effectiveness and risk in the consumer decision process. Journal of Marketing<br />
Research 1969;August:314-20.<br />
Bateson JEG. Why we need service marketing. Conceptual and Theoretical Developments in Marketing,<br />
Proceedings Series of the American Marketing Association. Chicago, IL: American Marketing<br />
Association, 1979. p. 131-146.<br />
Bauer RA. Consumer behavior at risk taking. In: Cox DF, editor. Risk Taking and Information Handling<br />
in Consumer Behavior. Cambridge, MA: Harvard University Press. 1960. p. 23-33.<br />
Bauer RA. Risk handling in drug adoption: the role of company preference. Public Opinion Quarterly<br />
1961(Winter):546-559.<br />
Bebko CP. Service intangibility and its impact on consumer expectations of service quality.<br />
Journal of Services Marketing 2000;14(1):9-26.<br />
Berry LL. Services marketing is different. Business 1980;(May-June):16-23.<br />
Berry LL. Cultivating service brand equity. Journal of the Academy of Marketing Science<br />
2000;28(1):128-37.<br />
99
Berry LL, Clark T. Four ways to make services more tangible. Business 1986;36(4):53-54.<br />
Bettman JR. Consumer psychology. In: Lutz R, editor. Advances in Consumer Research, vol. 13.<br />
Provo, UT: Association for Consumer Research, 1986. p. 257-289.<br />
Bettman JR, Park CW. Effects of prior knowledge and experience and phases of the choice<br />
process on consumer decision process: A protocol analysis. Journal of Consumer Research<br />
1980;7(3):234-248.<br />
Biehal GJ. Consumers’ prior experiences and perceptions in auto repair choice. Journal of<br />
Marketing 1983;47(Summer):82-91.<br />
Bloch PH. An exploration into scaling of consumers’ involvement with a product class. In:<br />
Monroe KB, editor. Advances in Consumer Research, vol. 8. Provo, UT: Association for<br />
Consumer Research, 1981. p. 61-65.<br />
Breivik E, Troye SV, Olsson UH. Dimensions of intangibility and their impact on product<br />
evaluation. Working Paper Poster Session. Montreal, Canada: Association for Consumer<br />
Research, 1998.<br />
Brucks M. The effects of product knowledge on information search behavior. Journal of<br />
Consumer Research 1985;12(June):1-16.<br />
Brucks M. A Typology of Consumer Knowledge Content. In: Lutz R, editor. Advances in<br />
Consumer Research, vol. 13. Provo, UT: Association for Consumer Research, 1986. p. 58-<br />
63.<br />
Brucks M, Mitchell AA. Knowledge structures, production systems and decision structures. In:<br />
Monroe KB, editor. Advances in Consumer Research, vol. 8. Provo, UT: Association for<br />
Consumer Research, 1981. p. 750-57.<br />
Clarke K, Belk RW. The effect of product involvement and task definition on anticipated<br />
consumer effort. In: Hunt K, editor. Advances in Consumer Research, vol. 5. Provo, UT:<br />
Association for Consumer Research, 1978. p. 303-18.<br />
Cox DF. Risk Taking and Information Handling in Consumer Behavior. Boston, MA: Harvard<br />
University Press, 1967.<br />
Cox DF, Rich SV. Perceived risk and consumer decision making – the case of telephone<br />
shopping. In: Cox DF, editor. Risk Taking and Information Handling in Consumer Behavior.<br />
Cambridge, MA: Harvard University Press. 1967. p. 487-506.<br />
Cunningham SM. The major dimensions of perceived risk. In: Cox DF, editor. Risk Taking and<br />
Information Handling in Consumer Behavior. Cambridge, MA: Harvard University Press.<br />
1967. p. 23-33.<br />
Dubé-Rioux L, Regan DT, Schmitt BH. The cognitive representation of services varying in<br />
concreteness and specificity. In: Goldberg M, Gorn G, Pollay R, editors. Advances in<br />
100
Consumer Research, vol. 17. Provo, UT: Association for Consumer Research, 1981. p. 861-<br />
865.<br />
Edgett S, Parkinson S. Marketing for service industries – a review. The Service Industries<br />
Journal 1993;13(9):19-36.<br />
Engel F, Blackwell RD. Consumer Behavior, 4 th ed. New York, NY: The Dryden Press.1982.<br />
Erdem T. 1998. An empirical analysis of umbrella branding. Journal of Marketing Research<br />
1998;35(3):339-51.<br />
Goutaland C. Product and service intangibility: a study of its dimensions and consequences on<br />
product/service evaluation. Unpublished Master’s Thesis, Concordia University, Montreal,<br />
Canada. 1999.<br />
Havlena WJ, DeSarbo WS. On the measurement of perceived consumer risk. Decision Sciences<br />
1990;22:927-939.<br />
Hirschman EC. Attributes of attributes and layers of meaning. In: Monroe KB, editor. Advances<br />
in Consumer Research, vol. 8. Provo, UT: Association for Consumer Research, 1981. p. 7-<br />
12.<br />
Hoffman DL, Novak TP. Marketing in hypermedia computer-mediated environments:<br />
conceptual foundations. Journal of Marketing 1996;60(3):50-53.<br />
Howard JA. Consumer Behavior: Application of Theory. New York, NY: John Wiley. 1977.<br />
Howard JA, Sheth JN. The Theory of Buyer Behavior. New York, NY: John Wiley. 1969.<br />
Jacoby J, Kaplan L. The components of perceived risk. In: Venkatesan M, editor. Advances in<br />
Consumer Research, Proceedings of the 1972 Conference. Provo, UT: Association for<br />
Consumer Research, 1981. p. 382-393.<br />
Johnson EJ, Fornell C. The nature and methodological implications of the cognitive<br />
representation of products. Journal of Consumer Research 1987;14(September):214-228.<br />
Johnson EJ, Russo EJ. Product familiarity and learning new information. Journal of Consumer<br />
Research 1984;11(June):542-550.<br />
Kaplan L, Szybillo G, Jacoby J. Components of perceived risk in product purchase: a crossvalidation.<br />
Journal of Applied Psychology 1974;59:287-291.<br />
Kotler P, Bowen J, Makens J. Marketing for Hospitality and Tourism. Upper Saddle River, NJ:<br />
Prentice-Hall. 1999.<br />
Krugman HE. Memory without recall, exposure without perception. Journal of Advertising<br />
Research 1977;17(August):7-12.<br />
101
Laroche M, Bergeron J, Goutaland C. A three-dimensional scale of intangibility. Journal of<br />
Service Research 2001;4(1):26-38.<br />
Laurent G, Kapferer J-N. Measuring consumer involvement profiles. Journal of Marketing<br />
Research 1985;22(February):41-53.<br />
Lovelock C. Services Marketing: People, Technology, Strategy. Fourth edition, Upper Saddle<br />
River, NJ: Prentice-Hall. 2001.<br />
McDougall GH. Determinants of ease of evaluation: products and services compared. Canadian<br />
Journal of Administrative Sciences 1987;4(4):426-446.<br />
McDougall GH, Snetsinger DW. The intangibility of services: measurement and competitive<br />
perspectives. Journal of Services Marketing 1990;4(4):27-40.<br />
Mitchell VW, Greatorex M. Risk perception and reduction in the purchase of consumer services.<br />
The Service Industries Journal 1993;13(4):179-200.<br />
Mittal BL. A theoretical analysis of two recent measures of involvement. In: Wilkie WL, editor.<br />
Advances in Consumer Research, vol. 16. Provo, UT: Association for Consumer Research,<br />
1989. p. 697-702.<br />
Mittal BL, Baker J. Advertising strategies for hospitality services. Cornell Hotel and Restaurant<br />
Administration Quarterly 2002;43(2):51-63.<br />
Murray KB. A test of services marketing theory: consumer information acquisition activities.<br />
Journal of Marketing, 1991;55:10-25.<br />
Murray KB, Schlacter JL. The impact of services versus goods on consumer’s assessment of<br />
perceived risk and variability. Journal of the Academy of Marketing Science 1990;18(1):51-<br />
65.<br />
Oliver RL, Bearden WO. The role of involvement in <strong>satisfaction</strong> processes. Advances in<br />
Consumer Research, vol. 10. Provo, UT: Association for Consumer Research, 1983. p. 250-<br />
255.<br />
Park CW, Mothersbaugh DL, Feick L. Consumer knowledge assessment. Journal of Consumer<br />
Research 1994:21(June):71-82.<br />
Perry M, Hamm BC. Canonical analysis of relations between socioeconomic risk and personal<br />
influence in purchase decisions. Journal of Marketing Research 1968;6(August):351-354.<br />
Rathmell JM. Marketing in the Service Sector. Cambridge, MA: Winthrop Publishers. 1974.<br />
Reddy AC, Buskirk BD, Kaicker A. Tangibilizing the intangibles: some strategies for service<br />
marketing. Journal of Services Marketing 1993;7(3):13-17.<br />
102
Roselius TR. Consumer rankings of risk reduction methods. Journal of Marketing<br />
1971;31(1):56-61.<br />
Rust RT, Zahorik AJ, Keiningham TL. Readings in Service Marketing. New York, NY: Harper<br />
Collins College Publishers. 1996.<br />
Sheth J, Venkatesan M. Risk reduction processes in repetitive consumer behavior. Journal of<br />
Marketing Research 1968;(August):307-10.<br />
Shostack GL. Breaking free from product marketing. Journal of Marketing 1977;(April):73-80.<br />
Stone RN, Grønhaug K. Perceived risk: further considerations for the marketing discipline.<br />
European Journal of Marketing 1993;27(3):39-50.<br />
Surprenant CF, Solomon MR. Predictability and personalization in the service encounter. Journal<br />
of Marketing 1987;51(April):86-96.<br />
Van Dierdonck R. Success strategies in a service economy. European Management Journal<br />
1992;10(3):365-364.<br />
Wendler ER. Consumer Information and Confidence: Moderating Effects of Perceived<br />
Comprehension and Risk. In: Bagozzi R, Tybout A, editors. Advances in Consumer<br />
Research, vol. 10. Provo, UT: Association for Consumer Research, 1983. p. 364-369.<br />
Wernefelt B. Umbrella branding as a signal of new product quality: an example of signaling by<br />
posting a bond. Rand Journal of Economics 1988;19(4):458-66.<br />
Zaichkowsky JL. Measuring the involvement construct. Journal of Consumer Research<br />
1985;12(December):341-352.<br />
Zeithaml VA. How consumer evaluation processes differ between goods and services. In:<br />
Donnelly JH Jr, George WR, editors. Marketing of Services, AMA’s Special Conference on<br />
Services Marketing, American Marketing Association, 1981. p. 186-190.<br />
Zeithaml VA, Berry LL, Parasuraman A. Problems and strategies in services marketing. Journal<br />
of Marketing 1985;49(Spring):33-46.<br />
Zeithaml VA, Bitner MJ. Services Marketing: Integrating Customer Focus Across Firms, New<br />
York, NY: McGraw-Hill. 2000.<br />
103
Questionnair<br />
es<br />
Questionnaire<br />
1<br />
Questionnaire<br />
2<br />
Questionnaire<br />
3<br />
Questionnaire<br />
4<br />
Questionnaire<br />
5<br />
Questionnaire<br />
6<br />
Questionnaire<br />
7<br />
Questionnaire<br />
8<br />
Questionnaire<br />
9<br />
Questionnaire<br />
10<br />
Questionnaire<br />
11<br />
Questionnaire<br />
12<br />
Questionnaire<br />
13<br />
Questionnaire<br />
14<br />
Questionnaire<br />
15<br />
Questionnaire<br />
16<br />
Table 1<br />
The sixteen versions of the questionnaire<br />
Products and service mix included in the<br />
questionnaire<br />
Online or<br />
offline<br />
purchase<br />
Brand or<br />
generic<br />
category<br />
Levi’s jeans, Pizza Hut’s pizza, Netscape software Online Brand<br />
IBM computer, Royal Bank checking account,<br />
Beatles’ CD<br />
Online Brand<br />
Pair of jeans, Pizzeria dinner, Internet browser Online Generic<br />
Computer, Checking account, CD Online Generic<br />
Levi’s jeans, Pizza Hut’s pizza, Netscape software Offline Brand<br />
IBM computer, Royal Bank checking account,<br />
Beatles’ CD<br />
Offline Brand<br />
Pair of jeans, Pizzeria dinner, Internet browser Offline Generic<br />
Computer, Checking account, CD Offline Generic<br />
Netscape software, Pizza Hut’s pizza, Levi’s jeans Online Brand<br />
Beatles’ CD, Royal Bank checking account, IBM<br />
Computer<br />
Online Brand<br />
Internet browser, Pizzeria dinner, Pair of jeans Online Generic<br />
CD, Checking account, Computer Online Generic<br />
Netscape software, Pizza Hut’s pizza, Levi’s jeans Offline Brand<br />
Beatles’ CD, Royal Bank checking account, IBM<br />
computer<br />
Offline Brand<br />
Internet browser, Pizzeria dinner, Pair of jeans Offline Generic<br />
CD, Checking account, Computer Offline Generic<br />
Table 2<br />
Number of respondents according to online/offline and brand/generic categories<br />
Generic Brand Total<br />
104
Online<br />
Offline<br />
Total<br />
196 195 391<br />
195 197 392<br />
391 392 783<br />
105
Table 3<br />
Results of factor analysis<br />
Construct Items % of<br />
Varianc<br />
Intangibilit<br />
y<br />
Perceived<br />
risk<br />
Difficulty of<br />
evaluation<br />
Knowledge<br />
Involvemen<br />
t<br />
Physical intangibility (factor 1)<br />
PHYS11: I can physically grasp ____<br />
PHYS12: _____ are physically very tangible<br />
PHYS10: ____ is very easy to see and touch<br />
Mental intangibility (factor 2)<br />
MENTAL20: This is not the sort of ___ that is easy to picture<br />
MENTAL19: This is a difficult ____ to think about<br />
MENTAL18: I need more information about ______ to get a clear idea (image) of what it is<br />
Generality (factor 3)<br />
GEN14: It is not difficult to give a precise description of a ____<br />
GEN15: It is easy to describe many features related to a ____<br />
GEN13: I could easily explain many features associated with ____<br />
Time risk (factor 4)<br />
TRISK38: Purchasing a ____ will involve important time losses<br />
TRISK37: Purchasing a ___ will lead to an inefficient use of my time<br />
TRISK39: The demands on my schedule are such that purchasing a ___ concerns me because it<br />
would impose even greater time pressure on me.<br />
Social risk (factor 5)<br />
SRISK44: If I used a ____, I would be held in higher esteem by my family<br />
SRISK43: If I used a ____, I would be held in higher esteem by my friends<br />
SRISK45: Purchasing a ____ within the next twelve months would cause me to be considered as<br />
foolish by some people whose opinion I <strong>value</strong><br />
Performance risk (factor 6)<br />
PRISK41: As I consider the purchase of a ___ in the near future, I worry about whether it will<br />
really “perform” as well as it is supposed to<br />
PRISK42: The thought of purchasing a _____ causes me to be concerned for how really reliable<br />
that product will be<br />
PRISK40: If I were to purchase a ____ within the next twelve months, I would be concerned that<br />
the brand will not provide the level of benefits that I would be expecting<br />
Psychological risk (factor 7)<br />
YRISK48: The thought of purchasing a ____ causes me to experience unnecessary tension<br />
YRISK47: The thought of purchasing a ____ makes me feel psychologically uncomfortable<br />
YRISK46: The thought of purchasing a ____ gives me a feeling of unwanted anxiety<br />
Financial risk (factor 8)<br />
FRISK35: Purchasing a ___ could involve important financial losses<br />
FRISK34: If I bought a ___ for myself within the next twelve months, I would be concerned that<br />
this financial investment would be wise<br />
FRISK36: If I bought a ___ for myself within the next twelve months, I would be concerned that<br />
I would not get my money’s worth<br />
Difficulty of evaluation (factor 9)<br />
Given that I have to buy a ___ , evaluating a ___ will be:<br />
DIFF24: Very complicated to not complicated at all<br />
DIFF23: Very complex to very simple<br />
DIFF22: Very problematic to not problematic at all<br />
DIFF21: Very difficult to very easy<br />
Knowledge (factor 10)<br />
KNOW6: Compared to experts in this area, my knowledge of a ______ is<br />
KNOW4: Would you consider yourself uninformed or informed about a____<br />
KNOW3: In general, my knowledge of a ____ is<br />
KNOW5: Compared to my friends and acquaintance, my knowledge of a ____ is<br />
INFO8: The global information search I have performed on ______ is<br />
EXP9: I do not have much experience purchasing _____<br />
EXP7: I use ___ (never to very often)<br />
Involvement (factor 11)<br />
INV26: I perceive a ____ is: Very significant to very insignificant<br />
INV25: I perceive a ____ is: Very important to very unimportant<br />
INV27: I perceive a ____ is: Very valuable to not valuable at all<br />
INV28: A ____ is: Matters a lot to me to does not matter to me<br />
106<br />
e<br />
5.64<br />
4.13<br />
2.60<br />
25.46<br />
6.79<br />
2.42<br />
2.31<br />
1.91<br />
5.10<br />
16.40<br />
9.11<br />
Loadin<br />
g<br />
.941<br />
.898<br />
.797<br />
.879<br />
.873<br />
.663<br />
.925<br />
.907<br />
.850<br />
.970<br />
.933<br />
.775<br />
.968<br />
.960<br />
.548<br />
.939<br />
.814<br />
.596<br />
.919<br />
.914<br />
.913<br />
.900<br />
.863<br />
.758<br />
.942<br />
.936<br />
.902<br />
.861<br />
.842<br />
.835<br />
.807<br />
.800<br />
.719<br />
.583<br />
.536<br />
.951<br />
.941<br />
.923<br />
.838<br />
Alph<br />
a<br />
.83<br />
.91<br />
.87<br />
.94<br />
.87<br />
.91<br />
.97<br />
.91<br />
.95<br />
.89<br />
.94
INV29: I perceive a ____ is: Means a lot to me to means nothing to me .828<br />
Extraction Method: Principal Component Analysis; Rotation: Oblimin with Kaiser Normalization.<br />
107
Table 4<br />
Summary of results<br />
108
Hypotheses Results<br />
H1: The degree of generality associated with generic category- H1 is supported for services<br />
level choices is higher than it is for brand-level choices. H1 is not supported for goods<br />
H2: The degree of mental intangibility associated with H2 is supported for services<br />
generic category-level choices is higher than it is for brandlevel<br />
choices.<br />
H2 is not supported for goods<br />
H3: The degree of physical intangibility associated with<br />
generic category-level choices is a) higher than it is for<br />
brand-level choices of services and b) similar to it for<br />
brand-level choices of products.<br />
H3a is supported for services<br />
H3b is not supported for goods<br />
H4: The more mentally intangible a product/service is, a) the more H4a is supported<br />
difficult it is to evaluate and b) the more risky it is perceived. H4b is supported (all 5 types of risk) �<br />
H5: The more general a product/service is, a) the more difficult it is H5a is supported<br />
to evaluate and b) the more risky it is perceived. H5b is partially supported (social and psychological risk) �<br />
H6: The more physically intangible a product/service is, a) the H6a is supported<br />
more difficult it is to evaluate and b) the more risky it is perceived. H6b is not supported<br />
H7: The impact of intangibility on a) difficulty of evaluation and b) H7a is Physical intangibility �<br />
perceived risk is greater for generic-category level choice than partially Generality �<br />
brand-level choice.<br />
supported Mental intangibility �<br />
H7b is Physical intangibility<br />
partially (social, financial, and performance risk) �<br />
supported Generality (all 5 types of risk) �<br />
Mental intangibility (social risk) �<br />
H8: Knowledge moderates the relationships between the three H8a is Physical intangibility �<br />
dimensions of intangibility (i.e., generality, physical intangibility partially Generality �<br />
and mentally intangibility) and a) difficulty of evaluation and b)<br />
perceived risk.<br />
supported<br />
H8b is<br />
Mental intangibility �<br />
Physical intangibility (social risk) �<br />
partially Generality (time risk) �<br />
supported Mental intangibility (social and psychological risk) �<br />
H9: The more knowledgeable a consumer perceives himself to be H9a is supported<br />
regarding a product/service a) the less difficult it is to evaluate it<br />
and b) the less risky it is perceived.<br />
H9b is partially supported<br />
(psychological, financial, performance, and time risk) �<br />
H10: The moderating effects of knowledge on a) difficulty of H10a is not supported<br />
evaluation and b) perceived risk at the generic level are greater than<br />
those at the brand level.<br />
H10b is<br />
partially<br />
supported<br />
Physical intangibility (social and performance risk) �<br />
Generality (social and psychological risk) �<br />
Mental intangibility (performance risk) �<br />
H11: Involvement moderates the relationships between the three<br />
dimensions of intangibility (i.e., generality, physical intangibility,<br />
and mental intangibility) and a) difficulty of evaluation and b)<br />
perceived risk.<br />
H12: The more involving a product/service is for a consumer, a)<br />
the more difficult it is to evaluate it and b) the more risky it is<br />
perceived.<br />
H13: The moderating effects of involvement on a) difficulty of<br />
evaluation and b) perceived risk at the generic level are greater than<br />
those at the brand level.<br />
�: hypothesis supported �: hypothesis not supported<br />
H 11a is not supported<br />
H11b is<br />
partially<br />
supported<br />
Physical intangibility (social, psychological, financial,<br />
and performance risk) �<br />
Generality (social and time risk) �<br />
Mental intangibility (social and psychological risk) �<br />
H12a is supported<br />
H12b is partially supported (social and financial risk) �<br />
H13a is Physical intangibility �<br />
partially Generality �<br />
supported Mental intangibility �<br />
H13b is Physical intangibility<br />
partially (psychological, financial, and time risk ) �<br />
supported Generality �<br />
Mental intangibility<br />
(social, psychological, financial, and time risk) �<br />
109
Table 5<br />
Stepwise multiple regressions (H4a, H5a, H6a, H9a, and H12a)<br />
Intangibility, knowledge, and involvement with difficulty of evaluation<br />
Standardized<br />
Coefficients<br />
T-Values Level of<br />
Significance<br />
(Constant) 17.862 .000<br />
Physical<br />
intangibility<br />
.051 2.157 .015<br />
Mental<br />
intangibility<br />
.079 3.600 .000<br />
Generality .178 6.551 .000<br />
Knowledge -.207 -8.429 .000<br />
Involvement .094 4.426 .000<br />
Table 6<br />
Stepwise multiple regressions (H4b, H5b, H6b, H9b, and H12b)<br />
Intangibility, knowledge, and involvement with perceived risk<br />
Time risk<br />
Social risk<br />
Psychological risk<br />
Adjusted R 2 = .147<br />
F = 81.85<br />
Financial risk<br />
Performance risk<br />
Adjusted R 2 = .066 Adjusted R<br />
F = 56.74<br />
2 = .032 Adjusted R<br />
F = 20.31<br />
2 = .035 Adjusted R<br />
F = 29.58<br />
2 = .049 Adjusted R<br />
F = 41.23<br />
2 = .034<br />
F = 42.05<br />
Physical intangibility -.092*<br />
Mental intangibility .118 * .160* .137* .134* .120*<br />
Generality .067** .052***<br />
Knowledge -.142* -.045*** -.161* -.110*<br />
Involvement -.094* .099* .090*<br />
Level of significance: * p ≤.001, ** p≤.01, *** p≤.05<br />
Table 7<br />
Stepwise multiple regressions (H8a and H11a)<br />
Moderating effects of knowledge and involvement: intangibility and difficulty of evaluation<br />
110
(Constant)<br />
Knowledge<br />
Knowledge and<br />
Mental<br />
intangibility<br />
Standardized<br />
Coefficients<br />
T-Values Level of<br />
Significance<br />
13.014 .000<br />
-.140 -3.811 .000<br />
-.112 -2.450 .007<br />
111<br />
Adjusted R 2 = .149<br />
F = 69.36
Table 8<br />
Stepwise multiple regressions (H8b and H11b)<br />
Moderating effects of knowledge and involvement: intangibility and perceived risk<br />
Time risk<br />
Social risk<br />
Psychological risk<br />
Financial risk<br />
Performance risk<br />
Adjusted R 2 = .077 Adjusted R<br />
F = 33.88<br />
2 = .05 Adjusted R<br />
F = 16.42<br />
2 = .045 Adjusted R<br />
F = 14.73<br />
2 = .059 Adjusted R<br />
F = 30.24<br />
2 = .041<br />
F = 21.32<br />
Knowledge -.204* -.194* -.134* -.160* -.102*<br />
Knowledge and<br />
Physical intangibility<br />
.296**<br />
Knowledge and<br />
Mental intangibility<br />
.296* .130**<br />
Knowledge and<br />
Generality<br />
.086***<br />
Involvement .089** .247* .198* .210* .110*<br />
Involvement and<br />
Physical intangibility<br />
-.193* -.208* -.263* -.253*<br />
Involvement and<br />
Mental intangibility<br />
-.222* -.135**<br />
Involvement and<br />
Generality<br />
-.292* .097*<br />
Level of significance: * p≤.001, ** p≤.01, *** p≤.05<br />
Table 9<br />
Stepwise multiple regressions (H7a)<br />
Intangibility and difficulty of evaluation: brand and generic product categories<br />
Generic<br />
Adjusted R 2 = .122<br />
F = 82.41<br />
Physical intangibility .064***<br />
Difficulty of evaluation<br />
Brand<br />
Adjusted R 2 = .141<br />
F = 97.57<br />
Mental intangibility .168*<br />
Generality .311* .267*<br />
Level of significance: * p≤.001, ** p≤.01, *** p≤.05<br />
112
Physical<br />
intangibility<br />
Mental<br />
intangibility<br />
Table 10<br />
Stepwise multiple regressions (H7b)<br />
Intangibility and perceived risk: brand and generic product categories<br />
Generic<br />
Adjusted<br />
R 2 = .036<br />
F = 22.86<br />
Time risk Social risk Psychological risk Financial risk Performance risk<br />
Brand<br />
Adjusted<br />
R 2 = .035<br />
F = 22.37<br />
Generic<br />
Adjusted<br />
R 2 = .04<br />
F = 17.12<br />
-<br />
.107**<br />
Brand<br />
Adjusted<br />
R 2 = .013<br />
F = 8.81<br />
-<br />
.064***<br />
Generic<br />
Adjusted<br />
R 2 = .043<br />
F = 27.59<br />
Brand<br />
Adjusted<br />
R 2 = .029<br />
F = 36.04<br />
Generic<br />
Adjusted<br />
R 2 = .039<br />
F = 16.76<br />
Brand<br />
Adjusted<br />
R 2 = .037<br />
F = 45.56<br />
Generic<br />
Adjusted<br />
R 2 = .025<br />
F = 11.06<br />
Brand<br />
Adjusted<br />
R 2 = .041<br />
F = 26.12<br />
-.089** -.091** . 060***<br />
.124* .135* .161* .130* .127* .173* .126* .193* .112* .176*<br />
Generality .104* . 086** .127* .123* .159* .126*<br />
Level of significance: * p≤.001, ** p≤.01, *** p≤.05<br />
Table 11<br />
Stepwise multiple regressions (H10a and H13a)<br />
Moderating effects of knowledge and involvement on difficulty of evaluation:<br />
brand and generic product categories<br />
Generic<br />
Adjusted R 2 = .191<br />
F = 56.21<br />
Knowledge -.311*<br />
Knowledge and<br />
Physical intangibility<br />
Knowledge and<br />
Mental intangibility<br />
Knowledge and<br />
Generality<br />
Involvement .181*<br />
Involvement and<br />
-.207**<br />
Physical intangibility<br />
Difficulty of evaluation<br />
Brand<br />
Adjusted R 2 = .151<br />
F = 70.65<br />
-.144*<br />
Involvement and<br />
Mental intangibility<br />
Involvement and<br />
Generality<br />
Level of significance: * p≤.001, ** p≤.01, *** p≤.05<br />
113
114
Table 12<br />
Stepwise multiple regressions (H10b and H13b)<br />
Moderating effects of knowledge and involvement on perceived risk:<br />
Generic<br />
Adjusted<br />
R 2 = .086<br />
F = 19.35<br />
brand and generic product categories<br />
Time risk Social risk Psychological risk Financial risk Performance risk<br />
Brand<br />
Adjusted<br />
R 2 = .074<br />
F = 32.26<br />
Generic<br />
Adjusted<br />
R 2 = .064<br />
F = 12.46<br />
Brand<br />
Adjusted<br />
R 2 = .049<br />
F = 13.01<br />
Generic<br />
Adjusted<br />
R 2 = .069<br />
F = 13.43<br />
Brand<br />
Adjusted<br />
R 2 = .029<br />
F = 36.04<br />
Generic<br />
Adjusted<br />
R 2 = .097<br />
F = 21.87<br />
Brand<br />
Adjusted<br />
R 2 = .043<br />
F = 27.21<br />
Generic<br />
Adjusted<br />
R 2 = .061<br />
F = 19.99<br />
Brand<br />
Adjusted<br />
R 2 = .063<br />
F = 27.40<br />
Knowledge -.153* -.200* -.152** -.195* -.136* -.243* -.088** -.113***<br />
Knowledge and<br />
Physical intangibility<br />
-.113* -.066***<br />
Knowledge and<br />
Mental intangibility<br />
.130* .284* .301*<br />
-<br />
.141****<br />
Knowledge and<br />
Generality<br />
.136* .064***<br />
Involvement .187* -.147* .246* .276* .250* .335*<br />
Involvement and<br />
Physical intangibility<br />
-.415* -.101** -.344* -.316* -.238*<br />
Involvement and<br />
Mental intangibility<br />
Involvement and<br />
Generality<br />
-.156*** -.371* -.133** -.187**<br />
-<br />
.139****<br />
Level of significance: * p≤.001, ** p≤.01, *** p≤.05, **** p≤.10<br />
115
Intangibility<br />
Physical intangibility<br />
Mental intangibility<br />
Generality<br />
Legend:<br />
Positive effects (H4, H5, H6, and H12)<br />
Figure 1<br />
Proposed model<br />
Knowledge<br />
Involvement<br />
Moderating effects of knowledge and involvement (H8 and H11)<br />
Negative effects (H9)<br />
Difficulty of<br />
evaluation<br />
Perceived risk<br />
Shaded areas represent differences between brand and generic perspectives (H1, H2, H3, H7, H10, and<br />
H13)<br />
116
Exploring the WOW in Online Auction Feedback<br />
Bruce D. Weinberg, Bentley University<br />
Lenita Davis , The University of Alabama<br />
ABSTRACT<br />
Ebay, the leading online-retailer, has captured the fascination of both American consumers and<br />
corporations, as it has garnered approximately 45% of all gross online retail sales, $5.3 billion<br />
out of $11.9 billion, during the first quarter of 2003. George Day has described eBay “as perhaps<br />
the most successful of all the breakthrough applications on the Internet.” While there are many<br />
reasons cited for the success of online auctions, the reputation system, or Feedback Forum as it is<br />
called on eBay, has been considered the most critical element. Some auction studies have<br />
investigated the impact of seller-reputation on consumer/bidder behavior and auction results;<br />
however, they have considered only aggregate or summary measures of reputation, such as the<br />
overall feedback rating. This research extends our understanding of online-auction reputation<br />
systems by a) classifying online-auction feedback as a type of “word-of-web” (WOW),<br />
specifically, rating-and-review word-of-web, b) identifying a property that is unique to online<br />
auctions -- “bidirectionality,” and c) discovering that, in addition to the overall feedback rating,<br />
consumers/bidders process several feedback profile elements/details, such as individual-auction<br />
feedback reviews and comments, when evaluating sellers and making bidding decisions.<br />
INTRODUCTION<br />
Ebay, the leading online-retailer, has captured the fascination of both American consumers and<br />
corporations (Adler 2002). With 68.8 million members, it has garnered approximately 45% of all<br />
gross online retail sales, $5.3 billion out of $11.9 billion, during the first quarter of 2003 (eBay<br />
2003, US Census Bureau 2003). And the future of Internet auctions looks bright as eBay<br />
financial results for Q1 2003 compared to Q1 2002 reported increases in net revenues and GAAP<br />
117
net income of 94% and 119%, respectively; also sales and marketing expenses as a percentage of<br />
net revenues decreased to 26% from 30% during that same time period (eBay 2003).<br />
Prominent marketers have proclaimed the importance of studying online auctions; and<br />
practitioners have pointed to eBay in particular as the torch bearer for success in e-commerce.<br />
For example, Chakravarti et al (2002) strongly recommends that marketers take a stronger<br />
interest in online auctions by emphasizing “despite the growing interest in traditional and<br />
Internet auctions, the marketing literature is sparse;” and, George Day has described eBay “as<br />
perhaps the most successful of all the breakthrough applications on the Internet” (CNET 2002).<br />
While there are many reasons cited for the success of online auctions, the reputation system, or<br />
Feedback Forum as it is called on eBay, has been considered the most critical element (Grant<br />
2002, Hof 2001). EBay’s Feedback Forum is where buyers and sellers can rate and read about<br />
each others’ past transaction experiences. Each eBay member has a Feedback Profile which<br />
tracks and maintains several pieces of reputation-related information about the member,<br />
including individual-auction feedback reviews, which consist of a <strong>satisfaction</strong>/dis<strong>satisfaction</strong><br />
rating and comments by others who have participated in an online-auction exchange with this<br />
member. It also has an overall feedback rating which is, in essence, an aggregate reputation score<br />
(for an example, see Figure 1).<br />
FIGURE 1 about here<br />
Most online auction studies have focused on eBay or used eBay-generated data; and, those that<br />
have investigated the impact of seller-reputation on consumer/bidder behavior and auction<br />
results have considered only aggregate or summary measures of reputation, such as the feedback<br />
rating. Indeed, the overall reputation (score) is an important factor in decision making and<br />
bidding behavior (e.g., Resnick et al. 2000). However, virtually no research has “gone beneath<br />
the surface” to investigate consumer utilization of many other Feedback Profile elements/details,<br />
118
such as the individual-auction feedback reviews, and their impact on consumer decision making<br />
in online auctions. We believe that such deeper exploration would enhance our understanding of<br />
eBay’s key-success-factor in specific and online-auction reputation systems in general, and,<br />
consequently, would reveal insights that could be applied in other online, and perhaps offline,<br />
retailing applications.<br />
We address this void in the auction and marketing literature by classifying online-auction<br />
feedback as a type of “word-of-web,” specifically, rating-and-review word-of-web, and by<br />
conducting two studies to learn more about consumers’ perceptions and use of online-auction<br />
feedback. In study one, we analyzed more than 80 websites that reported rating-and-review<br />
(RR) word-of-web (WOW), developed a general framework that outlines the various<br />
characteristics of RR WOW, and applied this framework to identify a property that is unique to<br />
online auctions --“bidirectionality.” In study two, we used eBay to study consumer processing of<br />
bidirectional online-auction reputation information; we discovered that consumers/bidders<br />
process several Feedback Profile elements/details beyond the aggregate reputation score of the<br />
feedback rating when evaluating sellers and making decisions about bidding in their auctions.<br />
We begin the paper with a brief discussion of the retail online auction market. Next, we review<br />
relevant literature, including elaboration on the concept of word-of-web communication. Then,<br />
we describe and discuss the results of study one and study two. Finally, we close with a<br />
discussion about opportunities for future research.<br />
“RETAIL” ONLINE AUCTIONS OVERVIEW<br />
The online auction market is served by several prominent players, including, most notably,<br />
Amazon, eBay and Yahoo!. eBay, however, is the most dominant player, with more than<br />
80% market share. Amazon Auctions and Yahoo! Auctions have about 2% share each. Given<br />
119
this, it is not surprising that eBay is the most referenced online auction player and to many is<br />
synonymous with the term online auction.<br />
Many leading manufacturers, retailers, service providers and charitable organizations have<br />
engaged online auctions: for example, IBM, Dell, Apple, Kodak, Motorola, Boeing,<br />
Whirlpool, Disney, Sears, The Home Depot, The Sharper Image, ESPN, The American<br />
Broadcasting Company (ABC), FTD, The American Red Cross and The Make-A-Wish<br />
Foundation. They use online auctions for a variety of marketing and strategic applications,<br />
such as estimating demand curves and setting prices, accelerating new product adoption,<br />
selling refurbished goods and excess inventory, enhancing brand <strong>value</strong>, and serving new<br />
segments (for extensive details see Kambil and van Heck 2002).<br />
Several factors are attributed to the success of eBay’s business model, including: its<br />
extensive outsourcing and low capital expenditures, the fun factor of participating in the<br />
auction process, the ability to easily find just about any current or out-of-production product,<br />
its simple interface design with fast loading webpages, secure technology, a website that<br />
rarely goes down, and, what has captured the most interest, its having built and maintained a<br />
strong community. The centerpiece of eBay’s community is its highly regarded Feedback<br />
Forum, where, according to Gartner’s Walter Janowski, “buyers and sellers are easily able to<br />
communicate with each other and share ratings and opinions” (Grant 2002).<br />
Indeed, the general importance of having a strong (overall) feedback rating is widely held.<br />
However, at the present time, little is known about consumer processing and utilization of the<br />
various feedback profile elements. But, eBay and other online-auction industry players<br />
appear to recognize the importance of learning more in this regard, as firms, such as Andale,<br />
have created tools for managing and tracking feedback, among other auction-related research<br />
activities.<br />
120
LITERATURE REVIEW<br />
Word-of-Web<br />
Word-of-mouth (WOM) is an extremely important and influential source of information to<br />
consumers engaged in the buying decision process (e.g., see Gilly et al. 1998, Maxham and<br />
Netemeyer 2002, Richins 1983, Srinivasan, Anderson, and Ponnavolu 2002). The World<br />
Wide Web is another effective medium through which consumers spread consumption<br />
related information among each other. Marketers have referred to consumer information<br />
diffused to other consumers through this means as electronic or Internet word of mouth<br />
(Hanson 2000). The spirit of these expressions is fine at face <strong>value</strong>; however, technically,<br />
such information transmitted via the Internet is not word-of-mouth. Word-of-mouth is the<br />
exchange of oral or spoken messages between a source and a receiver concerning the<br />
purchase of a good or service (Ong 1982) in real time and space (Stern 1994). Word-of-web<br />
(WOW) is, arguably, a more precise term for describing behavior where product or purchase<br />
related information is communicated from consumer to consumer via the Web, either at real<br />
time or not.<br />
Word-of-web is spread through a variety of electronic forms, such as email, including viral<br />
marketing (Godin 2001) and e-newsletters (Katz 2002, Scientific American 2001), instant<br />
messaging, including chat rooms (Gelb and Sundaram 2002), online community or<br />
discussion forums (Bickart and Schindler 2001, Hagel and Armstrong 1997, Kozinets 2002,<br />
Rheingold 2000), websites, including weblogs (Cristol 2002, Levy 2002), reviews, and rating<br />
and reviews (Kuehl 1999). Review information differs from rating-and-review WOW in that<br />
the latter includes a quantitative measure of some scale type, be it ordinal, interval or ratio, in<br />
its evaluation of a target object, such as a product. The rating-and-review (RR) form,<br />
121
frequently referred to as feedback in online auction environments, is available in a number of<br />
leading online auction sites, and is influential (e.g., Lucking-Reiley 2000). Online auctions<br />
Though research on auction theory and practice is well-established (e.g., see McAfee and<br />
McMillan 1987, Milgrom 1989, Milgrom and Weber 1982), very little research about online<br />
auctions has been published in scholarly journals. This is not necessarily surprising given<br />
that the first Web-based commercial auction sites were launched in 1995.<br />
Lucking-Reiley’s (2000) introduction to Internet auctions is significant because he<br />
investigated 142 Internet auction sites, and provides a comprehensive overview of the<br />
Internet auction industry, including its early history, business models, goods sold, auction<br />
formats and options, and concerns about fraud. Herschlag and Zwick (2000) provide a<br />
review of nonacademic articles which touch on many of the same themes.<br />
Online auction studies have focused primarily on reputation issues (i.e., online auction<br />
feedback -- discussed in the next section of this paper), and on auction-listing issues, such as<br />
the <strong>value</strong> of providing photographs/images of an auction item (Ottaway, Bruneau and Evans<br />
2003), setting an opening bid amount (Gilkeson and Reynolds 2003) or setting the bid<br />
increment amount (Bapna, Goes and Gupta 2003). Some research has investigated the<br />
impact of a consumer’s background, such as experience, on their online-auction behavior<br />
(e.g., see Wilcox 2000).<br />
Zwick and twelve other scholars outline key auction concepts and empirical findings,<br />
identify some areas for future research, highlight that Internet auctions can lead to new<br />
principles in marketing theory and practice, and report that the marketing literature on<br />
auctions is “sparse” (Chakravarti et al. 2002). They urge marketers to undertake more<br />
research in auctions. Online auction feedback<br />
122
Online auction feedback, or reputation and rating information, is a type of word-of-web that<br />
auction participants provide and pass along to other auction-community members in order to<br />
assist them in reducing uncertainty associated with their auction-related decision making,<br />
such as whether to place a bid, or how to bid. It can be an important means for avoiding<br />
Akerlof’s (1970) “market for lemons” and creating a healthy market which includes products<br />
available at a variety of quality levels and associated prices, for example, where buyers may<br />
be willing to pay a premium for products sold by sellers with superior reputations (Resnick et<br />
al. 2000).<br />
Feedback for an individual auction is called a review on eBay. It consists of a details about<br />
the auction, including: a comment/statement that must be classified as either positive,<br />
neutral, or negative, the name of the eBay member who left the comment as well as their<br />
feedback rating, a series of (optional) “Response” statements by the individual to the<br />
comment as well as “Follow-up” statements by the eBay member who provided the (initial)<br />
comment, the date and time on which the comment was posted, the auction item number to<br />
which the comment pertains (which contains an active link to the auction-listing for 30-60<br />
days after the end of the auction), and indication whether the member being reviewed was<br />
the seller or the buyer in the auction transaction, which is indicated in the right most column<br />
with an “S” or a “B,” respectively. Each positive comment begins with the word “Praise.”<br />
Each neutral comment begins with the word “Neutral.” And, each negative comment begins<br />
with the word “Complaint.” The remainder of the comment may consist of up to eighty (80)<br />
characters of the reviewers choice (see Figures 2a-c).<br />
FIGURE 2a about here<br />
FIGURE 2b about here<br />
FIGURE 2c about here<br />
123
An auction participants’ feedback rating is a quantitative score that is based on the feedback<br />
reviews received from other community members. Ebay suggests that it be treated as “a<br />
measure of an eBay user's reputation in the community.” A person’s feedback rating can be<br />
computed using the following procedures: a) +1 point is tallied for each member who has left<br />
a positive comment for that person; the sum of these tallies is commonly referred to as the<br />
(number of unique) “positives” and it is the number of positives listed in a person’s Feedback<br />
Profile as being “from unique users” (e.g., see Figure 1 - IBM’s number of unique positives<br />
is 2453); b) -1 point is tallied for each member who has left a negative comment for that<br />
person; the sum of these tallies is commonly referred to as the (number of unique)<br />
“negatives” and it is the number of negatives listed in a person’s Feedback Profile as being<br />
“from unique users” (e.g., see Figure 1 - IBM’s number of unique negatives is 106); and c)<br />
the (number of unique) negatives are subtracted from the (number of unique) positives to<br />
yield the feedback rating (e.g., see Figure 1 -IBM’s feedback rating is 2347 1<br />
= 2453 - 106).<br />
Research into the impact of online-auction feedback on consumer/bidder behavior has<br />
considered only quantitative aggregate reputation measures, such as the feedback rating, the<br />
number of unique positives and the number of unique negatives. Evidence indicates that the<br />
feedback rating does not fully explain how bidders use feedback information, and that<br />
bidders place more weight on (the number of unique) negatives than on (the number of<br />
unique) positives (Ba and Pavlou 2002, Lucking-Reilly 2000, Melnik and Alm 2002).<br />
Assuming that negatives and positives communicate potential losses and gains for a future<br />
transaction, respectively, then these results are consistent with the asymmetric impact of<br />
gains and losses in accordance with prospect theory (Kahneman and Tversky 1981, Tversky<br />
and Kahneman 1992).<br />
124
1<br />
Note that eBay actually indicated a feedback rating of 2349 for IBM while reporting 2453<br />
positives and 106<br />
negatives; however, this is, obviously, in error. EBay acknowledges this problem in their<br />
discussion boards: for<br />
example, a May 26, 2003 post by an eBay staff member states, “Hi Folks, We are aware that<br />
some members'<br />
feedback scores and/or summaries are not showing correct numbers. We are currently<br />
investigating the situation<br />
and hope to have it resolved soon. Thank you for your patience in this matter as we work to<br />
correct this problem.<br />
Daphne Community Development<br />
A main limitation of these inquiries is that they do not consider many other Feedback Forum<br />
elements/details, such as individual-auction comments, which contain “much (service<br />
performance) information about sellers,” (Ba and Pavlou 2002, page 256). Research which<br />
delves below the surface of the aggregate feedback measures is important because it can<br />
provide greater insight into: a) how consumers process and use online auction word-of-web<br />
information, b) which feedback elements impact consumer/bidder perceptions and behavior,<br />
c) how practitioners should make online-auction reputation- or service-related decisions<br />
(e.g., being less concerned about not receiving positive feedback, but doing everything<br />
possible to minimize the likelihood of receiving negative feedback), and d) the role of word-<br />
of-web rating-and-review information in online auctions in order to replicate or transfer its<br />
effects to other online (or offline) contexts or applications.<br />
STUDY ONE: RATING-AND-REVIEW WOW<br />
125
The objective of study one was to identify a comprehensive set of websites containing rating-<br />
and-review (RR) information in order to identify important characteristics of the rating-and-<br />
review information available online.<br />
We selected a sample of websites to inspect with Google, the online search engine, using<br />
relevant (search) phrases such as “rating website,” and “product ratings.” We found eighty-<br />
six<br />
(86) websites that provided rating-and-review information. At the time of the search, it was<br />
likely that other websites containing rating-and-review information existed. However, the<br />
sample was viewed as being reasonably comprehensive given that we perused as many as<br />
ninety-six search-engine page results for some of the (search) terms applied. A complete<br />
listing of the websites that were analyzed is in the appendix.<br />
The types of products which were rated and reviewed among the websites were extremely<br />
diverse. Reporting on the full range of the items would be tedious given that the sample<br />
websites included those of organizations such as Consumer Reports and epinions, which<br />
provide rating and review information for hundreds of products. We would not be surprised<br />
to learn that online ratings and reviews exist for just about any object of interest. Some of<br />
the products, which could, perhaps, be considered as less than typical, were: table hockey<br />
equipment, carbohydrate food items, magic tricks, spy software, charitable organizations and<br />
professors. Rating-and-review word-of-web characteristics<br />
Our analysis consisted of inspecting the information listed and the processes associated with<br />
providing or using the rating-and-review information on each site. This yielded eleven<br />
primary characteristics that can be used to classify RR WOW -- see Table 1.<br />
Table 1 about here<br />
126
The sources which provided the rating and review information varied across websites. For<br />
example, experts provided their assessment of automobiles at Edmunds.com; consumers<br />
listed their ratings at Amazon.com; and both buyers and sellers detailed their opinions at<br />
eBay. The target object, that which was rated and reviewed by a source, was either a product<br />
provider, such as a seller, retailer or manufacturer, a product, such as a good or a service, or a<br />
customer/buyer.<br />
Direction is determined by which “sides”/participants in exchange-related behavior provide<br />
rating and review information. In general, direction is n-way, where n represents the number<br />
of “sides” who can provide rating and review information. Most RR WOW is unidirectional<br />
(i.e., one-way), where one party evaluates some aspect of another party; for example (and<br />
typically), consumers’ evaluations of retailers (consumer � retailer) is available at websites<br />
such as bizrate and Zagat. Bidirectional (i.e., two-way) RR WOW was observed only at<br />
online auction sites, such as eBay, where buyers evaluated sellers and sellers evaluated<br />
buyers (buyer seller). It could be argued, perhaps, that epinions or Amazon list<br />
bidirectional RR<br />
WOW, in that one can find a buyer’s or consumer’s rating of products as well as assessments<br />
of the buyer/consumer’s rating by other buyers/consumers.<br />
By definition, rating and review information includes at least one quantitative piece of<br />
information, a rating. However, some sites provide a breadth of statistics, such as an overall<br />
rating and a set of attribute ratings (e.g., see bizrate), or an overall rating and a frequency<br />
distribution (e.g., see eBay). Qualitative review information may also be available. The<br />
amount of review prose associated with a rating varies. For example, the maximum amount<br />
allowed at ratemyprofessor.com is 255 characters, while there does not appear to be a limit at<br />
epinions. Also, the qualitative review information presented may be constituted of raters’<br />
127
excerpts that were selected and fused together by those who manage the site. For example,<br />
Zagat creates restaurant reviews that are based on bits and pieces of opinions provided by<br />
some of the raters. Some sites present only a sample of raters’ comments (e.g., bizrate).<br />
Sites also varied by the manner in which RR information was presented and could be<br />
customized by users. For example, eBay shows summary information by time, and<br />
gamereview.com enables users to view information by rating level. Some sites integrated<br />
RR information into the buying process, for example, at CNET, one can quickly access such<br />
information while reviewing a list of sellers and their prices (and vice-versa).<br />
Contacting the person who provided the information was available at some (57%) of the<br />
sites. This facilitates the opportunity for one to probe and learn more from the source of the<br />
RR information. The length of time in which all RR-related information was available for<br />
review ranged from a limited period of time to – so it appeared – permanently. For example,<br />
at Amazon.com, all product reviews appear to remain available forever. Whereas, on eBay,<br />
some RR-related information elements are available for only 30-60 days. Online auction site<br />
uniqueness<br />
Our analysis found that the leading major online-auction sites differ from all other types of<br />
RR WOW sites. Online auction feedback can be bidirectional in that both buyers and sellers<br />
may supply feedback about each other. In any RR WOW system, one would expect that<br />
buyers would be able to provide feedback about sellers. However, in online auction sites,<br />
such as eBay, sellers can also provide feedback on buyers.<br />
STUDY TWO: CONSUMER USE OF ONLINE AUCTION RATING-AND-REVIEW<br />
SYSTEMS<br />
128
In study one, we learned more about the general makeup of rating-and-review word of web<br />
and discovered that online-auction RR WOW is unique in that both the buyer and the seller<br />
can rate each other. The objective of study two is to learn more about how consumers use<br />
online-auction feedback elements to make decisions. Method<br />
Eight subjects with experience using online auctions were instructed to inspect auctions for<br />
products that they would consider obtaining in an online auction. They provided verbal<br />
protocols of their search. After their experience, subjects were interviewed about their<br />
utilization of, and perceptions about, feedback information on the auction website.<br />
eBay was the auction site used in this study as it has been used in a majority of previous<br />
online auction studies. In addition, with its market share of 80%, many people perceive it as<br />
“The” online auction website. Results<br />
Customer perceptions about RR WOW are presented by the type of feedback information<br />
available on eBay. All reputation information about an online-auction member appears in<br />
her/his feedback profile page(s). The feedback profile is organized into three main sections:<br />
Feedback Summary, eBay ID Card (including ID History and Feedback About Others), and<br />
auction feedback reviews (again, see Figure 1 for an example). (Overall) feedback rating<br />
In general, the feedback rating was important to subjects from the perspective of being a<br />
buyer/bidder. For example, subjects said “The total feedback score is important,” “since<br />
people on eBay don’t know who you are, the only way people know if you’re honest and<br />
dishonest is through the feedback system.” They also indicated that the feedback rating was<br />
important from the perspective of perhaps becoming a seller: “My feedback score is<br />
instrumental in helping me to eventually become a seller,” and “I’d work hard to get enough<br />
positive feedback so that I can use (i.e., sell with) the ‘Buy it Now’ feature.”<br />
129
Consumers believed that sellers with relatively high scores were more professional,<br />
experienced, and <strong>trust</strong>worthy: “People with lots of feedback are <strong>trust</strong>worthy because it’s like<br />
their business,” “The bigger the rating the better,” “If a seller has several hundred feedback<br />
points or more, then selling things over eBay must be their full-time job,” “A seller who has<br />
more than several hundred feedback points is more professional than someone with fewer<br />
points,” “The higher the overall number, the more experienced the seller.” And some<br />
ascribed economic <strong>value</strong> to a feedback rating in terms of experience – “It’s worth it to pay a<br />
little bit more for an item that’s being auctioned by a more experienced seller.”<br />
Some consumers had a feedback rating threshold-level when assessing a seller: “I’m<br />
skeptical of sellers that have ratings below 30,” “I’d be uncomfortable bidding more than $25<br />
for an item that’s being sold by an inexperienced buyer; one with an overall rating below 30”<br />
and “Fifty or more is a good amount.”<br />
Every consumer stated that they would not place a bid on an item based solely on the<br />
feedback rating; they said they would view other feedback information that is available on<br />
the Feedback Profile pages, such as the individual-auction reviews. Feedback Summary<br />
Though consumers highlighted the importance of a high feedback rating, they were quick to<br />
focus on the number of unique negative feedback comments when viewing a seller’s total<br />
number of unique positives, neutrals and negatives. Consumers’ believed that “It’s better to<br />
have no negative feedback than to have lots of positive feedback,” and “Even if someone has<br />
a rating of 0, no negative feedback is an important factor.” This was consistent with research<br />
which found that a negative comment reduces a seller’s reputation more than a positive<br />
comment increases it (Ba and Pavlou 2002, Lucking-Reilly 2000, Melnik and Alm 2002<br />
2000).<br />
130
However, there is more to understand about negative feedback as consumers also suggested<br />
that there was a “to be comfortable” tolerance for some maximum number or percentage of<br />
negative comments: “If someone had a 30 point rating, I would feel comfortable if they had<br />
less than 3 negatives. If a rating of 10, then 1 negative tops, rating of 50 then 4-5 negatives<br />
would be ok, rating of 1000+, then up to 20 negatives,” “A seller is bad if they have 1000<br />
positives and more than 50 negatives,” “If a seller has 10 feedback points and 1 or more<br />
negatives, then they are a bad seller,” “If a seller has 100 feedback points and 5 or more<br />
negatives, then they are a bad seller,” and “Once you get 20 or more negative feedbacks as a<br />
seller, then you’re doing something wrong. A 10% rule holds true for up to 200 transactions<br />
and then anything above that the 20-only rule kicks in.” It would be interesting to explore<br />
farther the relationship between perceptions of a seller and percentages or absolute amount of<br />
negative word-of-web feedback.<br />
The vast majority of consumers devoted very little attention to the total number of neutral<br />
feedback comments. However, some believed that it was important to review the comments<br />
associated with neutral feedback in order to search for possible negative information. In<br />
general, the aggregate number of neutral comments had no effect on a consumer’s<br />
perceptions of a seller.<br />
eBay ID Card<br />
The primary purpose of the ID card appears to be reporting on the aggregate number of<br />
feedback comments received over various lengths of time. Not all consumers dedicated time<br />
and effort toward viewing the eBay ID card; those who did, indicated clearly that feedback<br />
received more recently was more important: “If a seller has no recent auction activity (i.e.,<br />
any feedback received within the past 6 months), then they are less <strong>trust</strong>worthy,” “One<br />
negative feedback within the past 7 days affects my opinion of a buyer because that one<br />
131
negative feedback could be me,” and “Recent negative ratings are more detrimental than<br />
older negative ratings.” The first statement might suggest that consumers place a higher<br />
<strong>value</strong> on sellers that are consistently involved in the eBay community over time.<br />
Some attention was devoted to other aspects of the ID card. One person indicated that<br />
“geography” influences a bidding decision in that “It’s a pain to buy from people who are<br />
outside the United States.” None of the consumers had actively viewed the “feedback left for<br />
others” when evaluating feedback. However, one person commented “One good turn<br />
deserves another. If people in general give a seller positive feedback, then that seller should<br />
be giving praise too,” when asked what would be expected in the “feedback left for others”<br />
from a seller that had all positive feedbacks. Interestingly, Resnick et al. (2000) suggests that<br />
reciprocity might decrease the effectiveness of eBay’s Feedback Forum.<br />
Auction Feedback Reviews<br />
Auction feedback review information is available at the individual-auction level for a<br />
member (again, see Figures 2a-c for examples), and reports, most importantly, the feedback<br />
comment (and follow-up) provided by the “other” exchange party from that auction, and any<br />
replies by the member to the feedback comment. Up to twenty five feedback reviews are<br />
presented on a webpage unless one indicates the other possible viewing-alternatives of 50,<br />
100, or 200 reviews per webpage. Until recently, an option for viewing up to 500 feedback<br />
reviews per webpage was offered by eBay. (One main effect of the viewing-alternatives<br />
option is the number of webpages over which feedback reviews are presented, of course. For<br />
example, the auction feedback review information for a person who has received 400<br />
reviews, could be viewed over two pages containing 200 reviews each, or sixteen pages<br />
containing 25 reviews each. This appears to matter as consumers searching for negative<br />
comments rarely looked through more than 2 pages of feedback reviews.)<br />
132
Consumers, again, were quick to focus on Complaints – a negative comment for an auction.<br />
Interestingly, consumers processed the “detail” of a negative comment and not all complaints<br />
“appeared to be created equal.” Consistent with beliefs stated about the ID Card, the (time)<br />
order in which feedback comments appear on a webpage may have an impact, e.g., “It’s not<br />
good when the feedback comments start with a complaint” and “ It’s bad when someone’s<br />
most recent comments are negative.” In addition, the comment could have varying impact<br />
depending on the service-related attributes mentioned: “I’m unhappy when I see that<br />
someone has a negative comment that states they’re a slow responder to emails, such as ‘took<br />
too long to receive item’ ” and “It’s worse to have a negative comment about the product,<br />
like ‘product not as advertised,’ than it is to have a negative comment about slow<br />
communications, like ‘not responsive to emails’.” Some consumers were looking for very<br />
specific service performance-related information in the comments, e.g., “Looking for product<br />
comments, process/shipping, and communication.” Many said they would avoid a seller who<br />
has feedback comments that are threatening or too personal.” Finally, consumers could<br />
overlook negative feedback if it was atypical, “If only one person leaves a complaint to a<br />
seller that has a high feedback score, then that complaint seems less valid.”<br />
Consumers also processed the comments associated with Praise – positive feedback for an<br />
auction. Some consumers believed that positive comments indicated a high degree of<br />
customer <strong>satisfaction</strong>: “People who leave positive feedback must be very satisfied” and “If a<br />
seller has all praises, then everyone is happy with them.” They <strong>value</strong>d generalizations, such<br />
as “A+++, great eBayer” as well as specific attribute-level details such as “super fast<br />
shipping.” However, some consumers believed that one should not necessarily take positive<br />
feedback at face <strong>value</strong> as “reading between the lines” could reveal important information: “A<br />
133
idder should read the praises too because it could be a veiled complaint,” and “It would be<br />
weird if someone left positive feedback, but didn’t leave a comment.”<br />
Consumers also considered a member’s response to a negative feedback comment.<br />
Interestingly, consumers suggest that an opportunity exists to, in spirit, turn a negative into a<br />
positive or, as in service recovery (Maxham 2001, Smith and Bolton 1998), reduce the<br />
deleterious effect of a negative comment situation: “When someone leaves a response to a<br />
complaint, it shows that they care,” “When someone leaves a response, it shows they want to<br />
receive good feedback all of the time” and “It’s good to say that you’re upset in your<br />
response if you’ve got a few negatives and a high feedback score.” On the other hand,<br />
consumers suggested that not all types of responses are effective: “Responses that do not<br />
address complaints directly basically admit that the complaint is true” and “Spiteful or<br />
retaliatory responses to negative feedback are not good.”<br />
eBay also indicates in each feedback review whether a member was the buyer or the seller.<br />
Although a minority of the participants regularly looked at this information when reviewing<br />
feedback details, most believed that, for a seller, a Praise comment was worth more if it was<br />
earned through selling than through buying. However, one participant found that there was<br />
<strong>value</strong> in seeing that a seller was also good buyer, saying “It’s important that a seller receives<br />
positive comments when they are a buyer.” Basically, this consumer felt that a well-rounded<br />
eBay user who experienced both aspects of transactions would be more in tune with the<br />
needs of buyers and, as a result, would deliver better products and service. A few consumer<br />
wishes<br />
Consumer participants in this study would like eBay to enable additional search-features and<br />
completed-auction information to facilitate their assessment of sellers. Consumers were<br />
quick to peruse negative comments and therefore would like eBay to facilitate “Searches for<br />
134
an easy way to see only negative comments,” or in general, to sort a member’s feedback by<br />
feedback comment type (i.e., positive, neutral or negative). They also expressed a desire to<br />
see more detailed feedback information, perhaps something along the lines of attribute<br />
ratings, e.g.,<br />
“Want to see serious sentences as to why someone is satisfied when they leave a positive<br />
comment and why someone is dissatisfied when they leave a negative comment.”<br />
In addition, consumers would like “to see a link to the auction page of an item related to any<br />
negative feedback even if it’s past the time when those links are kept active,” basically, to<br />
better determine the fairness and honesty of a seller. For example, sellers may reply to<br />
negative feedback by stating “view the auction details” as a means for validating their<br />
integrity. However, when the link to the auction listing is no longer active -- eBay’s practice<br />
is to list a completed auction for about 30-60 days -- then one can no longer view the<br />
auction-listing details and more fully validate the <strong>trust</strong>worthiness of a seller. Perhaps some<br />
potential bidders give sellers some benefit of the doubt when they see “<strong>trust</strong>-supporting”<br />
statements that can not be confirmed at a current time through no fault of the seller.<br />
SUMMARY AND FUTURE RESEARCH<br />
An objective of this research was to extend our understanding of online auctions, which<br />
leading marketing academics and professionals have highlighted as the most important<br />
Internet application and a research priority. Our investigation focused, ultimately, on eBay’s<br />
Feedback Forum, which has been considered the key ingredient in the success of the most<br />
profitable and leading online retailer to date.<br />
Our approach included defining the concept of word-of-web and its various classes, which<br />
we used to provide structure to our investigation, and then implementing two studies. The<br />
135
first study focused on one class of WOW to which online auction feedback belong, rating-<br />
and-review, and identifying a set of characteristics on which RR WOW may vary. The<br />
second study focused on consumer processing of online auction RR WOW, specifically,<br />
eBay’s Feedback Forum.<br />
Study one revealed that RR WOW for online auctions differs from that of all other online<br />
sources on one characteristic, which heretofore has not been an issue in retailing, that of<br />
direction. Online auction sites such as eBay, Amazon-Auctions and Yahoo!-Auctions each<br />
provided bidirectional RR WOW, whereas all other sites provided unidirectional RR WOW.<br />
We believe that retailers, among others, need to learn more about bidirectional RR WOW.<br />
Study two identified several important areas for new exploration into online auction RR<br />
WOW. Previous research looked at the relationship between the (overall) feedback rating<br />
and various online auction behaviors/results (e.g., final bid amount). However, our research<br />
shows that, in addition to the feedback rating, consumers inspect and consider many other<br />
pieces of information in online auction RR WOW, such as the individual-auction level<br />
feedback reviews.<br />
This suggests significant opportunity for future research. In general, future research can<br />
explore further the impact of various elements of online auction RR WOW on a consumer’s<br />
perception of a retailer/seller and a consumer’s decision making behavior (e.g., whether to<br />
place a bid, setting a bid-amount limit, whether to provide feedback). For example, though<br />
online auction providers (e.g., eBay) assign the same <strong>value</strong> to each type of auction rating<br />
(e.g., +1 for Praise, 0 for Neutral, -1 for Complaint), do consumers assign the same <strong>value</strong> to<br />
each type of rating for all auctions? Are all positively-rated auctions (experiences) accorded<br />
the same weight? Are all negatively-rated auctions (experiences) viewed in the same way?<br />
Study two suggests that this may not be the case given that consumers consider the<br />
136
order/time in which feedback was received and the detail of the qualitative feedback review<br />
comments of online-auction RR WOW.<br />
Also, future research could assess which service-performance attributes are most important<br />
to online-auction consumers/bidders, determine how seller’s should “respond” to negative<br />
comments and manage service recovery or brand building, or consider the impact of a<br />
consumer’s ability to sort comments by their type, positive, neutral or negative (such sorting<br />
is indeed feasible at http://www.vrane.com).<br />
At a broader level, detailed research into other types of word-of-web that are commonly used<br />
online by retailers, such as e-newsletters or email, could prove very profitable. In fact, at the<br />
present time, learning more about these two particular types of WOW could be extremely<br />
important given the prevalence and negative perceptions of Spam-email.<br />
REFERENCES<br />
Adler, Jerry. 2002. The eBay way of life. Newsweek. June 17. 50-60.<br />
Akerlof, George. 1970. The Market For ‘Lemons’: <strong>Quality</strong> Uncertainty and the Market<br />
Mechanism. Quarterly Journal of Economics. 85:3. 488-500.<br />
Ba, Sulin and Paul A. Pavlou. 2002. Evidence of The Effect of Trust Building Technology in<br />
Electronic Markets: Price Premiums and Buyer Behavior. MIS Quarterly. 26:3. 243-268.<br />
Bapna, Ravi, Paulo Goes and Alok Gupta. 2003. Analysis and Design of Business-to-<br />
Consumer Online Auctions. Management Science. 49:1. 85-101.<br />
Bickart, Barbara, and Robert M. Schindler. 2001. Internet Forums As Influential Sources Of<br />
Consumer Information. Journal of Interactive Marketing. 15:3. 31-40.<br />
Chakravarti, Dipankar, Eric Greenleaf, Atanu Sinha, Amar Cheema, James C. Cox, Daniel<br />
Friedman, Teck H. Ho, R. Mark Isaac, Andrew A. Mitchell, Amnon Rapoport, Michael H.<br />
137
Rothkopf, Joydeep Srivastava, Rami Zwick. 2002. Auctions: Research Opportunities in<br />
Marketing. Marketing Letters. 13:3. 281-296.<br />
CNET News. 2002. eBay: Last man standing. CNET News. April 20. online at<br />
http://news.com.com/2009-1017-887630.html.<br />
Cristol, Hope. 2002. News in the Digital Age. The Futurist. 36:5 (Sep/Oct). 8-9.<br />
eBay. 2003. eBay Inc. Announces First Quarter 2003 Financial Results. Online at<br />
http://www.shareholder.com/ebay/news/20030422-107123.htm. Gelb, Betsy D. and Suresh<br />
Sundaram. 2002. Adapting to “word of mouse.” Business Horizons.<br />
45:4. 21-25.<br />
Gilkeson, James H. and Kristy Reynolds. 2003. Determinant of Internet Auction Success and<br />
Closing Price: An Exploratory Study. Psychology and Marketing. 20:6. 537-566.<br />
Gilly, Mary C., John Graham, Mary Wolfinbarger and Laura Yale. 1998. A Dyadic Study of<br />
Interpersonal Information Search. Journal of the Academy of Marketing Sciences. 26:2. 83-<br />
100.<br />
Godin, Seth. 2001. Unleashing the Ideavirus. Hyperion.<br />
Grant, Elaine X. 2002. What Makes Ebay Invincible. E-Commerce Times. March 5. Online at<br />
http://www.ecommercetimes.com/perl/story/16546.html.<br />
Hagel, John III, and Arthur G. Armstrong. 1997. Net gain: expanding markets through<br />
virtual communities. Boston, MA: Harvard Business School Press.<br />
Hansen, Ward. 2000. Principles of Internet Marketing. Cincinnati, OH: South-Western<br />
College Publishing.<br />
Hof, Robert D. 2001. The People’s Company. BusinessWeek E.Biz. December 3. Available<br />
online at http://www.businessweek.com:/print/magazine/content/01_49/b3760601.htm?eb.<br />
138
Kahneman, Daniel and Amos Tversky. 1979. Prospect Theory: An analysis of decision under<br />
risk. Econometrica, 47:2, 263-291<br />
Katz, Michael. 2002. E-Newsletters That Work. Electronic book available online at<br />
http://www.enewsletterbook.com/.<br />
Kambil, Ajit, and Eric van Heck. 2002. Making Markets. Boston, MA: Harvard Business<br />
School Press.<br />
Kozinets, Robert V. 2002. The Field Behind The Screen: Using Netnography For Marketing<br />
Research in Online Communities. Journal of Marketing Research, 29:1. 20-38.<br />
Kuehl, Claudia. 1999. New World of Web reviews. Internet World. 5:34 (December 1). 52-<br />
54.<br />
Levy, Steven. 2002. Living in the Blog-osphere. Newsweek. 140:9 (August 26). 42-45.<br />
Lucking-Reiley, David. 2000. Auctions On The Internet: What’s Being Auctioned And How.<br />
The Journal of Industrial Economics. 48:3. 227-252.<br />
Lucking-Reiley, David, Doug Bryan, Naghi Prasad, and Daniel Reeves. 2000. Pennies from<br />
eBay: the Determinants of Price in Online Auctions. Available online at<br />
http://www.vanderbilt.edu/econ/reiley/papers/PenniesFromEBay.pdf.<br />
Maxham III, James G. 2001. Service Recovery’s Influence on Consumer Satisfaction,<br />
Positive Word of Mouth and Purchase Intentions. Journal of Business Research 54:1. 11-24.<br />
Maxham III, James G. and Richard G. Netemeyer. 2002. A Longitudinal Study of<br />
complaining Customer’s Evaluations of Multiple Service Failures and Recovery Efforts.<br />
Journal of Marketing. 66:4. 57-71.<br />
McAfee, R. Preston., and John McMillan. 1987. Auctions and Bidding. Journal of<br />
Economics Literature. 25:X. 699-738. Melnik, Mikhail I. and James Alm. 2002. Does a<br />
Seller’s Ecommerce Reputation Matter? Evidence from Ebay Auctions. The Journal of<br />
139
Industrial Economics. 50:3. 337-349. Milgrom, Paul R. 1989. Auctions and Bidding: A<br />
Primer. Journal of Economic Perspectives.<br />
3:X. 3-22. Milgrom, Paul R. and Robert J. Weber. 1982. A Theory of Auctions and<br />
Competitive Bidding.<br />
Econometrica. 50:5. 1089-1122. Ong, Walter J., S.J. 1982. Orality and Literacy. London:<br />
Methuen. Ottaway, Thomas A., Carol L. Bruneau and Gerald E. Evans. 2003. The Impact of<br />
Auction Item<br />
Image and Buyer/Seller Feedback Rating on Electronic Auctions. The Journal of Computer<br />
Information Systems. 43:3. 56-60.<br />
Resnick, Paul, Richard Zeckhauser, Eric Friedman and Ko Kuwabara. 2000. Reputation<br />
Systems. Communications of the ACM. 43:12. 45-48.<br />
Rheingold, Howard. 2000. The Virtual Community: Homesteading on the Electronic<br />
Frontier. Cambridge, MA: MIT Press.<br />
Richins, Marsha. 1983. Negative Word of Mouth by Dissatisfied Consumers: A Pilot Study.<br />
Journal of Marketing, 47:1. 68.<br />
Scientific American. 2001. Patent Pamphleteer. Scientific American. 285:6 (December). 33.<br />
Smith, Amy K. And Ruth Bolton 1998. An Experimental Investigation of Service Failure and<br />
Recovery: Paradox or Peril? Journal of Service Research, 1(August). 65-81.<br />
Srinivasan, Srini, Rolph Anderson and Kishore Ponnavolu Customer Loyalty in E-<br />
Commerce: An Exploration of Its Antecedents and Consequences. Journal of Retailing.<br />
78:1.41-50.<br />
Stern, Barbara 1994. A Revised Communication Model for Advertising: Multiple<br />
Dimensions of the Source, the Message and the Recipient. Journal of Advertising. 23:2. 5-<br />
15.<br />
140
Tversky, Amos and Daniel Kahneman. 1992. Advances in Prospect Theory: Cumulative<br />
Representation of Uncertainty. Journal of Risk and Uncertainty. 5, 297-323.<br />
US Census Bureau. 2002. Retail 1Q, 2003 E-commerce Report. May 30. Available online at<br />
http://www.census.gov/mrts/www/current.html<br />
Wilcox, Ronald T. 2000. Experts and Amateurs: The Role of Experience in Internet<br />
Auctions. Marketing Letters. 11:4. 363-374.<br />
APPENDIX - Websites with Rating-and-Review Information<br />
http://activebuyersguide.com/<br />
http://altavista.dealtime.com/main/1,3241,,00.html?header=<br />
http://ask.dealtime.com/dealtime2000/Reviews/product/read_product/1,7235,20165,00.ht<br />
ml http://borntolove.com/cgi-bin/productreviews/ http://cg.superpages.com/cgibin/php/index.html<br />
http://epguides.com/Seinfeld/<br />
http://home.labvelocity.com/researchlink/index.jhtml<br />
http://infocenter.cramsession.com/TechLibrary/default.asp?CatID=395<br />
http://reviews.cnet.com/reviews/0-9870989.html<br />
http://shopping.yahoo.com/reviews/productopia/<br />
http://sportsbay.com/productratings.html http://theaquarians.net/user_reviews.htm<br />
http://216.234.172.45/cgi-bin/starsreview/stars.pl http://tv.zap2it.com/news/ratings/<br />
http://wsj.consumersearch.com/electronics/cd_players/reviews.html<br />
http://www.acnielsenedi.com/bonews/bonewsframes.html<br />
http://www.activebuyersguide.com/ http://www.atkinsfriends.com/reviews/<br />
http://www.audioreview.com/reviewscrx.aspx<br />
http://www.babyplus.com/science/product_ratings.html<br />
http://www.bikemagic.com/review/review.asp http://www.bikergirl.net/products/<br />
http://www.biowire.com/bw_jsp/product_reviews_top.jsp<br />
http://www.bodypaincentral.com/ http://www.carreview.com/reviewscrx.aspx<br />
http://www.charitynavigator.org/ http://www.circuitcity.com<br />
http://www.computingreview.com/reviewscrx.aspx http://www.consumerguide.com/<br />
http://www.consumerreports.org/main/home.jsp http://www.consumerreview.com/<br />
http://www.consumersearch.com/www/ http://www.corvetteforum.com/reviews/<br />
http://www.creativepro.com/reviews/swproduct http://www.edmunds.com/<br />
http://www.epinions.com/ http://www.excelsis.com/1.0/section.php?sectionid=17<br />
http://www.gamerankings.com/itemrankings/latestadditions.asp?platform=15<br />
http://www.gamespot.com http://www.gamezone.com/reviews/reviews.htm<br />
http://www.golfreview.com/reviewscrx.aspx http://www.golftestusa.com/<br />
http://www.gsj.com/prodrateChoice.asp<br />
http://www.hairlosshelp.com/html/productratings.cfm<br />
http://www.headshaver.org/reviews/ http://www.heavyweights.net/productrating.asp<br />
http://www.internet-magazine.com/reviews/index.asp<br />
http://www.isedb.com/index.php?t=reviews&id=1067 http://www.kbb.com/<br />
141
http://www.laxshopper.com/index.htm?/equipment/ratingslistings.htm~laxmain<br />
http://www.momsjewelrybox.com/Our-Ratings.htm http://www.mtbreview.com/reviews/<br />
http://www.nextag.com/serv/main/buyer/help/faq.jsp?a=b<br />
http://www.nuws.net/hardware/<br />
http://www.outdoorreview.com/jump%5Epage%5Eflycrx.aspx<br />
http://www.paddling.net/Reviews/Kayaks.phtml<br />
http://www.pcgamereview.com/whatsnew/whatsnew.shtml<br />
http://www.pcphotoreview.com/ http://www.pcri.net/ratings.htm<br />
http://www.pcworld.com/reviews/index/0,00.asp http://www.planetfeedback.com/<br />
http://www.pricegrabber.com/about.php/about=us/ut=183c0ac1b09d7959<br />
http://www.rateitall.com/ http://www.ratemyprofessor.com/<br />
http://www.ratemyteacher.com/ http://www.ratings.net/<br />
http://www.responsibleshopper.org/ http://www.reviewcentre.com/<br />
http://www.riversmallies.com/reviews.html<br />
http://www.roadbikereview.com/reviewscrx.aspx<br />
http://www.scatmat.com/Tools/ProductRatings/AddProduct/<br />
http://www.scrapbookaddict.com/reviews/ http://www.sillymagician.com/magic.htm<br />
http://www.sleestak.net/reviews/ http://www.spy-software-products.com/<br />
http://www.stigaonline.com/rankings.shtml<br />
http://www.substance.com/discuss/rate/reviews/0,11191,228622,00.html<br />
http://www.sysopt.com/userreviews/<br />
http://www.systemid.com/products/product_walkthrough.asp<br />
http://www.thinnerthoughts.com/reviews.html<br />
http://www.tvtome.com/tvtome/servlet/GuidePageServlet/showid-112/epid-2241/<br />
http://www.uk.ciao.com/rating/The_Best_Films_on_DVD.html<br />
http://www.uscomputer.net/reviews/reviews.htm<br />
http://www.virtualratings.com/frames/productratingsiss.html http://www.zagat.com/<br />
http://www.zotz.com/nissan/sentra_product_ratings.htm<br />
Figure 1 - Feedback Profile page excerpt of eBay member IBM Figure 2a - Example of<br />
Positive Comment (left by kt_live for IBM)<br />
Figure 2b - Example of Neutral Comment (left by madcoder42 for IBM, with a Response<br />
by IBM to the comment)<br />
Figure 2c - Example of Negative Comment (left by rtadder for IBM, with a Response by<br />
IBM, and a Follow-up statement by rtadder) Table 1 Characteristics Of Rating-and-<br />
Review Word of Web<br />
? Source The source of the information, such as buyer, employee,<br />
analyst/expert, or seller.<br />
? Target Object The target object of the RR information, such as brand,<br />
product, manufacturer, or retailer.<br />
142
? Direction Direction is determined by the participants and “sides” in<br />
exchange-related behavior who provide RR information. In<br />
unidirectional or one-way RR WOW, a single participant,<br />
such as a consumer, provides information about a target<br />
object, such as a seller/retailer. In bidirectional or two-way<br />
RR WOW, the buyer provides feedback about the seller<br />
and the seller provides feedback about the buyer.<br />
? Statistics The rating statistics available, such as an overall rating,<br />
frequency distributions, and attribute ratings.<br />
? Qualitative Information The extent to which one may provide qualitative<br />
information, and the availability of relevant qualitative<br />
information, such as prose that explains a rating.<br />
? Selection The extent to which the RR information may not be<br />
presented in its original form, such as by selecting excerpts<br />
or censoring.<br />
? Quantity/Sampling The quantity of reviewer comments available, such as from<br />
? Presentation Format and<br />
Customization<br />
all reviewers, or a sample/proportion of them.<br />
The format in which information are presented including<br />
order, utilization of graphics and the like; and the extent to<br />
which the format may be customized, such as sorting<br />
retailers from best to worst, or listing only “negative”<br />
comments.<br />
? Transaction Integration The extent to which the information is integrated into or<br />
accessible during the transaction process, such as<br />
presenting RR WOW prominently on a webpage that<br />
presents, describes, and enables purchase of a product.<br />
? Probative Nature The ability to interact with the source of the RR WOW,<br />
such as via email.<br />
? Permanence The extent to which RR WOW remain available, such as in<br />
detail, or in time.<br />
143
144
Physical Behaviour in Stores and Spatial Configuration: Two Exploratory Studies<br />
Gaël Bonnin, EDHEC Business School<br />
Atmospheric perspective (Kotler, 1973; Russel and Mehrabian) has a great influence on<br />
empirical works studying physical environment-shoppers relationships. Nonetheless, recent<br />
works have mentioned certain limits of this perspective. Drawing from propositions of Titus and<br />
Everett (1995) and from the frame of analysis of European psycho-sociology of environment, the<br />
aim of this paper is to show the importance of physical behaviours in the creation of shopping<br />
experience and the influence of spatial configuration on these behaviours.<br />
Research has emphasized the role of the physical environment as a means to increase the<br />
performance of retail chains (Turley and Chebat, 2002; Babin and Attaway, 2000; Bitner, 1992;<br />
Kotler, 1973). However, recent works have illustrated that the use of atmospherics tools is not<br />
always profitable (Kozinets and al, 2002).<br />
It seems then of great importance to understand more clearly the relationship between consumers<br />
and the physical environment in which they behave.<br />
The atmospherics model (Russel and Merhabian, 1976; Kotler, 1973) is a great step towards this<br />
understanding. Empirical works drawn upon this model have shown that physical environment<br />
cues can affect people‘s internal states (mainly affective states) and their behaviours (either<br />
physical or purchase related) (Chebat and al, 2001; Chebat and Robicheaux, 2001; Lam, 2001;<br />
Turley and Milliman, 2000).<br />
Yet, recent works have highlighted certain limits of this framework (Aubert-Gamet and Cova,<br />
1999; Everett and al, 1994; Sherry, 1998; Stokols, 1978). We mention three of them.<br />
145
Firstly, the consumer is supposed to be a passive stakeholder in the physical environment-<br />
individual relationship: only the influence of environment on consumers is studied whereas the<br />
study of people’s influence on environment is neglected.<br />
Secondly, research is focused on sense-stimulating cues of the environment. Other dimensions,<br />
such as spatial configuration, though sometimes mentioned, does not really fit in the perspective<br />
of this model.<br />
Thirdly, people’s experience of the environment is supposed to be based on internal states, whilst<br />
physical behaviour is supposed to be a consequence and not an endogenous variable. But, a few<br />
works have proposed that behaviour may be an important means for the consumer to create its<br />
experience (Sherry, 1998; Fischer, 1997; Moles and Rohmer, 1998; De Certeau, 1980).<br />
A first attempt to challenge these limits was made by Titus and Everett (1995), who proposed the<br />
following:<br />
- Patterns of behaviour (i.e. movement and contact) are linked with types of experience<br />
consumers are looking for. Two search strategies are distinguished: epistemic strategies and<br />
hedonic strategies;<br />
- These patterns of behaviour may be linked with spatial configuration.<br />
As far as we know, the work of Titus and Everett has not been followed by empirical<br />
investigations.<br />
The aim of this paper is therefore twofold:<br />
Explore the strategies used by consumers in stores;<br />
Measure the influence of spatial configuration on these strategies.<br />
The two following studies were carried out to reach these objectives.<br />
I. Study 1: Behavioural Strategies of Consumers in Stores<br />
146
I.1. Theoretical Background<br />
To analyse behavioural strategies, Titus and Everett (1995) drew from the work of Darden and<br />
Dorsch (1990) who defined shopping strategies as “a plan for the exertion of energy for the<br />
performance of a shopping behaviour”. Navigation search strategies are behavioural strategies<br />
and are a smaller subset of all shopping strategies. They “help direct consumer’s effort to locate<br />
and acquire desired products, information and sensory stimulation within retail shopping<br />
environments”. For the authors two broad classes of strategies may exist : epistemic and hedonic.<br />
Epistemic search strategies are designed for the sole purpose of locating and purchasing desired<br />
products within retail shopping environments.<br />
Hedonic search strategies are used to enhance the overall quality of the multisensory shopping<br />
experience and satisfy the shopper’s hedonic pursuit of pleasure.<br />
These strategies are directly linked with physical behaviours along two dimensions: movement<br />
and contact.<br />
Shoppers using hedonic search strategies will proceed more slowly, stop more frequently, pause<br />
longer and backtrack less often than shoppers using epistemic search strategies;<br />
Shoppers employing epistemic search strategies will interact less often, and for shorter periods of<br />
time, with other customers and products than shoppers using hedonic search strategies.<br />
As far as we know, no empirical works have drawn from Titus and Everett (1995) frame of<br />
analysis. But, we have identified two European works carried out in non-retail contexts, that<br />
have drawn from European psycho-sociology of environment (Fischer, 1997; De Certeau, 1980;<br />
Moles and Rohmer, 1998). The relevance of this perspective lays in the fact that it gives a better<br />
understanding of physical behaviour sense and of the interaction mechanisms of environment-<br />
person relationship.<br />
147
For the psycho-sociology of environment, a key concept in the relationship between people and their<br />
environment is appropriation. Appropriation is a process by which people exert their influence on the<br />
physical environment (Fischer 1997; Moles and Rohmer, 1998). Through appropriation people create<br />
space‘s experience and build attachement to a place (Bones et Secchiaroli, 1995; Moles et Rohmer, 1982;<br />
De Certeau, 1980; Fischer, 1981).<br />
Every physical act is an appropriation practice (Moles et Rohmer, 1977), but two elementary<br />
aspects have been distinguished (Fischer, 1981): visual activity (minimal means of<br />
appropriation) and exploration (based on movement and contact).<br />
These appropriation practices, once combined, constitute appropriation strategies. These are ways of<br />
exploring the physical environment and are formal structures limited in number. Each has an underlying<br />
signification, referring to the “lived” experience in space.<br />
Moles and Rohmer (1977), like Titus and Everett (1995), have proposed the existence of two main<br />
strategies: one functional (epistemic) and one ludic (hedonic). But they proposed to split hedonic<br />
strategies into active and passive strategies. These differ from each other by the level of involvement of<br />
the person. Active strategies require high involvement (touching a product) whereas passive strategies<br />
require lower involvement (just looking at the product).<br />
The two empirical investigations on the topic have been carried out in a museum and in a<br />
subway (see Tables 1,2 and 3). These studies have not revealed three strategies but four: the first<br />
three mentioned above, and another one understood as a denial of the environment and elements<br />
in it.<br />
Author Space studied Appropriation practices observed<br />
Véron and Cultural Walking: point of entrance, space between people and exhibit panels, order of the visit, stoppings<br />
Levasseur<br />
(1991)<br />
exhibition<br />
Floch (1990) Parisian Actions: absorbed in a book, seating, head lowered; walks straight to a point on the platform (connection);<br />
subway stops to an exhibition (guitarist); follows the flow, adopt the rhythm of the flow; sits up to look at the<br />
landscape; listen to the music (walkman), looking nowhere; listens to a conversation; zigzags; does not<br />
give a helpful hand to a person with heavy luggage at a ticket barrier; is not (like other people) affected by<br />
repeated billboards; looks at people getting in; speeds up to avoid getting blocked by opposite flows<br />
Table 1. Appropriation practices in two non-retail spaces<br />
Véron and<br />
Levasseur<br />
Type 1 Type 2 Type 3 Type 4<br />
Fish<br />
Walks in the middle of the<br />
Butterfly<br />
zigzags, left-right-left–<br />
148<br />
Ant<br />
When he stops, he is close to<br />
Grasshopper<br />
Jumps from one point to
(1991) cultural<br />
exhibit<br />
Floch (1990)<br />
subway<br />
path away from both walls,<br />
short time (5 to 10 minutes),<br />
few stopping, goes through<br />
empty spaces, the itinerary<br />
looks like a loop, the<br />
behaviour is always the<br />
same, does not take care of<br />
the chronological order<br />
Continuous<br />
Follows the flow, ignores<br />
limits, signs, attraction and<br />
events, the environment is<br />
neutralised, same posture,<br />
same look, same<br />
concentration over its<br />
knitting or every other<br />
activity<br />
Table 2. Appropriation strategies in two non-retail spaces<br />
Véron and<br />
Levasseur<br />
(1991) cultural<br />
exhibit<br />
Floch (1990)<br />
subway<br />
right, semi-long time,<br />
about fifteen stops, avoids<br />
going through empty<br />
spaces, behaviour can be<br />
different from one space to<br />
another, follows the<br />
chronological order<br />
Discontinuous<br />
Search for and<br />
appreciation of rhythms<br />
and role playing offered by<br />
the environment, tries to<br />
delimitate, give rhythm, to<br />
segment, to rediscover<br />
some places, to oppose<br />
other places, meticulosity,<br />
at ease and open to the<br />
environment<br />
the exhibit panels, long time,<br />
numerous stops, does not cross<br />
empty spaces, walks along a<br />
wall, same behaviour in the<br />
two spaces, follows the<br />
chronological order of the<br />
exhibition<br />
Non discontinuous<br />
Joins, steps over, anticipates<br />
the obstacles to avoid it,<br />
minimum, speeds high and<br />
strong, zigzags, moves<br />
between, linking, transgression<br />
another, short time (5<br />
minutesn), few stops (5 or 6),<br />
goes through empty spaces,<br />
same behaviour in the two<br />
spaces<br />
Non continuous<br />
break, pause, interruption<br />
Type 1 Type 2 Type 3 Type 4 Global interpretation globale<br />
(and validation methods)<br />
Fish<br />
Butterfly<br />
Ant<br />
Grass Hopper The behaviors reflect the<br />
No appropriation, the Controls its visit, Pedagogical Stroll, no motivation attitudes towards the exhibition<br />
visit is a neutral pleasure, curiosity concern<br />
concerning the and cultural consumption<br />
event<br />
exhibition or its topic (triangulation<br />
discourses)<br />
with visitors’<br />
Sleep-walking Explorers Pro<br />
Strollers<br />
The behaviors reflect the way<br />
The trip is a neutral The trip is the The trip must be The trip is the people live the moment spent<br />
event<br />
opportunity of controlled, efficient opportunity of in the subway, the <strong>value</strong>s of<br />
entairnment and spare time and passive relaxation subway consumptions (no<br />
efforts<br />
mentioned validation method)<br />
Tableau 3. Interpretations of appropriation strategies in two non-retail spaces<br />
This short literature review has shown that:<br />
-people use physical behaviours so as to create space, and therefore shopping, experience;<br />
-distinguishing two broad strategies, like Titus and Everett (1995), is too limited.<br />
The empirical investigations mentioned above were carried out in non-retail settings. Do the<br />
strategies also exist in retail setting?<br />
The aim of the first study was to answer this question.<br />
I.2. The Study:<br />
149
To analyse appropriation strategies in a retail setting, the study took place in the women’s<br />
clothing area of a hypermarket. Non participant and hidden observation allowed us to collect<br />
information on 99 shopping trips of different persons. The observation began when an adult<br />
woman, alone or accompanied, entered the zone. Her route and actions were registered on the<br />
map of the store.<br />
Semiotic, and more specifically the semiotic square, was used to analyse the information.<br />
Following Semprini (1990), we first carried out an analysis of the form of behaviour to<br />
distinguish strategies and then, on the basis of this analysis, interpret their meanings.<br />
Every shopping trip observed is a combination of a limited number of appropriation<br />
practices (see chart 1).<br />
Figure 1. Elements of a shopping trip<br />
Movement<br />
Walking straight<br />
Turning<br />
Turning around<br />
Stopping<br />
Gestual activity<br />
Basic gesture<br />
Touching<br />
Visual activity<br />
Basic visual activity<br />
Return to movement or<br />
Visual activity<br />
Basic visual activity<br />
Location search<br />
Looking at a particular product<br />
Looking at a group of products<br />
To look a product on oneself<br />
Looking at the label<br />
Looking and comparing<br />
different products<br />
Gestual activity<br />
Basic gesture<br />
Touching a product<br />
Examining a product<br />
Taking and lifting a product<br />
Leaning back a product<br />
S hi i h h lf<br />
Walking Stopping<br />
150
Two key moments of a shopping trip are stopping and walking. In each of these<br />
moments, specific appropriation practices take place. Their combinations define three types of<br />
stopping and four types of walking (see table 4), with an underlying fundamental and gradual<br />
opposition between continuity and discontinuity. For example, “walking” means following the<br />
flow of movement whereas “stopping” is a break in the movement.<br />
Continuous stopping (cS): the shopper looks at the products, touches a product, look at the label<br />
Non-discontinuous stopping (ndS): the shopper examines a product, takes and lifts a product, search in the shelf, leaves back a<br />
product, compares products, takes a product off its hanger. The shoppers does not repeat the actions.<br />
Discontinuous stopping (dS) : the shopper repeats once or more the following actions: examines a product, takes and lifts a product,<br />
search in the shelf, leaves back a product, compares products, takes a product off its hanger.<br />
Continuous walking (cW) : some stoppings (max three), some turns, no turnarounds.<br />
Non continuous walking (ncW) : several spread out stoppings, several turns, few turnarounds ;<br />
Non discontinuous walking (ndW) : concentrated stoppings, possibly one or two stoppings outside the concentration zone, few turns,<br />
turnarounds can be numerous ;<br />
Discontinuous walking (dW) : numerous stoppings, repeated turns and turnarounds.<br />
Table 4. Definitions of stoppings and walking types<br />
The combination of these types of stopping and these types of walking define four<br />
Types of walking/<br />
Types of stoppings<br />
cW ncW ndW dW<br />
CS Continuity Non-continuity Non-discontinuity Non-continuity<br />
NdS Non-discontinuity Non-continuity (one or<br />
two ndS)<br />
Non-discontinuity Discontinuity<br />
Discontinuity<br />
more ndS)<br />
(three or<br />
DS Non-discontinuity Discontinuity Non-discontinuity Discontinuity<br />
strategies: continuous, discontinuous, non-continuous, non-discontinuous (see table 5).<br />
Tableau 5. Appropriation strategies as combinations between stopping and walking<br />
Once the strategies identified, we have to interpret their meanings (see chart 2).<br />
The continuity strategy is the simplest one. Typically, the route is a straight line<br />
connecting two points outside the women’s clothing area. For example, the shopper went from<br />
the central aisle to the bakery or men’s clothing zone. The exploration of the area is minimised.<br />
The shopper rejects both the environment offer and the product offer of the store. The experience<br />
created is interpreted as utilitarian in the sense that the aim of the route is to go elsewhere than<br />
the women’s clothing area. We called this behaviour a “going by” utilitarian shopping trip.<br />
151
The second strategy is the most elaborated. Movement and stopping are both complex.<br />
The shopper visit many sub-zones in the women’s clothing area, each time with a great number<br />
of actions. The exploration is both wide and deep. The shopper interacts highly with the physical<br />
environment and with the products. The visit may be an opportunity to achieve a precise task,<br />
possibly planned before coming into the area, but this strategy is not an efficient one. Many of<br />
the actions can’t be explained by a will to find a product or information on a product as fast as<br />
possible. On the contrary, they seem only aimed at introducing playfulness in the shopping trip.<br />
The experience created is a ludic one, with the consumer acting actively on the environment. We<br />
called this strategy a ludic active shopping trip.<br />
The third strategy combines complex stopping and simple movement. The shopper<br />
interacts mainly with one sub-zone, in which nearly all the actions often numerous are<br />
accomplished. The other sub-zones are visited only to lead the consumer to the interaction sub-<br />
zone. The exploration is narrow and deep. There are just as many actions as necessary to find the<br />
way to the products and to look at them and to choose. The final aim is to find a product or<br />
information on the product as efficiently as possible. The experience created is functional. We<br />
called this strategy functional utilitarian shopping trip.<br />
The fourth strategy combines simple stopping and complex movement. The shopper visits<br />
different sub-zones but with globally very few actions in each of the sub-zones. The exploration<br />
is wide but superficial. There are interactions with the global environment but very few with the<br />
products. It’s just as if the shopper wants to linger in the store but without actually involving<br />
herself in acting upon it. Time seems to be dedicated to relaxation. The experience created is<br />
ludic, but with the consumer being rather passive. We called this strategy a passive ludic<br />
shopping trip.<br />
152
table 3).<br />
« Going by » functional<br />
experience<br />
Minimum exploration<br />
Continuity<br />
Functional utilitarian<br />
experience<br />
Narrow and deep<br />
exploration<br />
Non discontinuity<br />
Active ludic experience<br />
Wide and deep<br />
exploration<br />
Discontinuity<br />
Passive ludic experience<br />
Wide and superficial<br />
exploration<br />
Non-continuity<br />
Chart 2. Meanings of the appropriation strategies observed in a retail setting<br />
Our interpretation is convergent with other works for the same types of behaviours (see<br />
Most of studies on environment were drawn from the atmospherics model and implicitly<br />
assume that consumers are passive and that experience finds its roots in internal affective states.<br />
Our empirical study supports and complements the work of Titus and Everett (1995). It shows<br />
that the consumer is active in the creation of experience and that physical behaviours are key<br />
elements of the space experience.<br />
A new question is then raised: what dimensions of the physical environment can influence these<br />
strategies?<br />
153
From the appropriation perspective (De Certeau, 1980; Fischer, 1997; Moles and Rohmer, 1998),<br />
the organization of mobility (i.e. spatial configuration) must be studied rather than the senses-<br />
stimulating cues of the environment.<br />
II. Study 2: Influence of Spatial Configuration on Behavioural Strategies<br />
II.1. Theoretical Background<br />
From the point of view of Titus and Everett (1995), stimulating environment will lead to hedonic<br />
strategies whereas legible environment will lead to epistemic strategies. But some environmental<br />
cues are more closely linked with shoppers’ behavioural strategies.<br />
Shopping environments possessing symmetrical design properties (grid aisle patterns, orthogonal<br />
path angles) will be perceived as more legible and less stimulating than environments containing<br />
more asymmetrical design properties (Titus and Everett, 1995).<br />
For Moles and Rohmer (1982), the basic element of the environment‘s influence on behavioural<br />
strategies is physical discontinuity introduced in the environment. This takes two forms:<br />
-The enclosure is the degree to which the zone is open on the outside<br />
-The micro-events (Moles and Rohmer, 1977) are, inside a zone, variations of a stimulus. It is,<br />
for example, the end or the beginning of the shelf.<br />
Combinations between these two elements define three types of space:<br />
-Functional spaces aim at the efficiency of behaviour within them (Fischer, 1981). They are open<br />
on the outside and have little and foreseeable micro-events (Moles and Rohmer, 1982). These are<br />
spaces where nothing happens. They neither raise consumer interest nor make it easy and<br />
enjoyable for consumers to interact with it. Only necessary actions are accomplished. We should,<br />
therefore, find more functional utilitarian strategies in these functional spaces than in other<br />
spaces, everything else remaining constant.<br />
154
-Active ludic spaces aim at entertaining the shoppers. They are enclosed, with numerous micro-<br />
events, randomly dispatched. They introduce uncertainty and surprise in the environment. They<br />
should make it easy and enjoyable for people to behave in and raise the curiosity of shoppers.<br />
Therefore, there should be more active ludic strategies in these acitvie ludic spaces than in other<br />
spaces, everything else remaining constant.<br />
-Passive ludic spaces are open spaces, with micro-events but not at the same level as in active<br />
ludic spaces. The curiosity of consumers should be moderate leading to superficial actions.<br />
Therefore, there should be more passive ludic strategies in these passive ludic spaces than in<br />
other spaces, everything else remaining constant.<br />
Regarding “going by” functional strategies, we decided not to include them in the study. Indeed,<br />
these are a very particular case of relationship to shopping environment. The zone is, in this case,<br />
used as a short-cut between two other points outside the women’s clothing zone. This type of<br />
behaviour is the result of characteristics present in the environment surrounding, thus outside,<br />
the women’s clothing area. These are not dependent on spatial configuration of the women’s<br />
clothing area spatial configuration itself.<br />
Therefore, our three hypotheses are:<br />
H1. In an active ludic space, there are more active ludic strategies than in other types of spaces,<br />
everything else remaining constant<br />
H2. In a passive ludic space, there are more passive ludic strategies than in other types of spaces,<br />
everything else remaining constant<br />
H3. In a functional space, there are more functional utilitarian strategies than in other spaces,<br />
everything else remaining constant.<br />
155
To test these hypotheses we selected three spaces (see charts 3 to 5b). These were three women’s<br />
clothing zone of a hypermarket (Carrefour), and two speciality stores (C&A and Kiabi).<br />
Kiabi store is characteristic of an active ludic space. It is enclosed with a great number of micro-<br />
events (sub-area enclosed by high shelves, lots of shelves with different orientations).<br />
C&A store is a passive ludic space. Discontinuity is much lower than that of Kiabi. There are<br />
lots of micro-events but they introduce little discontinuity (shelves are not so long and not so<br />
high).<br />
Carrefour is a functional space. It is open on the outside and micro-events are not numerous and<br />
are predictable (straight, continued aisles with no breaks).<br />
156
Chart 3. Spatial configuration of the women’clothing area of Carrefour<br />
157
Glace<br />
Glace<br />
Chart 4. Spatial configuration of the women’clothing area of Kiabi<br />
158
Chart 5a. Spatial configuration of the women’clothing area of C&A (first floor)<br />
159
Chart 5b. Spatial configuration of the women’clothing area of C&A (second floor)<br />
To compare the number of appropriation strategies in each of these stores, we had to make sure<br />
that shopping contexts were the same. We, then, introduced certain control variables in our<br />
questionnaire (see chart 6):<br />
Shopping motives, either hedonic or utilitarian (Dawson and al, 1990)<br />
160
Shopping enjoyment (Schmidt and Spreng, 1996; Ohanian and Tashchian, 1992; Urbany and al,<br />
1996)<br />
Time pressure (Urbany and al, 1996; Putrevu and Ratchford, 1997)<br />
Planning of the purchase<br />
People accompanying the shopper<br />
Crowding (Hui and Bateson, 1991)<br />
Global shopping trip context (grocery shopping before or after the visit to the studied space, visit<br />
to another women’s clothing zone before or after the visit to the studied space).<br />
Spatial configuration<br />
Active ludic space<br />
Passive ludic space<br />
Functional space<br />
Appropriation strategies<br />
Active ludic strategies<br />
Passive ludic strategies<br />
Functional strategies<br />
Shopping contexts<br />
Shopping motives<br />
Shopping enjoyement<br />
Involvement<br />
Time pressure<br />
Planning of the purchase<br />
People accompanying the<br />
Chart 6. Frame of analysis for the study of spatial configuration’s influence on appropriation strategies<br />
Non participant and hidden observations were used. When the shopper went out of the zone, she<br />
was asked to answer the questionnaire. Data was collected during four weeks, seven half-days a<br />
week, Monday from 2 to 6 pm, Tuesday, Friday and Saturday from 10:30 am to 18:30 pm.<br />
726 usable observations and 450 questionnaires were collected. 251 concerned women shopping<br />
alone.<br />
There were 28 « going by » utilitarian strategies, 82 functional utilitarian strategies, 88 active<br />
ludic strategies and 53 passive ludic strategies. As mentioned, we will not consider the first<br />
strategy (“going by” functional). Only 223 observations were taken into account to test the<br />
hypotheses.<br />
161
No differences between the three different women’s clothing areas studied were found on the<br />
following control variables (see tables 6 and 7): shopping motives, shopping enjoyment, time<br />
pressure, involvement, crowding, grocery shopping trip before the visit to the studied space.<br />
For the remaining control variables, significant differences appeared. The results part of the<br />
paper therefore includes tests to check the influence of these variables on the results.<br />
Variables Utilitarian Hedonic Time pressure Crowding Involvement Involvement Shopping<br />
shopping shopping<br />
(interest and (sign) enjoyement<br />
motive motive<br />
pleasure)<br />
Signification ,224 ,360 ,381 ,468 ,089 ,226 ,532<br />
Table 6. Means comparison of the three women’s clothing areas for the control variables<br />
Variables Signification Contingency coefficient<br />
Grocery shopping before the visit 0.44 NV<br />
Grocery shopping after 0.000 0.28<br />
Visit to another women’clothing area before 0.008 0.2<br />
Visit to another women’s clothing area after 0.001 O.24<br />
Planning of the purchase 0.003 0.22<br />
Table 7. Comparison of the three women’s clothing areas. Khi-2 for the control variable (conditions fulfilled)<br />
II.2. Results<br />
Conditions of Khi-2 test are fulfilled for the comparison between spatial configuration and<br />
strategies. The differences are statistically significant (see table 8). The association is quite<br />
strong (contingence coefficient is 0.38).<br />
Spatial<br />
configuration<br />
Appropriation strategies Total<br />
Functional Active ludic Passive ludic<br />
Functional Number 43 11 21 75<br />
Theoretical<br />
number<br />
27,6 29,6 17,8 75,0<br />
Passive ludic Number 24 28 16 68<br />
Theoretical<br />
number<br />
25,0 26,8 16,2 68,0<br />
Active ludic Number 15 49 16 80<br />
Theoretical<br />
number<br />
29,4 31,6 19,0 80,0<br />
Total Number 82 88 53 223<br />
Theoretical<br />
number<br />
82,0 88,0 53,0 223,0<br />
Table 8.Khi-2 for appropriation strategies and spatial configuration (conditions fulfilled, Khi-2= 38.134 ; s =0.000 ; c = 0.382)<br />
- In the active ludic space, there are more active ludic strategies. H1 is accepted<br />
162
- In the passive ludic space, no particular strategy stood out. H2 is rejected<br />
- In the functional space, there are more functional utilitarian strategies. H3 is accepted.<br />
As we noticed differences in certain control variables, we checked if the results were still valid, whilst<br />
controlling these variables. We tested the hypothesis for each of the <strong>value</strong>s of the control variables for<br />
which there was a difference between stores (table 9).<br />
Conditions of Khi-2 are not fulfilled in the case of planned purchase. In every other case,<br />
conditions are fulfilled. Significant differences are found for each <strong>value</strong> of every control<br />
variable. H1 and H3 are in all cases accepted. H2 is in all cases rejected.<br />
Variables Signification % theoretical number under 5<br />
Grocery shopping after<br />
Yes 0.01
appropriation strategies adopted by shoppers. On the contrary, the third spatial configuration<br />
(passive ludic space) does not seem to influence shoppers’ behaviour.<br />
Conclusion<br />
These two studies show that:<br />
-Four behavioural strategies can be distinguished, each of which is a means for the consumer to<br />
create a specific type of experience (“going by” functional, functional utilitarian, active ludic,<br />
passive ludic);<br />
-Discontinuity introduced in space creates the framework for shoppers’ mobility and influences<br />
the types of strategies shoppers choose and the experience created. High discontinuity<br />
encourages active ludic experience, whereas high continuity encourages functional utilitarian<br />
experience.<br />
As few empirical works were carried out on the topic, our two studies are exploratory. Two main<br />
limits can be mentioned.<br />
The first limit deals with the classification of the shopping trips. Few methodological tools exist<br />
to measure the reliability of the allocation of the shopping trips to the different strategies.<br />
Although we have used triangulation (with external data, with other research, and through<br />
several classifications), the comparison to the classification of the shopping trips by another<br />
researcher could be a useful indicator of reliability. Regarding the interpretation of the strategies,<br />
164
we used triangulation with other works on the same topic. Results would be further validated by<br />
using triangulation with shopper’s discourses about their own behaviour.<br />
The second limit concerns the use of women’s clothing zones of different retail chains. Some<br />
external factors (spaces surrounding the shopping area, types of products, atmospheric elements)<br />
may have challenged the validity of the study of spatial configuration’s influence on<br />
appropriation strategies. Although we have tried to neutralise the influence of these external<br />
factors by comparing the shopping contexts of the different spaces studied, confirmatory studies<br />
should compare the zones of stores of a same retail chain.<br />
The theoretical contribution of these studies is twofold.<br />
Firstly, they show that the physical environment-shopper interaction is not only mediated by the<br />
internal states of the person. Body mobility in the shopping environment is a key element in the<br />
creation of experience and attachment to a place. The study supports works that have proposed<br />
that consumers are active in the consumption process (Holt, 19995; Holbrook, 1999). Moreover,<br />
consumer research seems to focus on the study of internal states, neglecting physical behaviours’<br />
analyse. Our studies illustrate the role of the body in the relational process with consumption<br />
objects (store being a specific consumption object). This work leads us to plead for a greater<br />
consideration of the role of the body in the understanding of the consumption process.<br />
Secondly, this research shows that spatial configuration is an influent dimension of physical<br />
environment. It influences shopping experience. Thus, the shopping environment does not only<br />
influence behaviour through sensorial stimuli. Store space management should then include two<br />
dimensions: one dealing with the management of sensorial cues, the other dealing with spatial<br />
configuration.<br />
165
A matrix of space management can then be proposed. Table 10 illustrates this with a few<br />
examples.<br />
Retailers should think about spatial configuration when they create store concepts. Using<br />
sensorial cues may not be efficient enough to create specific shopping experiences. The use of<br />
spatial configuration can reinforce the experience created and then the positioning of the store.<br />
The division of space in physical areas seem appropriate for “retailtainment” positioning. Grid<br />
aisles seem more appropriate for a functional positioning.<br />
Spatial<br />
configuration<br />
Active ludic<br />
(high discontinuity introduced<br />
by micro-events and enclosure)<br />
Functional<br />
(low continuity with little<br />
micro-events and openness)<br />
Management of sensorial cues<br />
Present Absent<br />
Sensorial active<br />
ludic space<br />
Nature & Découverte,<br />
Kiabi, Carrefour new<br />
concept, Nike Town,<br />
Ralph Lauren<br />
Sensorial<br />
functional space<br />
Cora (new concept)<br />
Non-sensorial<br />
active ludic space<br />
Troc de Lille, garage<br />
sales, flea markets<br />
Non-sensorial<br />
functional<br />
functional space<br />
Carrefour and Cora<br />
(early 1990’s concept)<br />
Table 10. A matrix of space management<br />
Two main research areas seem important to develop.<br />
Future research should endeavour to confirm the results of this work. Such studies should<br />
compare appropriation strategies in stores with different spatial configurations but belonging to<br />
the same retail chain.<br />
Other works could study the influence of the interaction between appropriation strategies, spatial<br />
configuration and shopping contexts on managerially relevant variables: consumption <strong>value</strong>s,<br />
<strong>satisfaction</strong>, loyalty, buying behaviour.<br />
166
Bibliography<br />
Aubert-Gamet V. and Cova B. (1999), Servicescapes : From Modern Non-Places to Postmodern Common<br />
Places, Journal of Business Research, n°44, p.37-45<br />
Babin B.J. and Attaway J.S. (2000), Atmospheric Affect as a Tool for Creating Value and<br />
Gaining Share of Customer, Journal of Business Research, 49, 91-99<br />
Bitner M.-J. (1992), Servicescapes : The Impact of Physical Surroundings on Customers and Employees,<br />
Journal of Marketing, vol 56, April, 57-71.<br />
Bonnes M. and Secchiaroli G. (1995), Environmental psychology : a psycho-social introduction, Sage<br />
Publications, London<br />
Chebat J-C. and Robicheaux R. (2001), The interplay of emotions and cognitions of consumers<br />
in the retail environment, Journal of Business Research, 54, 87-88<br />
Chebat J-C., Chebat C.G. and Vaillant D. (2001), Environmetal background music and in store<br />
selling, Journal of Business Research, 54, 115-123<br />
Darden W.R. and Dorsch M.J. (1990), An Action Strategy Approach to Examining Shopping<br />
Behavior, Journal of Business Research, 21, p.289-308<br />
Dawson S., Bloch P.H. and Ridway N.M. (1990), Shopping motives, emotional states, and retail<br />
outcomes, Journal of Retailing, vol.66, n°4, Winter, p.408-427<br />
De Certeau M. (1980), L’invention du quotidien. Arts de faire, Gallimard, ed. 1990, Paris.<br />
Everett P. B., Pieters R. G. M. and Titus P. A. (1994), The consumer-environment interaction : An<br />
introduction to the special issue, International Journal of Research in Marketing, vol. 11, p. 97-105<br />
Fischer G.N. (1981), La psychosociologie de l’espace, Paris, PUF<br />
Fischer G.N. (1997), Psychologie de l’environnement social, Dunod, Paris.<br />
Floch J.M. (1990), Etes-vous arpenteur ou somnambule? L’élaboration d’une typologie comportementale<br />
des voyageurs dans le métro, in Sémiotique, marketing et communications, Floch J.M., Paris, PUF, p.19-<br />
48<br />
167
Holbrook M.B. (1999), Introduction to consumer <strong>value</strong>, in Holbrook M.B., Consumer Value, a<br />
framework for analysis and research, London, Routledge, interpretive marketing research series, p.1-28<br />
Holt D.B. (1995), How Consumers Consume : A Typology of Consumption Practices, Journal of<br />
Consumer Research, Vol. 22, Juin, p.1-16<br />
Hui M.K. and Bateson J.E.G. (1991), Perceived Control and the Effects of Crowding and Consumer<br />
Choice on the Service Experience, Journal of Consumer Research, Vol. 18, Septembre, p.174-184<br />
Kotler P. (1973), Atmospherics as a Marketing Tool, Journal of Retailing, vol. 49, n°4, p.48-64<br />
Kozinets R.V., Sherry J.F., DeBerry-Spence B., Duhachek A., Nuttavuthisit K. and Storm D.<br />
(2002), Themed flagship brand stores in the new millennium : theory, practice, prospects,<br />
Journal of Retailing, 78, p. 17-19<br />
Lam Y.S. (2001), The Effects of Store Environment on Shopping Behaviors : A Critical Review,<br />
Advances in Consumer Research, 28, 190-197<br />
Moles A. and Rohmer E. (1982), Labyrinthes du vécu. L’espace : matière d’actions, Librairie des<br />
méridiens, collection sociologies au quotidien<br />
Moles A.A. and Rohmer E. (1977), Théorie des actes. Vers une écologie des actions, Paris, Casterman<br />
Moles A.A. and Rohmer E. (1998), Psychosociologie de l’espace, textes rassemblés, mis en forme et<br />
présentés par Victor Schwach, L’Harmattan, Collection Villes et Entreprises, Paris<br />
Ohanian R. and Tashchian A. (1992), Consumers’ Shopping Effort and Evaluation of Store Image<br />
Attributes : The Roles of Purchasing Involvement and Recreational Shopping Interest, Journal of Applied<br />
Business Research, Vol.8, N°4, 40-49<br />
Putrevu S. and Ratchford B.T. (1997), A Model of Search Behavior with an Application to Grocery<br />
Shopping, Journal of Retailing, vol. 73, n°4, p.463-486<br />
Russel J.A. and Mehrabian A. (1976), Environmental variables in consumer research, Journal of<br />
Consumer Research, vol.3, June, p.62-63<br />
Schmidt J.B. and Spreng R.A. (1996), A proposed model of external consumer information search,<br />
Journal of the Academy of Marketing Science, vol.24, n°3, p.246-256<br />
168
Semprini A. (1990), Métro, Réseau, Ville : essai de sémiotique topologique, Nouveaux Actes<br />
Sémiotiques, 8, p.1-49<br />
Sherry Jr J.F. (1998), Introduction, in ServiceScapes : The Concept of Place in Contemporary Markets,<br />
Sherry Jr J.F, ed, NTC Business Books, Chicago, p.1-24<br />
Stokols D. (1978), Environmental Psychology, Annual Review of Psychology, 29, 253-259<br />
Titus P. A. and Everett P. B. (1995), The Consumer Retail Search Process : A Conceptual Model and<br />
Research Agenda, Journal of the Academy of Marketing Science, vol. 23, n°2, p. 106-119<br />
Turley L.W. and Chebat J-C. (2002), Linking Retail Strategy, Atmospheric Design and Shopping<br />
Behaviour, Journal of Marketing Management, 18, 125-144<br />
Turley L.W. and Milliman R.E. (2000), Atmospheric Effects on Shopping Behavior : A Review<br />
of the Experimental Evidence, Journal of Business Research, 49, 193-211<br />
Urbany J.E., Dickson P.R. and Kalapurakal R. (1996), Price search in the retail grocery market, Journal of<br />
Marketing, vol.60, April, p.91-104<br />
Véron E. and Levasseur M. (1991), Ethnographie de l’Exposition : l’Espace, le Corps et le Sens, BPI<br />
Centre George Pompidou, Paris<br />
169
Asymmetric <strong>Quality</strong> Tier Competition: An Alternative Explanation<br />
K. Sivakumar*<br />
ABSTRACT<br />
Research has provided extensive empirical support for the phenomenon of high quality brands benefiting<br />
more from price reductions than low quality brands. This article offers a new explanation for quality tier<br />
competition by using a specific mechanism for evaluating price-quality tradeoffs between brands in<br />
different tiers and demonstrates the results using scanner panel data. By offering an explanation using a<br />
simple analytical framework, it contributes to the literature by offering an alternative to the more involved<br />
explanations.<br />
170
ASYMMETRIC QUALITY TIER COMPETITION: AN ALTERNATIVE EXPLANATION<br />
Several reasons make a comprehensive understanding of the competition between brands of frequently<br />
purchased consumer products in different quality tiers academically interesting and managerially<br />
important. First, private label brands have been available for decades (Stern 1966) and their recent<br />
successes indicate that they are here to stay (Wall Street Journal 1993a, b). They contribute to more than<br />
20% of grocery sales (Marketing News 1995), and private label brands as a group have a higher market<br />
share than the top-selling national brands in 77 of 250 supermarket categories (Quelch and Harding<br />
1996). Second, retailers consider successful introduction of store label brands to be a natural extension of<br />
their power base (Wall Street Journal 1992). Third, the national brands affect and are affected by private<br />
label brands. Either their own plants manufacture for private labels or they introduce no-frills brands to<br />
compete with private label brands (Wall Street Journal 1993a). Finally, managers of many grocery stores<br />
(particularly chain stores) believe that a strong presence in the private label market can increase their<br />
profit as well as store loyalty of their customers (Richardson, Jain, and Dick 1996).<br />
Research has consistently shown asymmetry in quality tier competition. That is, by reducing prices,<br />
high quality brands are more successful in making consumers “switch up” from low quality brands than<br />
low quality brands are in making customers “switch down” from high quality brands. Several<br />
explanations have been offered for this phenomenon (e.g., Allenby and Rossi 1991; Blattberg and<br />
Wisniewski 1989; Hardie, Johnson, and Fader 1993).<br />
The objective of the research reported here is to offer an alternative explanation for asymmetric<br />
quality tier competition. The explanation, which is simpler than existing explanations, is based on<br />
consumer evaluation of product attribute tradeoffs. The article also offers empirical support using<br />
scanner panel data.<br />
SELECTIVE LITERATURE REVIEW<br />
Competition between two brands is asymmetric when one brand gains more from a price reduction than<br />
the other brand gains from an identical price reduction. A robust finding has been that high quality brands<br />
(e.g., national brands) benefit more than low quality brands (e.g., store label brands). Blattbergand<br />
171
Wisniewski (1989) proposed a theory of asymmetric quality tier competition based on consumer<br />
heterogeneity in reservation price differential. Allenby and Rossi’s (1991) explanation for asymmetric<br />
competition is based on an income effect and rotating indifference curves and the resulting nonhomothetic<br />
choice. They considered the high quality brand a superior good and the low quality brand an inferior<br />
good. Hardie, Johnson, and Fader (1993) argued that loss aversion for quality is more than loss aversion<br />
for price. Though asymmetric quality tier competition was not the focus of their study, they suggested<br />
that loss aversion implied asymmetric competition.<br />
Carpenter et al. (1988) used weekly market share data to estimate a regression model using zeta<br />
scores (Cooper and Nakanishi 1983, 1988). The higher priced brands offering some tangible benefits to<br />
consumers are the least affected by price competition from the economy brands. Higher priced brands that<br />
compete on the basis of image without having tangible benefits influence both the economy brand and the<br />
brands that offer tangible benefits.<br />
Using store level data, Kumar and Leone (1988) demonstrated that within a store, a high priced<br />
brand is able to influence the sale of a low priced brand more than vice versa. They further showed that<br />
high quality brands also have a stronger ability to induce store switching than low quality brands.<br />
Kamakura and Russell (1989) used disaggregate data at the household to show that some pattern of<br />
asymmetric preferences (people loyal to a given quality brand are willing to buy some quantity of higher<br />
quality brand but not lower quality) in the market are due to the presence of different segments of<br />
consumers, each of which behaves symmetrically toward all the brands in the market. Using store level<br />
weekly aggregated data, Allenby (1989) demonstrated a method to estimate the asymmetric competition<br />
among brands and then to identify a parsimonious structure of market competition by grouping similar<br />
products together and estimating a restricted model. One of the grouping schemes that Allenby (1989)<br />
considered was based on price tiers. His results show that high priced brands affect low priced brands<br />
more than vice versa.<br />
172
Sivakumar and Raj (1997) showed that asymmetry favors high quality brands in brand choice<br />
aspect as well as in category purchase aspect. They also showed that though high quality brands benefit<br />
more than low quality brands from a price decrease, the former are less vulnerable a price increase.<br />
CONCEPTUAL FRAMEWORK<br />
The objective of this section is to provide an intuitive rationale for the conceptual framework and to use<br />
the idea to derive a number of useful results. The explanation for asymmetric quality tier competition<br />
proposed here is based on product attribute tradeoffs. The basic argument is that while evaluating<br />
products, consumers consider tradeoffs between product attributes. That is, in the context of choosing<br />
brands from different quality tiers, a consumer considers how much extra quality (s)he gets for the<br />
differential price that (s)he pays. Support for the use of price/quality tradeoffs in our conceptual<br />
framework is provided from three different perspectives progressing from the general to the specific: (1)<br />
intuition, (2) support for the broad notion of tradeoff, (3) support for the specific notion of tradeoff.<br />
Any multi-attribute framework in consumer choice can be conceptualized in terms of tradeoffs<br />
among attributes (e.g., Guadagni and Little 1983; Blattberg and Wisniewski 1989). However, to formally<br />
incorporate tradeoffs between quality and price, we need to focus on the notion of differences in attributes<br />
gained per unit difference in price and consider it as a component in the consumer’s utility function. In<br />
the context of purchase decisions, comparing attribute differences between alternatives is intuitively quite<br />
appealing. Some example notions taken from everyday life are “by spending $150 extra, you can get an<br />
IBM computer with the same features rather than an Acer computer”; “spending just $50 more than a<br />
black and white printer, you can get a color printer”; and “by adding $20 to the basic membership fee,<br />
you will be able to add your spouse to the AAA membership.” In all these cases, in addition to the<br />
individual alternatives’ attributes, the decision is based on tradeoffs. Therefore, there is strong intuitive<br />
support for using tradeoff in determining consumer behavior.<br />
The formal notion of tradeoff as “what you get” divided by “what you pay” is a well known one.<br />
Researchers such as Monroe (1990) and Zeithaml (1988) and others have used it, albeit in the context of<br />
determining the attractiveness of individual alternatives first and then comparing the <strong>value</strong>s across<br />
173
alternatives prior to the choice decision. The notion we use simply extends the principle for comparison<br />
of attribute differences across alternatives. More formally, there is evidence in the literature that people<br />
compare attributes of different alternatives in certain decision-making scenarios. The lexicographic<br />
decision rule involves comparing the attributes of different alternatives before deciding on the better<br />
alternatives (of course after determining that they tie on the other more important attributes). Examples of<br />
attribute comparison between alternatives also appear in other writings as well (e.g., Gale 1994).<br />
Therefore, from a conceptual perspective, comparing attributes between alternatives is reasonable.<br />
Finally, the specific rationale for considering tradeoffs in governing choice has been discussed in<br />
Simonson and Tversky (1992). Though their work focuses on attraction and compromise effects and<br />
changes in tradeoffs between background choice set and focal choice set (it does not consider changes in<br />
tradeoffs for a given choice set due to price changes nor are they concerned with price changes nor<br />
quality tier competition). The conceptual validity of our approach can be understood by their statement<br />
“... the choice between x and y then depends on whether the consumer is willing to pay $200 more for an<br />
additional 320K memory...” (Simonson and Tversky 1992 p. 282). Further, in their work on relative <strong>value</strong><br />
theory (though unrelated to quality tier competition), Hollman and Lynch (1997) compare different<br />
formulations of attribute tradeoffs and find that the formulation similar to the one used in this article<br />
supports the choice process better than those based on other operationalizations. Thus, the notion of<br />
quality/price tradeoff has intuitive appeal, face validity, and literature support.<br />
The following discussion is based on Figure 1. For that framework, let us consider a two-brand<br />
market with brands denoted H and L. Let the price differential be denoted ‘b’ and the quality differential<br />
be denoted ‘a’ in the base condition of no price promotion. Note that quality means the quality perceived<br />
by the consumer. The proposed conceptual framework (consistent with other work in the literature)<br />
assumes that high quality brand is high priced and low quality brand is low priced). However, we do not<br />
assume that price is necessarily an indicator of quality in the short run (for example, when price reduction<br />
occurs, the quality is not assumed to change in the short run). Further, most work in this research stream<br />
assume the existence of price or quality tiers and also assume that high priced tier is of higher quality<br />
174
(that is in the larger, between-tier context). However, there is no assumption made regarding the price-<br />
quality association in the local or within tier context. This is consistent with available empirical evidence<br />
in the literature (e.g., Sivakumar and Raj 1997).<br />
__________________<br />
Figure 1 about here<br />
__________________<br />
In the base condition, the tradeoff in choosing H can be written a/b; that is, the consumer gets a<br />
quality advantage of ‘a’ for paying a price differential of ‘b’. Because the tradeoff is described in terms of<br />
quality differential per unit price differential, it is easy to see that increases in tradeoff help H and<br />
decreases in tradeoff hurt H (alternatively help L). For example, when the quality of H increase, the<br />
quality differential increases and hence, the numerator increases which benefits H. Note that because we<br />
are considering a two-brand market, H’s gain is L’s loss and vice versa. That is, whether we start with the<br />
premise that the tradeoff as expressed here helps H or hurts L, the conclusions will be identical. As the<br />
purpose is to demonstrate the intuitive <strong>value</strong> of the tradeoff concept, the discussion in this section is<br />
limited to two brands. The subsequent sections examine a number of multi-brand market configurations.<br />
When H reduces price by x, the price differential reduces to (b - x) and therefore the tradeoff<br />
increases to a/(b - x). In contrast, when L reduces price by x, the price differential increases to (b + x) and<br />
the tradeoff decreases to a/(b + x). Also note that the research stream on quality tier competition is<br />
predicated upon the existence of distinct tiers. Therefore, it is reasonable to assume that x < b because if it<br />
is not, then the price of H will become less than the price of L. As the quality of H is more than that of L,<br />
the choice set is completely dominated by H and therefore not applicable in our context. Alternatively, if<br />
b is very small, there is no need to consider H and L as two different tiers but they can be considered<br />
similar to each other. Therefore, in all subsequent discussions, x is assumed to be less than b, which is<br />
reasonable for the context of our discussion.<br />
Based on the above discussion, the tradeoff in the base case is a/b, the tradeoff when H reduces<br />
price is a/(b - x), and the tradeoff when L reduces price is a/(b + x). Hence, the increase in tradeoff when<br />
H reduces price (in comparison with the base case) can be written as ∆H = a/(b - x) - a/b = ax/b(b - x). The<br />
175
decrease in tradeoff when L reduces price (in comparison with the base case) can be written as ∆L = a/b -<br />
a/(b + x) = ax/b(b + x). As (b + x) > (b - x), it is a mathematical fact that ∆H > ∆L. In other words,<br />
measured in terms of changes in tradeoffs, when H reduces price, the effect is stronger than that for a<br />
price reduction by L. Note that if we want to measure changes in tradeoffs relative to base tradeoff, both<br />
∆H and ∆L will only be adjusted by a scale factor represented by the tradeoff in the base scenario and<br />
therefore the conclusions derived subsequently will not change.<br />
Result #1: Price reductions benefit high-quality brands more than they do low-quality brands.<br />
Though we have used the generic word “benefit” in this section to demonstrate the intuitive nature<br />
of the results, subsequent sections demonstrate that these can be easily carried over to choice share<br />
scenarios. Note that Result #1 is consistent with overwhelming research evidence that asymmetry favors<br />
high quality brands (Allenby and Rossi 1991; Blattberg and Wisniewski 1989; Carpenter et al. 1988;<br />
Hardie, Fader, and Johnson 1993; Kamakura and Russell 1988; Sivakumar and Raj 1997). Consistency of<br />
that finding with previous research suggests that the proposed conceptual framework has face validity.<br />
A measure of the degree of asymmetric competition given by Z = ∆H - ∆L is a function of a, b, and<br />
x. After simplification, the degree of asymmetry can be denoted by<br />
(Equation 1) Z = 2ax 2 /b(b 2 - x 2 ).<br />
Because the asymmetry is defined in this way, it favors H if the measure is positive and it favors L<br />
if the measure is negative. Therefore increase in tradeoffs favors the choice of H and decrease favors L.<br />
Note that though our conceptual discussion focuses on “tradeoff” as the entity of interest, in an empirical<br />
sense, the tradeoff will (among other factors) affect the utility derived from the brands. Our conceptual<br />
development simply focuses on the differences in tradeoffs (after controlling for all other variables, as is<br />
often done in existing research) and therefore, the benefits as discussed in the conceptual development are<br />
differences in tradeoffs. This is just done for ease of exposition. As these tradeoffs are just one component<br />
of a brand’s utility, the weighting factor (i.e., the coefficient of the tradeoff variable) must be empirically<br />
determined (the utility will consist of a component given by the multiple of the tradeoff variable and the<br />
estimated coefficient). Incorporation of this coefficient and the resultant utility changes (rather than<br />
176
changes in tradeoffs as is done in the conceptual framework) will not affect the nature of the results<br />
because the weighting factor will only be a scale factor in the discussions and derivations. This is further<br />
demonstrated in the next section in which the discussion is based on choice theory framework.<br />
Though the theory development is based on the tradeoff variable itself, practical modeling of<br />
consumer choice often involves the modeling of utilities based on marketing variables and using the<br />
utility functions to determine the choice probabilities of various alternatives and the associated<br />
movements for price changes. The derivations and empirical analysis described subsequently incorporate<br />
the tradeoff variable as a part of the broader consumer utility function.<br />
Effect of <strong>Quality</strong> Differential on the Magnitude of Asymmetry<br />
A useful result that could be derived from the preceding expression for Z by differentiating it with respect<br />
to ‘a,’ the quality differential between the brands), is<br />
(Equation 2) dZ/da = 2x 2 /[b(b 2 -x 2 )] > 0.<br />
Result #2: Ceteris paribus, as the quality differential increases, the asymmetry favoring high<br />
quality brand increases.<br />
Products that give more <strong>value</strong> for the same price have a higher level of asymmetric advantage. As<br />
mentioned previously, ‘a’ can be visualized as a perceived quality differential. The perceived quality may<br />
be a function of many factors, including marketing management variables, consumer-specific variables,<br />
and product-specific variables.<br />
Effect of Price Differential on the Magnitude of Asymmetry<br />
Another result could be derived by differentiating Z with respect to the price differential.<br />
(Equation 3) dZ/db = -2ax 2 (3b 2 -x 2 )/(b 3 -bx 2 ) 2 < 0.<br />
Result #3: Ceteris paribus, as the price differential increases, the asymmetry favoring high quality<br />
brand decreases.<br />
Therefore, for a given quality differential, increasing the price of a high quality brand will be<br />
detrimental to the favorable asymmetry toward it. Here again, the price differential can be considered a<br />
perceived price differential.<br />
177
As Bronnenberg and Wathieu (1996) use loss aversion (first proposed by Hardie, Johnson, and<br />
Fader 1993) to explain asymmetric competition as opposed to the explanation based on price/quality<br />
tradeoffs in our paper, the two works are not directly comparable. This is because from a conceptual<br />
perspective, while tradeoff is a fundamental process that gives rise to asymmetry in our paper, the<br />
expression happens to be the result arising from the loss aversion phenomenon in Bronnenberg and<br />
Wathieu (1996). Proposition 1 derived in their paper, though more detailed, basically implies that as the<br />
quality differential goes up, the asymmetry favoring H (L) increases (decreases) and as the price<br />
differential goes up, the asymmetry favoring H (L) decreases (increases). This conclusion is consistent<br />
with the results derived in our paper (Result #2 and Result #3) which also state that increase in quality<br />
differential enhances asymmetry favoring H and increase in price differential subdues the asymmetry<br />
favoring H. Therefore, though the explanations and the specificity of results for asymmetric competition<br />
are different between our paper and Bronnenberg and Wathieu’s (1996) work, there is consistency in the<br />
outcome of the two explanations, thereby providing further face validity for our framework. Interestingly,<br />
we are able to derive qualitatively similar results without resort to a strong assumption of loss aversion.<br />
Further, as described below, our framework also enables the derivation of some useful results related to<br />
pricing strategies for different quality tiers. This is also a new feature that distinguishes our research from<br />
other research on quality tier competition.<br />
A key contribution of the conceptual framework is that it offers a new explanation for the main<br />
effect prediction of asymmetric quality tier competition that is consistent with research in this area<br />
(Allenby and Rossi 1991; Blattberg and Wisniewski 1989; Hardie, Johnson, and Fader 1993; Sivakumar<br />
and Raj 1997). A positive feature of this new explanation is that the hypotheses are based on the well-<br />
accepted notion of tradeoffs and hence based on weaker (i.e., less restrictive) assumptions compared to<br />
stronger (i.e., more restrictive) assumptions used in existing research. For example, Blattberg and<br />
Wisniewski’s (1989) explanation is based on a particular distribution of reservation prices, Allenby and<br />
Rossi’s (1991) explanation is based on rotating indifference curves, and Hardie, Johnson, and Fader’s<br />
(1993) explanation is based on loss aversion – all of which are stronger and more restrictive assumptions<br />
178
than the one based on the notion of tradeoff used in this research. Furthermore, the two additional results<br />
(Result #2 and Result #3), though not exactly the same, are consistent with the findings of Bronnenberg<br />
and Wathieu (1996).<br />
EMPIRICAL ILLUSTRATION<br />
The key contribution of this manuscript is in the simplicity of the alternative explanation, and the<br />
comprehensive way in which the intuitive notion of tradeoff appears to apply in a wide variety of market<br />
configurations. The key aspect of any potential empirical analysis is that all the results follow directly<br />
from the positive coefficient for the tradeoff variable (therein also lies the simplicity and contribution of<br />
this manuscript). Thus, empirical analysis in this article is somewhat different compared to other articles.<br />
However, the exact quantitative impact of the various price changes must be verified using real numbers.<br />
Given the nature of the results derived and the notion that it is not possible to obtain all possible scenarios<br />
and all possible operationalizations of tradeoff variables using one data set, the objectives of the empirical<br />
analysis are rather specific and threefold. The first objective is to show that the findings are valid in real-<br />
life situations. The second objective is to get an idea about the magnitudes of the various coefficients so<br />
that the exact impact of price changes can be quantified.<br />
Model<br />
The well-known logit model of brand choice (Ben-Akiva and Lerman 1985; Guadagni and Little 1983;<br />
McFadden 1981) is used for empirical illustration of the proposed conceptual framework. In the logit<br />
model, the choice probability of each alternative is based on the utility derived from that alternative. If Ui<br />
denotes the utility derived from brand i, then the probability of choosing the alternative i can be written as<br />
e Ui /Σj e Uj . The method is developed by using a two-brand market consisting of one high quality brand<br />
H and one low quality brand L (without loss of generality), though the empirical analysis incorporates<br />
multiple brands in the market. The utilities for brands H and L can now be written as<br />
UH = QH + VH + βPH + τ(QH - QL)/(PH - PL) + εH; UL = QL + VL + βPL + εL.<br />
Where QH, QL = quality of H and L, respectively; VH, VH = brand specific utilities not accounted by other<br />
variables included in the model; PH, PL = prices of H and L respectively.<br />
179
Those conceptually based utility functions must be reduced to estimable form for the estimation of<br />
appropriate coefficients in the model. Further, some of the coefficients must be normalized to zero to<br />
make the model estimable.<br />
The above utility functions can be rewritten as UH = αH + βPH + γ/(PH - PL) and UL = αL + βPL,<br />
where αH = QH + VH and γ = τ(QH - QL) and αL = QL + VL.<br />
For logit model, a constant terms must be normalized to zero. Therefore, the components of the<br />
model to be estimated (after exclusion of the variables other than those involving price) will be<br />
UH = αH + βPH + γ/(PH-PL); UL = βPL.<br />
Note that the exact determination of QH - QL is not necessary to understand the combined effect of<br />
price including the tradeoff variable. The reason is that to assess the effect of price, all we need are the<br />
coefficients associated with variables containing price in one form or another.<br />
Data<br />
The dataset used in the empirical analysis is purchase data provided by IRI under the auspices of the<br />
Marketing Science Institute. In addition to the faced price, manufacturers’ coupon and store coupon<br />
redemption were recorded, as well as in-store features and displays and competing brand prices. A<br />
demographic file contains relevant information on family size, income, and so on. The purchase records<br />
covered a two-year period for a large retail chain. On the basis of the first 26 weeks, families not<br />
purchasing at least once in two months were excluded. The four top brands are included in the analysis,<br />
three national brands (denoted H1, H2, and H3) and one store label brand (denoted L). H2 and H3 are minor<br />
brands. In addition to the four-brand analysis reported here, an analysis was conducted without the two<br />
minor brands. The conclusions are fully consistent with the conclusions drawn here. Therefore, to<br />
conserve space, only the results of the four-brand analysis are reported and discussed. The data<br />
management procedures are similar to those followed in existing research using similar data sets. Data for<br />
purchase occasions during the first one third of the time period were used to initialize the brand loyalty<br />
variable (described subsequently) and the remaining data were used to estimate the models.<br />
Model Variables<br />
180
The variables incorporated in the model were based on previous research on choice models using scanner<br />
panel data. However, an important addition is a variable to incorporate the tradeoffs. Demographic<br />
variables are included to account for some heterogeneity among consumers (we estimate models with and<br />
without demographic variables and the results are consistent). The proposed formulation is compared with<br />
models not incorporating the tradeoffs by means of likelihood ratio tests. Managerial implications can be<br />
delineated by calculating the inter-brand movements after incorporating the tradeoff construct. The<br />
deterministic components of the utilities for several models follow.<br />
Model 1 (model with price, but without tradeoff)<br />
UHi = αHi + θ1DisplayHi + θ2FeatureHi + θ3iFamilysize + θ4iIncome + θ5BrandloyaltyHi + βPriceHi<br />
UL = θ1DisplayL + θ2FeatureL + θ5BrandloyaltyL + βPriceL.<br />
Model 2 (model without price, but with tradeoff)<br />
UHi=αHi+θ1DisplayHi+θ2FeatureHi+θ3iFamilysize+θ4iIncome+θ5BrandloyaltyHi+γ/(PriceHi-PriceL)<br />
UL = θ1DisplayL + θ2FeatureL + θ5BrandloyaltyL.<br />
Model 3 (model with price and tradeoff)<br />
UHi=αHi+θ1DisplayHi+θ2FeatureHi+θ3iFamilysize+θ4iIncome+θ5BrandloyaltyHi+βPriceHi<br />
+γ/(PriceHi- PriceL)<br />
UL = θ1DisplayL + θ2FeatureL + θ5BrandloyaltyL + βPriceL.<br />
Model 4 (parsimonious model with price and tradeoff)<br />
UHi = αHi + θ1DisplayHi + θ2FeatureHi + θ5BrandloyaltyHi + βPriceHi + γ/(PriceHi - PriceL)<br />
UL = θ1DisplayL + θ2FeatureL + θ5BrandloyaltyL + βPriceL.<br />
Operationalization of Variables<br />
Model variables were patterned after existing research investigating substantive topics on quality tier<br />
competition. The idea is to use logically consistent operationalizations that have been utilized in existing<br />
research. Display and feature are categoric variables coded as 1 if present and 0 if absent. Price is the<br />
faced price (for the non-purchased brands) or paid price (for the purchased brands) as has been used in<br />
181
ecent existing research (Sivakumar and Raj 1997). Brand loyalty is defined as the cumulative proportion<br />
of purchases devoted to the brand until the current purchase occasion (Sivakumar and Raj 1997). Family<br />
size and income are ordinal variables that capture family income and size. Finally, the price differential<br />
(for the tradeoff variable) is the difference in actual paid prices.<br />
RESULTS<br />
The estimation results for the models are reported in Table 1. The coefficients are of the appropriate sign<br />
and the relevant variables contribute significantly toward explaining brand choice. Model fit can be<br />
assessed by comparing the loglikelihoods or U 2 . Nested models could be compared by using a likelihood<br />
ratio test. In nested models, twice the difference in loglikelihood between two models is distributed as chi<br />
squared with degrees of freedom given by the difference the numbers of model parameters.<br />
___________________<br />
Table 1 about here<br />
___________________<br />
The model incorporating the tradeoff variable did significantly better than the model not<br />
incorporating it. Therefore, the tradeoff variable improves the fit considerably. It is interesting to note that<br />
after incorporation of the tradeoff variable, the inclusion of price does not improve model fit significantly.<br />
Hereafter, we will only discuss model M4. These computations are provided in Table 2.<br />
___________________<br />
Table 2 about here<br />
___________________<br />
A measure of asymmetry is needed for the proposed logit choice model to test the analytical results<br />
derived earlier. Mela, Gupta, and Lehmann (1997) and Sivakumar and Raj (1997) respectively note that<br />
cross elasticity may not be an appropriate measure for depicting price effects in general and asymmetry in<br />
particular. They note that a measure of interbrand movement or its variant is needed to accurately<br />
understand asymmetry (i.e., asymmetry favors H if the movement from L to H for a given price reduction<br />
by H is more than the movement from H to L for the same price reduction by L). Therefore, to measure<br />
the extent of asymmetry, we need to compare movements for equal price changes by H and L<br />
respectively. Based on the general approach suggested by Mela, Gupta, and Lehmann (1997) and<br />
182
Sivakumar and Raj (1997), inter-brand movements can be derived analytically as we demonstrated earlier<br />
in the theory development. However, analytical derivations are based on infinitesimal calculus. While<br />
useful to theorize, in order to get an idea of actual movements and also to see whether it works with real<br />
numbers, we need to construct realistic scenarios. Therefore, share changes are computed by<br />
incorporating various <strong>value</strong>s in the utility functions and making suitable assumptions to ensure that the<br />
market share and other key market characteristics are kept close to reality as possible. These computations<br />
presented in Table 2 demonstrates that between any pair of high-low tier brands (i.e., H1 and L, H2 and L,<br />
and H3 and L), the results derived earlier holds good. Note that the asymmetry holds good for all<br />
combinations irrespective of their market share. Also, to avoid overcrowding of the table, some of the<br />
intermediate calculations discussed below are not given in the table but the final results are.<br />
Evidence for Asymmetric <strong>Quality</strong> Tier Competition. Result 1 derived from the conceptual framework<br />
implies that the competition between a high quality brand and a low quality brand is asymmetric,<br />
consistent with the predominant research findings in marketing. For example, Table 2 indicates a<br />
movement of 6.26 market share points from L to H1 when H1 reduces its price by 20 cents and a<br />
movement of 3.78 market share points from H1 to L when L reduces its price by 20 cents. Clearly<br />
asymmetry favors H1 and the asymmetric advantage amounts to 2.48 market share points. The asymmetric<br />
advantage of H2 over L is 0.53 and that of H3 over L is 0.70.<br />
Role of Price Differential. Ceteris paribus (i.e., for a given quality differential), increasing the price<br />
differential was hypothesized to result in smaller asymmetric advantage for high quality brands (H2).<br />
Table 2 illustrates the asymmetry for the base scenario and the scenario in which the price differential is<br />
increased 10 cents. The larger price differential results in an asymmetry (favoring H1 over L) of 1.58<br />
market share point versus asymmetry of 2.48 market share points in the base case (a difference of 0.9),<br />
confirming result 2. Similar results hold for competition between H2 and L and that between H3 and L.<br />
Role of <strong>Quality</strong> Differential. Ceteris paribus (i.e., for a given price differential), increasing the quality<br />
differential was hypothesized to result in greater asymmetric advantage for high quality brands (Result 3).<br />
Table 2 illustrates the asymmetry for the base scenario and the scenario in which the quality differential is<br />
183
increased by 10% (conceptually the same as increasing the <strong>value</strong> of γ by 10%). Consistent with result 3,<br />
the larger quality differential results in asymmetry (favoring H1 over L) of 2.74 market share points<br />
versus the asymmetry of 2.48 market share points in the base case (a difference of 0.26).<br />
DISCUSSION<br />
Managerial Implications. An important implication of the proposed framework is that arbitrarily<br />
increasing the price of high quality brands without a corresponding increase in their perceived quality<br />
may not be a desirable strategy. Price increases should be accompanied by perceived improvements in<br />
quality. This conclusion is consistent with Bronnenberg and Wathieu (1996) who use a different<br />
conceptual framework to explain asymmetric competition. A second implication is that the tradeoff<br />
between frequency and depth of price cut is not uniform across all brands, but is contingent upon the<br />
perceived quality level of the brands.<br />
The primary outcome suggested by all existing frameworks is that quality tier competition is<br />
asymmetric (though the degree of asymmetry is a function of various factors). However, the rationale for<br />
such asymmetry has implications for how a company tries to achieve superior performance in the<br />
marketplace. Blattberg and Wisniewski’s (1989) explanation is based on consumer heterogeneity.<br />
Therefore, the asymmetry does not depend on individual customers but on a particular pattern of<br />
heterogeneity. The explanations by Allenby and Rossi (1991), Hardie, Johnson, and Fader (1993) and<br />
Bronnenberg and Wathieu (1996), as well as the research reported here, are based on individual-level<br />
phenomena.<br />
Though most frameworks in the literature have only focused on the nature of quality tier<br />
competition (Result #1), the other results derived here are consistent with the conceptual rationale of the<br />
other explanations for asymmetric competition.<br />
Research Implications. Much work needs to be done in terms of formal comparison of the four<br />
frameworks, as well as to understand the psychological processes involved in decision making when<br />
consumers chose between brands. An interesting research issue is the way consumers (seem to)<br />
operationalize the tradeoff variable. Though a positive feature of this work is the demonstration of the<br />
184
esults for a number of operationalizations, it would be useful to identify segments of consumers who use<br />
different methods so that a more detailed understanding of the market place is obtained. Research based<br />
on in-depth interviews and other qualitative methods such as process tracing may shed more light on the<br />
processes leading to choice. Also, different conceptual frameworks may be appropriate for different<br />
product categories or different sets of consumers. Investigations of those issues should lead to a more<br />
detailed understanding of the competition between different quality tiers.<br />
Interestingly, all research on asymmetric quality tier competition in a brand choice context is based<br />
on scanner panel data rather than the direct measurement of consumer perceptions. Also, studies on<br />
consumer perceptions of store label brands (e.g., Bettman 1974; Burger and Schott; Coe 1991; Frank and<br />
Boyd 1965; Richardson, Jain, and Dick 1996) do not model the competition between quality tiers. Hence,<br />
the research domain could be meaningfully extended by a triangulation of those two research streams.<br />
Another useful avenue for future research is meta-analytical integration of research on<br />
quality tier competition. Sethuraman (1995) attempted a statistical summary of 261 cross-price<br />
elasticities estimated in his article. However, meta-analysis is needed on the evidence from other<br />
studies demonstrating asymmetry in quality tier competition. Similarly, more work is needed in<br />
understanding and delineating the boundary conditions of asymmetric quality tier competition.<br />
185
REFERENCES<br />
Allenby GM. A unified approach to identifying, estimating and testing demand structures with aggregate<br />
scanner data. Mark Sci 1989;8(3):265-280.<br />
Allenby GM, Rossi PE. <strong>Quality</strong> perceptions and asymmetric switching between brands. Mark Sci<br />
1991;10(3):185-204.<br />
Ben-Akiva M, Lerman S. Discrete choice analysis. Cambridge (MA): M.I.T. Press, 1985.<br />
Bettman JR. Relationship of information-processing attitude structures to private brand purchasing<br />
behavior. J Appl Psychol 1974;59(1):79-83.<br />
Blattberg RC, Wisniewski KJ. Price-induced patterns of competition. Mark Sci 1989;8(4):291-310.<br />
Bronnenberg B, Wathieu L. Asymmetric promotion effects and brand positioning. Mark Sci<br />
1996;15(4):379-394.<br />
Burger PC, Schott B. Can private brand buyers be identified? J Mark Res 1972;9(2):219-222 (May).<br />
Carpenter GS, Cooper LG, Hanssens DM, Midgley DF. Modeling asymmetric competition. Mark Sci<br />
1988;7(4):393-412.<br />
Coe B. Private versus national preference among lower and middle-income consumers. J Retailing<br />
1971;4(3):61-72.<br />
Fader PS, Lattin JM. Accounting for heterogeneity and nonstationarity in a cross-sectional model of<br />
consumer purchase behavior. Mark Sci 1991;12(3):304-317.<br />
Gale BT. Managing customer <strong>value</strong>. New York (NY): The Free Press, 1994.<br />
Guadagni PM, Little JDC. A logit model of brand choice calibrated on scanner data. Mark Sci<br />
1983;2:203-38 (Summer).<br />
Hardie B, Johnson E, Fader P. Modeling loss aversion and reference dependence effects on brand choice.<br />
Mark Sci 1993;12(4):378-394.<br />
Hoch SJ. How should national brands think about private labels? Sloan Manage Rev 1996;37(2):89-96.<br />
Hoch SJ, Dreze X, Purk M. EDLP, hi-lo, and margin arithmetic. J Mark 1994;58(4):16-29 (October).<br />
Hollman F, Lynch J. Relative <strong>value</strong> theory: an analytic model of contextual choice analysis. Working<br />
Paper, University of Florida, 1997.<br />
Kamakura WA, Russell GJ. A probabilistic choice model for market segmentation and elasticity structure.<br />
J Mark Res 1989;26(4):379-390 (November).<br />
Kumar V, Leone RP. Measuring the effect of retail store promotions on brand and store substitution. J<br />
Mark Res 1988;35(2):178-185 (May).<br />
Lal R, Rao R. Supermarket competition: the case of every day low pricing. Mark Sci 1997;16(1):60-80.<br />
186
Mela CF, Gupta S, Lehmann DR. Long term impact of promotion and advertising on consumer brand<br />
choice. J Mark Res 1997;35(2):248-261 (May).<br />
Monroe KB. Pricing: making profitable decisions, 2nd edition. New York (NY): McGraw-Hill Publishing<br />
Company, 1990.<br />
Quelch JA, Harding D. Brands versus private labels: fighting to win. Harvard Bus Rev 1996;74(1):99-109<br />
(January-February).<br />
Raju JS, Srinivasan V, Lal R. The effects of brand loyalty on competitive price promotional strategies.<br />
Manage Sci 1990;36(3):276-304 (March).<br />
Richardson PS, Jain AK, Dick A. Household store brand proneness: a framework. J Retailing<br />
1996;72(2):159-185.<br />
Sethuraman R. A meta-analysis of national brand and store brand cross-promotional price elasticities.<br />
Mark Lett 1995;6(4):275-286.<br />
Sethuraman R. A model of how discounting high-priced brands affects the sales of low-priced brands. J<br />
Mark Res 1996;33(4):399-409 (November).<br />
Simonson I, Tversky A. Choice in context: tradeoff contrast and extremeness aversion. J Mark Res<br />
1992;29(3):281-95 (August).<br />
Sivakumar K, Raj SP. <strong>Quality</strong> tier competition: how price change influences brand choice and<br />
category choice. J Mark 1997;61(3):71-84 (July).<br />
Stern L. The new world of private labels. California Manage Rev 1966;8(3):43-50.<br />
Wall Street Journal, The. Soft drink giants sit up and take notice as sales of store brands show more fizz.<br />
1992, March 6, B1.<br />
Wall Street Journal, The. Brand names are getting steamed up to peel off their private-label rivals. 1993,<br />
April 21, B1 and B5.<br />
Wall Street Journal, The. Advertisers seek to save brands from price cuts. 1993, April 21, B1 - B6.<br />
Zeithaml VA. Consumers’ perceptions of price, quality, and <strong>value</strong>: a means-end model and synthesis of<br />
evidence. J Mark 1988;52(3):2-22 (July).<br />
187
Table 1. Estimation Results<br />
____________________________________________________________________________________<br />
Variables Model M1 Model M2 Model M3 Model M4<br />
(Price only) (Tradeoff only) (Price & Tradeoff) (Reduced /<br />
Price &<br />
Tradeoff)<br />
____________________________________________________________________________________<br />
Brand constant (A) 0.896* -1.067** -0.716 -0.683<br />
Brand constant (B) 1.353** -0.483 -0.145 -0.579<br />
Brand constant (C) 0.575 -1.884*** -1.509** -2.107***<br />
Display 1.685*** 1.597*** 1.564*** 1.557***<br />
Feature 1.240*** 1.006*** 0.932** 0.904**<br />
Family size (A) -0.036 -0.032 -0.030<br />
Family size (B) 0.015 0.029 0.352<br />
Family size (C) -0.034 -0.042 -0.038<br />
Income (A) 0.022 0.034 0.038<br />
Income (B) -0.151 -0.142 -0.141<br />
Income (C) -0.132 -0.111 -0.111<br />
Brand Loyalty 4.694*** 4.654*** 4.675*** 4.707***<br />
Price -0.0195*** -0.0054 -0.0051<br />
Tradeoff 31.117*** 28.52*** 28.836***<br />
____________________________________________________________________________________<br />
Model χ 2 (d.f.) 2330.9 (13) 2353.0 (13) 2353.6 (14) 2348.7 (8)<br />
Model Log-likelihood -297.1 -286.07 -285.74 -288.29<br />
Model Fit (U 2 ) 0.797 0.804 0.805 0.803<br />
____________________________________________________________________________________<br />
* significant at p < 0.10; ** significant at p < 0.05; *** significant at p < 0.01.<br />
Relevant model comparisons based on likelihood ratio tests:<br />
(a) Incorporation of Tradeoff helps to improve fit (M3 better than M1 at p < 0.01).<br />
(b) Reduced models are not significantly worse than the full models (M4 not worse than M3 at p > 0.1).<br />
(c) After incorporating the tradeoff term, the straight price does not improve the fit of the model<br />
significantly (M3 not better than M2).<br />
188
Table 2. Empirical Illustration of Aspects of <strong>Quality</strong> Tier Competition<br />
______________________________________________________________________________<br />
____________________________<br />
Modifications to<br />
the Base Scenario<br />
Tradeoff Price<br />
<strong>Quality</strong> Base Scenario<br />
Coefficient Differential Differ.<br />
Increases Increases<br />
Increases<br />
______________________________________________________________________________<br />
____________________________<br />
Competition between H1 and L<br />
Degree of asymmetry (H1 over L)<br />
3.00<br />
1.58<br />
2.74<br />
Competition between H 2 and L<br />
Degree of asymmetry (H 2 over L)<br />
0.65<br />
0.35<br />
0.59<br />
Competition between H 3 and L<br />
Degree of asymmetry (H 3 over L) 0.70 0.87<br />
0.43 0.78<br />
____________________________________________________________________________________________<br />
_____<br />
Figure 1. Attribute Tradeoffs as an Explanation for <strong>Quality</strong> Tier Competition<br />
189<br />
2.48<br />
0.53
Q<br />
U<br />
A<br />
L<br />
I<br />
T<br />
a<br />
H H’<br />
x<br />
b<br />
PRICE<br />
190<br />
L L’<br />
x
Modeling The Impact Of Internet Atmospherics On Surfer Behavior<br />
Marie-Odile Richard, École des Hautes Études Commerciales<br />
Abstract<br />
The goal of this study was to examine the impact of atmospherics cues concerning Internet<br />
advertising on the behavior of consumers and its impact on several variables such as attitudes,<br />
involvement, exploratory behavior, pre-purchase and purchase intentions. Atmospherics cues<br />
were central (structure, informativeness, effectiveness and navigational characteristics) and<br />
peripheral (entertainment). A conceptual model is developed based on a review of existing<br />
findings and tested with a random sample of real consumers who responded to a questionnaire<br />
after navigating through an existing pharmaceutical web site. Structural equations modeling was<br />
used to test nine major hypotheses. Among key findings, all atmospherics cues were impacting<br />
the other constructs, with the central cues mostly affecting involvement and exploratory<br />
behavior, while entertainment affected involvement and attitude. These findings contribute to<br />
theoretical and managerial understanding of the role of Internet atmospherics on the web<br />
navigation behavior of visitors.<br />
191
MODELING THE IMPACT OF INTERNET ATMOSPHERICS ON SURFER BEHAVIOR<br />
1. Introduction<br />
The Internet is growing in importance since the concept of a product is becoming more<br />
information-based (Brännback, 1997) and offers the opportunity to separate information about a<br />
product (or service) from the product itself (Rayport and Sviokla, 1994).<br />
A 1997 study of URLs in mass media ads showed that nearly one-fourth of the non-users of<br />
the Internet were planning to log on within the next month, and their principal destination was a<br />
health site (Maddox et al., 1997; Maddox, 1999). For current users of the Internet, health-related<br />
sites ranked second as a destination within the next month, with 51% planning to visit one site<br />
(Maddox et al., 1997). Of those who seek medical data online, 52% are looking for information<br />
on diseases and 33% on pharmaceuticals (Miller and Reents, 1998). As Internet usage continues<br />
to grow across the world, the focus for many companies is slowly shifting from merely creating<br />
to more strategic aspects involving how to best use this medium. One of the most important<br />
objectives of firms on the Web remains effective communications with consumers. This<br />
emphasizes the importance of developing and testing systematic models of the Web as an<br />
advertising or communication tool.<br />
Most research on online communication of information is in the context of online retailing. This<br />
study seeks to expand the scope of models of consumer behavior and responses to Web site and interface<br />
characteristics. More explicitely, it proposes and empirically tests a general model of consumer behavior<br />
and responses to Web site environmental cues based on theoretical frameworks for Web atmospherics in a<br />
retail setting developed by Mehrabian and Russell (1974); Donovan and Rossiter (1982) and, more<br />
recently, Dailey (2002) and Eroglu, Machleit and Davis (2001).<br />
Our study differs from and extends the literature in several ways: first, unlike most previous research,<br />
we propose and test our model in the general context of information-seeking in online retailing<br />
specifically. Second, in the spirit of Eroglu et al. (2001) we provide a broader, more comprehensive<br />
model integrating research on Web site environmental cues (to stimulate the search for information),<br />
internal states conceptualized by cognitive and affective aspects of the surfers’ behavior, and finally<br />
outcomes. Third, our study goes beyond theoretical model development; our empirical testing is<br />
performed in the context of a real-world pharmaceutical Web site. Finally, we apply a significantly more<br />
sophisticated methodology that allows us to test the structure and validity of our proposed model.<br />
We begin by briefly discussing previous literature relevant to the antecedents, processing and<br />
consequences of interest to our model. This is followed by the presentation of our proposed<br />
192
model along with development of the hypotheses. The following section describes the empirical<br />
approach and the data used to test the model. We then present the results of empirical testing,<br />
and conclude with a discussion of the finding, implications and limitations.<br />
2. Conceptual Background<br />
Turley and Milliman (2000) identified over 60 published studies with significant<br />
relationships between store atmospherics and consumer behavior. Atmospherics has been shown<br />
to influence consumer perceptions of retail products (Obermiller and Bitner, 1984), and store<br />
approach/avoidance behaviors such as consumers' intention and decision to frequent and spend<br />
money in a store (Turley and Milliman, 2000; Donovan and Rossiter, 1982; Donovan et al.,<br />
1994; Darden et al, 1983; Stanley and Sewall, 1976).<br />
Kotler (1973) defined atmospherics as “the intentional control and structuring of environmental cues”<br />
or as “the conscious design of space to create certain buyer effects.” Milliman and Fugate (1993) defined<br />
atmospheric cues as “any component within an individual’s perceptual field that stimulates one’s senses.”<br />
Atmospheric cues may be more influential than other marketing inputs that are not present at the point of<br />
purchase (Baker, 1986; Baker et al., 1994) and be more influential in the purchase decision than the<br />
product itself (Kotler, 1973).<br />
To explain the influence of atmospherics on consumers, the Mehrabian–Russell Affect<br />
Model (Mehrabian and Russell, 1974; Turley and Milliman, 2000), is based on Stimulus-<br />
Organism-Response paradigm. Features of the environment (S) cause behavioral responses<br />
(liking the store, enjoyment of shopping in it, willingness to spend time in it, to explore the<br />
environment, or to return to it, likelihood of spending more money than intended, feelings of<br />
friendliness to others) (Donovan et al, 1994) within it (internet, in our case) by altering consumer<br />
affect emotional states (O) (such as pleasure, arousal and sometimes dominance) (Mehrabian and<br />
Russell, 1974; Donovan and Rossiter, 1982), depending on individual personality traits analyzed<br />
in the Zuckerman‘s sensation-seeking scale (Grossbart et al., 1975).<br />
By changing Kotler’s (1973) definition of brick-and-mortar atmospherics, Web atmospherics<br />
can be defined as the “conscious designing of Web environments to create positive effects<br />
(positive affect and/or cognitions) in surfers in order to develop positive consumer responses<br />
(site revisiting, browsing)” (Dailey, 2002). For Milliman and Fugate (1993), a Web atmospheric<br />
cue is comparable to a brick-and-mortar atmospheric cue and can be described as “any Web<br />
interface component within an individual's perceptual field that stimulates one's senses.”<br />
193
Eroglu et al (2001) proposed a typology that divides Web atmospheric tools in two groups:<br />
high task-relevant and low task-relevant cues. On one hand, high task-relevant cues facilitate and<br />
enable the consumer's shopping goal attainment (i.e., descriptions or pictures of the merchandise,<br />
price, navigation cues, etc.). On the other hand, low task-relevant cues are defined as being<br />
inconsequential to the completion of the shopping task (i.e., colors, borders and background<br />
patterns, typestyles and fonts, animation, music and sounds, entertainment, decorative pictures,<br />
etc.) (Eroglu et al., 2001).<br />
Unfortunately, Web atmospheric research has been limited to why atmospherics influence<br />
surfers. In fact, researchers have not examined specific atmospheric cues (i.e., colors, layout,<br />
navigation cues, etc.), but have focused on general atmospheric cues (high task-relevant cues,<br />
positive atmospheres), decreasing the probability of finding theories that adequately explain the<br />
unique influence of these cues (Turley and Milliman, 2000).<br />
Donovan and Rossiter’s (1982) study used students subjects and measured attitudes and<br />
intentions rather than shopping behavior. They did not assess the contribution of emotional<br />
factors relative to cognitive factors except by Anderson (1986). The Donovan, Rossiter and<br />
Marcoolyn’ study (1994) further looked at the extent to which the Mehrabian-Russell model<br />
predicted the cognitive factors (e.g., perception of merchandise quality, variety, <strong>value</strong> for<br />
money) independently of affective factors. It is important to analyze emotional states<br />
independently from cognitive variables and both together.<br />
Two types of involvement influence the motivation to attend and process product information. In our<br />
study, we assumed that situational involvement is present as our sample is constituted of students.<br />
Situational involvement for the product is more likely to result in a goal-directed behavior (temporary,<br />
considered linked to a short-term visit and occurs only in the context of a situation).<br />
The Elaboration Likelihood Model (ELM) suggests that low-involvement subjects process<br />
information through the peripheral rather than the central route (Petty, Cacioppo and Schumann, 1983b),<br />
relying more heavily on cues as opposed to detailed and elaborate product specific information. With the<br />
Internet, marketers can use a large number of cues (e.g., search engines, keywords, search arguments) to<br />
attract and influence consumers (McGaughey and Mason, 1998).<br />
In conclusion, in the Web medium, consumers choose the amount of exposure to a Web site,<br />
and decide what to watch, when, and how much. If they find that the Web site is not useful or<br />
interesting, they will immediately end their visit. Attitude is positive when there is ease of<br />
navigation through a database or ability to get an overview of the structure of the site. It leads to<br />
an increase of the number of visits to the site, in curiosity, in depth of search, in exploratory<br />
194
ehavior and in duration time spent. Source attractiveness also influences the amount of<br />
information processing. Effectiveness of information content develops emotional responses such<br />
as pleasure and arousal that in turn mediate a variety of approach-avoidance behaviors. The latter<br />
are characterized as a general liking of the environment; attitude toward returning to the same<br />
Web sites; shopping time and in-depth exploration of the Web sites.<br />
3. Conceptual Model<br />
Following MacInnis and Jaworski (1989), our model, represented in figure 1, can be divided into<br />
three parts: antecedents, processing, and consequences. More specifically, as reported by Mehrabian and<br />
Russell (1974) and Donovan and Rossiter (1982), it can also be divided into three parts: Stimuli,<br />
Organism and Outcomes. Dailey (2002) mentioned two types of stimuli: high relevant cues and low-<br />
relevant cues. We chose to place most of our environmental variables related to the Internet (i.e.,<br />
navigational cues, structure and informativeness of the site, its entertainment quality and effectiveness of<br />
its information content) in the first category because our concern is to evaluate the impact of the<br />
information content on the other variables. In the second category, figured entertainment of the Web site,<br />
which is linked to the first category, but indirectly. These dimensions lead to the processing variables<br />
such as approach/avoidance behaviors (attitudes), an affective variable, and exploratory behavior and<br />
involvement categorized as cognitive variables (i.e., related to information search process). We place the<br />
focus on affective and cognitive variables that have been proposed for the model in figure 1 to test if it is<br />
applicable to the Internet. We complete this model by the outcomes such as pre-purchase intentions (or<br />
involvement in purchase decisions) and purchase behavior related to the product.<br />
[Insert figure 1 around here]<br />
We now describe our model in more detail, and systematically develop all the hypotheses that will be<br />
tested in the study.<br />
3.1 Internet Atmospherics (Environmental) Cues<br />
Internet atmospherics cues, the central focus of our model, are critical to the effectiveness of a web<br />
site since it is entirely in the customers’ power to decide which Web pages to browse, for how long, and<br />
how much information to obtain.<br />
In an attempt to develop a better understanding of what constitutes high-quality Web content, we<br />
propose several factors that are important for surfers to evaluate when navigating through a Web site.<br />
Among them, we have selected: “Navigational characteristics of the Web site;” “Structure” and<br />
“Effectiveness of its content;” “Informativeness” and “Entertainment.”<br />
Liu and Arnett (2000) conceptualized Web site quality as the accuracy, completeness, relevancy, ease<br />
of use, speed, search functionality and organization of the site. They explained that e-commerce success is<br />
related to four major factors: quality of information (relevant and accurate information), system use,<br />
195
playfulness (enjoy visiting Web sites, motivate customers to experience participation), and system design<br />
quality (well organized hyperlinks, high speed of accessing the Web).<br />
Aladwani and Palvia (2002) defined perceived Web site quality, as an user’s evaluation of a<br />
Web site’s features that responded to user’s needs and which reflected overall excellence of it.<br />
They proposed three dimensions of Web site quality: technical adequacy, Web content, and Web<br />
appearance, and found instead four dimensions. Web content is found to be a bidimensional<br />
variable with specific content (reflecting concerns related to finding specific details about<br />
products/services, customer support, privacy policies, other important information) and content<br />
quality (information usefulness, completeness, and accuracy).<br />
3.1.1 Navigational characteristics of the Web Site<br />
Rose et al (1999) hightlighted the importance of download speed, Web interface, search<br />
functionality, measurement of Web success, security, and Internet standards. The characteristics<br />
of the products and of the Web sites that are encountered early in online browsing can<br />
significantly influence the level of arousal and pleasure (emotions) that consumers experience,<br />
and therefore can influence their responses. Menon and Kahn (2002) show that if the starting<br />
experiences encountered by potential customers in a simulated Internet shopping trip are high in<br />
pleasure, then there is a positive influence on approach behaviors (attitudes) and shoppers tend to<br />
engage in more arousing activities such as more exploration, more tendencies to examine new<br />
products and stores (= exploratory behavior), and higher response to promotional incentives.<br />
Further, navigational cues are important in creating or not impeding the flow experienced by<br />
surfers (Hoffman and Novak, 1996; Novak et al., 2000), which in turn influences formation of a<br />
positive attitude (Baronas and Louis, 1988; Regan and Fazio, 1977; Eagly and Chaiken, 1993;<br />
Csikszentmihalyi, 1977). Finally, Lynch, Kent and Srinivasan (2001) show that site quality may<br />
influence surfers’ probability of buying during the visit and returning to visit the Web site. Thus:<br />
H1: When consumers surf the Web, navigational characteristics of the Web site are positively related to:<br />
a) attitude toward the Web site, b) involvement, c) exploratory behavior, d) involvement in<br />
purchase decisions for the product, and e) purchase intentions.<br />
3.1.2. Structure<br />
Huizingh (2000) reported that there are four different navigational structure types: a tree, a tree with a<br />
return-to-home page button, a tree with some horizontal links and an extensive network. Most of Web<br />
196
sites have quite a simple structure, over 60% of the Web sites he studied have a tree structure or a tree<br />
structure supplemented with a back to home page button.<br />
In the ELM, there are two routes to persuasion: the central route which requires “high effort scrutiny<br />
of attitude-relevant information,” and the peripheral route which requires less effort to evaluate attitude<br />
objects. Attitude change is often determined by both processes. Peripheral processes include the use of<br />
simple decision rules, conditioning processes, and others that do not imply scrutiny of the central merits<br />
of the attitude object (Petty and Cacioppo, 1986). Among the central cues are: structure of a Web site<br />
(STR), its informativeness (INFO) and the effectiveness of its information content (EFF).<br />
Attitudes: In the past, the attitude towards the ad (Aad) was measured by means of likeability-items.<br />
De Pelsmacker et al. (1998) measured the relationship between Aad and emotional content, information<br />
content and format characteristics of advertising stimuli. Among the three basic dimensions of Aad,<br />
structure is one of the two cognitive components. This dimension mostly explain the attitude towards the<br />
brand which, in turn, is positively correlated with purchase intention (De Pelsmacker, Dedock, and<br />
Geuens, 1998).<br />
Involvement: When motivation, ability and opportunity to process information are<br />
high, consumers process via the central route, focusing and elaborating on (central)<br />
cues relevant to their needs, <strong>value</strong>s and interests (involvement). When they are low or<br />
lacking, consumers engage in less effortful processing and use peripheral cues.<br />
Traditional and modified ELM differentiated by the degree of activeness and<br />
consciousness when shoppers process ad messages. The modified ELM for web ad<br />
has more active and more conscious cognitive processing than the traditional one as<br />
the exposure to ad messages is totally voluntary. When people are highly-involved and<br />
do not have any ability to process information, peripheral aspects of ad messages are<br />
used. However, when these people have the ability to process, they engage in active<br />
and conscious processing or message-related cognitive thinking. Two factors are<br />
determinant: initial attitude and argument quality of ad messages.<br />
Exploratory behavior: We did not find any studies on the impact of the structure of the Web site on<br />
visitors’ exploratory behavior. However, it seems logical that for people who like scrolling and browsing<br />
throughout the Internet and various types of sites, the structure of the Web site visited might be important<br />
and positively influence their behavior. However, it is only a supposition, to be tested later.<br />
There has been no research reported about a possible relationship between the structure and the<br />
visitors’ purchase intentions, so we surmise that more complex structures might lead to higher intentions<br />
to purchase. Thus:<br />
197
H2: When consumers surf the Web, the structure of the Web site is positively related to: a)<br />
attitude toward the Web site, b) involvement, c) exploratory behavior, and d) purchase<br />
intentions.<br />
3.1.3 Effectiveness of the information content<br />
Among the criteria established for evaluating the information content of commercial Web pages,<br />
Dholakia and Rego (1998) cited price or <strong>value</strong>, components or contents, performance, and quality. Web<br />
page designers are confronted with the problem of how to design pages to make them popular. There are<br />
two basic creative strategies: either design the page to be cool with colored backgrounds, Java applets,<br />
sound and video files, or focus on functional presentation of content instead of on novelty and visual<br />
appeal.<br />
Kelsey and Misic (1999) mentioned that content and site are evaluated in terms of currency and<br />
presentation. Top sites are chosen in terms of their unique functionality, design or both (Kelsey and<br />
Misic, 1999; Johnson and Misic, 1999). Misic and Johnson (1999) described Web-related criteria as<br />
finding contact information and main page, speed, uniqueness of functionality, ease of navigation,<br />
counter, currency, wording, color and style.<br />
Bell and Tang (1998) studied six specific industry sectors and their Web sites rated highly on ease of<br />
access, content and structure and poorly in the number of unique features.<br />
Attitude toward the site. Earlier research on the ad <strong>value</strong> tended to focus on information (Cox, 1962;<br />
Ratchford, 1980; Stigler, 1961), information content (Resnik and Stern, 1977; Stern, Krugman and<br />
Resnik,1981), and how informative the ad is perceived to be (Aaker and Norris, 1982; King et al, 1987).<br />
Forrester Research indicates in a recent study that high-quality content, ease of use, speed and<br />
frequency of updating are the four main factors contributing to repeat visits (Numbers, 1999). Education<br />
is where these Web site characteristics were first described and studied. Siu and Chau (1998) noted that<br />
students perceive the information content of educational Web sites as important and useful, but believe<br />
that the Web site should be technically easy to master. These authors labeled technological quality and<br />
appropriateness as information content, whereas quality and originality and perceived loading speed can<br />
be termed as navigability and quality. Mechitov, Moshkovich and Underwood (2001) compared academic<br />
Web sites and studied the characteristics of a university Web site and the students’ perception of its<br />
overall effectiveness. A good Web site is found to be attractive, well-designed (high quality images,<br />
animation or 3D-graphics without low downloading times), informative with well-identified links to other<br />
pages, the necessary information displayed concisely and logically, with highly informative content and<br />
easy access to it, and inclusion of a variety of Web pages devoted to entertainment.<br />
However, another research found results at variance with those of previous studies. The information<br />
content of Web pages, per se, does not appear to attract visitors to the Web sites (Dholakia and Rego,<br />
1998). Web page popularity, however, is found to be strongly and positively influenced by the renewal<br />
198
and the updating of the information brought to the site in the last three-month period (Dholakia and Rego,<br />
1998). From this study emerged the notion that the Web is a dynamic and interactive medium, and online<br />
consumers are variety-seeking and interested people in staying “current” with the firm's offerings<br />
(Dholakia and Rego, 1998). The number of other Web pages to which a home page is linked, is also<br />
found to be a significant determinant of popularity (Dholakia and Rego, 1998). Therefore, they support<br />
the notion that online consumers “surfing the Web” with no prior search objectives appear to be a<br />
significant number of the visitors to a commercial Web site (Dholakia and Rego, 1998).<br />
Abels, White and Hahn (1997) looked at the features able to influence a relatively knowledgeable and<br />
experienced group of WWW users in surfing Web pages. There studied six criteria: use, content, linkage,<br />
structure, special feature, and appearance. Respondents preferred useful sites, with current information<br />
and the structure both intelligible and apparent. They emphasized ease of use with the ability to navigate<br />
easily through a verbal database or to see an overview of the structure so they could make judgments<br />
quickly about both content and navigation tools. They reacted negatively to sites with superficial content,<br />
advertisements, and poor navigational characteristics. Some factors such as content and organization have<br />
been identified as important by library and information professionals (Rettig, 1996). Ease of navigation<br />
and the ability to determine the structure easily and quickly have been identified through the interface<br />
design approach (Shneiderman, 1996). Surfers strongly emphasized content but not appearance. The<br />
findings showed that content and ease of use are the most important criteria affecting continued use of a<br />
Web site.<br />
Other authors try to identify the key and effective dimensions of business-to-consumer sites as<br />
perceived by online consumers, as there is little documentation on that subject (Ranganathan and<br />
Ganapathy, 2002). They operationalize a B2C site as a site on the WWW where a product or service can<br />
be purchased. Usefulness of a B2C site depends not only on the information content, but also on tools<br />
furnished for the navigation and the evaluation of the usefulness of the information.<br />
Korgaonkar and Wolin (1999) studied the motivations and concern of Web users by applying the uses<br />
and gratifications concept to this new medium (Eighmey and McCord, 1998; Mukherji et al., 1998).<br />
Application of this concept improved understanding of Web usage. Among the factors designed to<br />
capture the surfers’ gratifications and concerns, figured social escapism motivation (~ entertainment),<br />
Information motivation (for self-education and information needs), Economic motivation (information for<br />
learning, educational purposes, shopping and buying motivations). King (1996) confirmed the findings of<br />
previous authors concerning the requirements of surfers who favor regularly updated, well organized, and<br />
easy to read Web sites.<br />
Involvement. As previously seen in the ELM, the effectiveness of its information content figures<br />
among the central cues. De Pelsmacker, Dedock, and Geuens (1998) mentioned two other cognitive<br />
dimensions, informativeness (EFF and INFO) and comprehension (STR). These two dimensions can<br />
199
significantly explain attitude towards the brand which, in turn, is positively related to purchase intention.<br />
We will study if there is a direct and positive relationship between EFF and PURI, and also the causal<br />
impact of EFF on involvement in purchase decision, which seems to be a mediator in the relation between<br />
EFF and PURI. However, Okasaki and Rivas (2002) examined the information content variable on<br />
Japanese Multinational Corporations homepages and found that some cues identified by Resnik and Stern<br />
(1977) concerning information content should be present to help consumers make a clever purchasing<br />
decision.<br />
Several researchers pointed out that the Internet contained a higher level of<br />
information, compared to other media, and it is a highly involved medium with a mix of<br />
electronic and print media (Yoon, 2000; Novak and Hoffman, 1996). Thus, we consider<br />
the measure of information level as an indicator of the degree of involvement (Yoon,<br />
2000; Okasaki and Rivas, 2002). From purely utilitarian motives (functional attributes),<br />
surfers may be highly involved in an ad because of the information related to a subject<br />
area (type of disease) or toward information or a product/service (OTC drug) (= EFF)<br />
(Park and Young, 1983, 1986).<br />
Exploratory behavior. No research has been published on the impact of<br />
effectiveness of the information content on surfers’ exploratory behavior. When surfers<br />
find an interesting topic to investigate through the Internet, the quality of the information<br />
content induces them to scroll and browse in order to get the most complete and<br />
appropriate information about it.<br />
Outcomes. Others studies consider characteristics of a Web site such as content that refers to the<br />
information, features or services offered, whereas design is the way used by marketers to show the<br />
content to the surfers. More specifically, contents have an important role in influencing the purchase<br />
decision process of a consumer (in our case, pre-purchase and purchase intentions). Design of a Web site<br />
must contain three important elements. First, there are the ease of and time taken for surfing, second, the<br />
pages downloaded (Kelsey and Misic, 1999), and finally, the improvement of its visual appeal. Thus,<br />
consistent links to each page of the site, use of effective navigation buttons, and an index to this site are<br />
important to develop when designing a B2C web site. Thus:<br />
H3: When consumers surf the Web, the effectiveness of the information content of the Web site is<br />
positively related to: a) attitude toward the Web site, b) involvement, c) exploratory behavior, d)<br />
involvement in purchase decisions for the product, and e) purchase intentions.<br />
200
3.1.4. Entertainment<br />
According to Ducoffe (1996), Informativeness and Entertainment are perceptual<br />
antecedents of ad <strong>value</strong>. Media context has an important influence on the ad <strong>value</strong>, since<br />
previous studies demonstrated that consumers think that newspapers carry the most informative,<br />
reliable and believable ad, whereas TV and radio rate lower on these attributes (Bauer and<br />
Greyser, 1968, Becker, Martino and Towners, 1976). On the other hand, TV ads are the most<br />
entertaining (Larkin, 1979).<br />
According to McQuail (1983), the <strong>value</strong> of entertainment rests in its capability to fulfill<br />
audience needs for escapism, diversion, aesthetic enjoyment or emotional release. People<br />
grading Web ads high in <strong>value</strong> would also tend to develop favorable general attitudes.<br />
Entertainment would retain an independent and direct impact on overall ad attitudes since both<br />
of these constructs have affective dimensions that are not captured by ad <strong>value</strong>. Content<br />
(informativeness) and form (entertainment), crucial to its effectiveness, are both important<br />
predictors of ad <strong>value</strong> (Aaker, Batra and Myers, 1992). For the Web, one <strong>value</strong>-enhancing<br />
benefit of its interactive ability is the access it will afford consumers to an ad that is timely,<br />
relevant and convenient, all crucial determinants of its informativeness (Ducoffe, 1996).<br />
As stated by Eighmey and McCord (1995, 1997), a commercial Web site is a complex<br />
assortment of uses and gratifications, among which entertainment or stimulation would be the<br />
leading dimension, followed by informativeness, involvement with others, personal involvement<br />
with information content, and executional dimensions related to information overload. Still,<br />
Eighmey and McCord (1997) showed a consistency with previous uses and gratifications studies<br />
and studies of TV commercials and Web sites. In fact, effective Web sites correspond to the<br />
valuable intersection of informativeness and entertainment, as surfers are attracted to information<br />
that adds <strong>value</strong> in both form and substance.<br />
Entertainment factor is similar but not identical to terms that load highly on an entertaining<br />
dimension often found in raters evaluations of TV commercials. Stern (1990) mentioned that<br />
consumers who consider an ad as entertaining are more likely to credit the brand with positive<br />
attributes and are more likely to intend to purchase the brand.<br />
As previously seen in the ELM, we can name attractive sources (in our case, similar to<br />
entertainment), music (Chebat et al., 2001), humor, and visuals as peripheral cues (Cho, 1999; Shavitt et<br />
al., 1994). This affective variable influences attitude towards the brand which impacts purchase intention<br />
(De Pelsmacker et al., 1998).<br />
201
Involvement toward an ad based on <strong>value</strong>-expressive motives (aesthetics) leads to<br />
affective involvement because it appeals emotionally or aesthetically to them (= ENT)<br />
(Park and Young, 1983, 1986). Thus:<br />
H4: When consumers surf the Web, entertainment provided by the Web site is positively related<br />
to their a) attitude and b) involvement.<br />
3.1.5. Informativeness<br />
The kind of information that is more often available in a Web site is specific product<br />
information (Huizingh, 2000). The perception of the Web site content can be measured by the<br />
degree to which it is considered to be informative (Huizingh, 2000). An informative site provides<br />
detailed and specific information with respect to products, the company or other relevant topics<br />
(Huizingh, 2000).<br />
The informativeness scale looks like the informative/relevant scales that have emerged in<br />
previous studies of print ads and TV commercials. The Web site Informativeness factor focuses<br />
on the site as an interactive provider. Intelligent, resourceful, knowledgeable adjectives fit the<br />
Web site very well but seem less appropriate to TV commercials. The relevance of<br />
informativeness is supported by the Market Facts TeleNation survey which found that the No.1<br />
online use is gathering news or information (Maddox, 1998).<br />
Based on social psychology theory, Chen et al. (1999, 2002) assume that attitude toward the<br />
ad (Aad) is an equally useful indicator of site <strong>value</strong>, but the unidimensionality of Aad does not<br />
provide a complete explanation of consumers’ ratings of the ad (Pashupati, 1994). Consequently,<br />
Chen et al. (1999, 2002) developed three scales that better correlate and explain attitudes toward<br />
a Web site.<br />
Entertainment and Informativeness scales relate to the overall Attitude toward the site (Ast)<br />
and to each other. These factors accounted for significant variance in the overall Attitude scale.<br />
Correlations among entertainment and Informativeness are lower than the correlations of each<br />
dimension with Ast scale. All the factors score high for Web sites having high Ast scores.<br />
Though Informativeness scores are generally higher than 70, entertainment scores vary<br />
substantially. This variation in entertainment scores indicates that when the primary purpose of a<br />
Web site is to convey information, users score it more on Informativeness and less on<br />
Entertainment. With medium Ast scores, Entertainment scores are fairly low (E
high score on every dimension to gain a high Ast score. These scales complement each other and<br />
offer some clues on how to improve Web site design and presentation. All the results came from<br />
data collected by undergraduate and graduate students from corporate and institutional Web sites<br />
(Chen et al., 1999).<br />
Chen et al. (2002) studied some selected web sites with Web development professionals and<br />
online Web users in order to evaluate the scales linked to the attitude toward a Web site. Web<br />
user’s interests were dramatically different from students’ interests used in the previous study:<br />
This new set of sites produced higher correlations. Entertainment, Informativeness and<br />
Organization reappeared even when site selection was done in terms of a single good/bad site<br />
evaluation. However, correlations among the three dimensions and Ast changed meaningfully<br />
with the type of respondents. For Web developers, informativeness was the best predictor<br />
followed closely by organization, entertainment being far distant from them. Meanwhile, for the<br />
university-based Web users, Informativeness is also the best predictor with <strong>value</strong> close to that of<br />
professionals, followed by entertainment which is seven times higher than the one of<br />
professionals, and finally organization which is the half of the <strong>value</strong> found for professionals.<br />
Thus, a good site will be informative and well-organized but may or not be entertaining (high<br />
Ast scores), whereas for low Ast scores, variances within Informativeness and Organization are<br />
relatively large and Entertainment is low.<br />
Chen et al. (2001) applied these scales to pharmacy sites. As Informativeness is an essential<br />
factor in these sites, they did not differ much in informativeness <strong>value</strong>, causing higher correlation<br />
and less variation than other types of Web sites. Another dimension, i.e., <strong>trust</strong>, should be added.<br />
However, they found that Informativeness remained the key factor and Trust did not add any<br />
predictive <strong>value</strong> to the dimensions of Ast. Consequently, a separate <strong>trust</strong> factor is rejected. Ast<br />
remains reliable and unidimensional across changes in types of Web sites, respondents, and<br />
methods of administration. The three factors accounted for most of the variance in Ast and these<br />
three dimensions correlated with each other and with Ast significantly.<br />
As previously seen in the ELM, informativeness is a central cue that impacts attitude, which<br />
in turn influences purchase intention (De Pelsmacker et al., 1998). According to Chen (1999), as<br />
informativeness is closely related to attitude toward a Web site, we expect to find a significant<br />
relationship between these factors.<br />
No research has been published on the influence of informativeness on consumers’<br />
exploratory behavior. However, we can surmise that informativeness, characterized by the<br />
203
usefulness and the resourcefulness of the site, is important for improving the browsing and the<br />
scrolling of surfers. Thus:<br />
H5: When consumers surf the Web, informativeness of the Web site is positively related to: a)<br />
their attitude toward the Web site and b) their exploratory behavior.<br />
3.2. Processing Variables<br />
3.2.1. Attitudes toward the Web Site (Approach/Avoidance Behavior)<br />
Aad is an indicator of ad effectiveness. Researchers created scales for ratings print ads and<br />
TV commercials (Wells, 1964; Wells, Leavitt and McConville, 1970; Leavitt, 1970; Aaker and<br />
Bruzzone, 1981; Aaker and Stayman, 1990; Moldovan, 1985; Schlinger, 1979; Pashupati, 1994).<br />
One approach for measuring Aad has also proved useful in applied and academic settings<br />
(Shimp, 1981; MacKenzie, Lutz and Belch, 1986, Baker and Lutz, 1988, Brown and Stayman,<br />
1992).<br />
The first processing and affective component of our model is attitude. Stevenson, Bruner and<br />
Kumar (2000) showed that attitude toward the Web site is a useful construct in understanding the<br />
impact of a Web site. Shimp (1981), Batra and Ray (1986), MacKenzie, Lutz and Belch (1986),<br />
Brown and Stayman (1992) found that attitude toward the ad influences brand attitudes and<br />
purchase intentions. Extending this to the Web context, attitude toward the site will be an equally<br />
useful indicator of site <strong>value</strong>.<br />
Following Jee and Lee (2002), we assume that Web sites look like and reflect the<br />
characteristics of traditional ads, and therefore, attitude toward the Web site should lead to<br />
consequences identical to those found in attitude research. The Flow construct mediates the<br />
effect of attitude toward the site on consumers’ intentions to revisit the site and to purchase this<br />
product, but it is not needed to predict consumer intentions (Luna et al., 2002). According to<br />
some authors, attitude toward the ad is an affective construct, which mediates the influence on<br />
brand attitudes and purchase intentions (Lutz, McKenzie and Belch, 1983; McKenzie et al.,<br />
1986; Mitchell and Olson, 1981; Shimp, 1981; Homer, 1990). In the same manner, attitude<br />
toward the Web site has a positive and strong impact on attitude toward the ad, attention to the<br />
commercial, brand attitudes and purchase intentions according to the advertising hierarchy of<br />
effects model of Bruner and Kumar (2000). From Bruner and Kumar (2000) and Stevenson<br />
(2000), attitude toward the web site plays an important role in the hierarchy-of-effects, a model<br />
in which attitude formation goes through a cognitive stage (exploratory behavior), an affective<br />
204
stage of liking (attitudes), and a behavioral stage of purchase intention in responding to<br />
advertising and other persuasive marketing messages (Dodds, 1991). Thus:<br />
H6: When consumers surf the Web, attitude toward the Web site is positively related to: a) involvement<br />
in purchase decisions for the product, and b) purchase intentions.<br />
3.2.2 Behavioral Search Variables<br />
3.2.2.1. Exploratory Behavior<br />
Exploratory behavior is defined as “behavior with the sole function of changing the stimulus field”<br />
(Berlyne, 1963). Theory and empirical studies suggest that a two-factor conceptualization of exploratory<br />
consumer behavior are most useful: exploratory acquisition of products and exploratory information<br />
seeking (Baumgartner and Steenkamp, 1996).<br />
Browsing, which is one of the components of exploratory behavior on the Internet, is performed when<br />
the surfers do not have a precise knowledge of the information that might be available and are not sure<br />
whether their requirements can be met or how these requirements may be reached. Browsing can be either<br />
general or purposeful. “Purposive” browsing occurs when the surfers have fairly specific requirements,<br />
whereas general browsing may be used as an opportunity for the surfers to fine-tune the perception of<br />
their requirements or to simply keep themselves up-to-date on the latest changes in a specific field or a<br />
product type (Rowley, 2000).<br />
Shoppers’ exploratory behavior, characterized by information-search or exploration through<br />
purchasing, positively influences their attitudes toward the Web site. The more they tend to explore the<br />
various possibilities offered by the Web, the more they will fine-tune their requirements and have a<br />
positive idea of the site they visit when surfing the Web, triggering approach behavior toward the Web<br />
site. Thus:<br />
H7: When consumers surf the Web, exploratory behavior is positively related to: a) attitude, b)<br />
involvement, c) involvement in purchase decisions for the product, and d) purchase intentions.<br />
205
3.2.2.2. Involvement<br />
The final component of the processing part of our model is involvement. Involvement is a very<br />
important variable in audience processing of both traditional advertising (Petty and Cacioppo, 1981,<br />
1983a, 1986) and Web advertising (Raman and Leckenby, 1998; Cho, 1999). Day, Stafford and Camacho<br />
(1995) refer to involvement as a motivational state influenced by a person’s perception of the object’s<br />
relevance based on inherent needs, <strong>value</strong>s and interests (Zaichkowsky, 1985). Its major antecedents are<br />
the characteristics of the person, the stimulus/object, and the situation (Bloch and Richins, 1983;<br />
Zaichkowsky, 1986).<br />
We suggest that involved surfers are more prone to search for more information when surfing the pharmaceutical Web sites and in doing<br />
that, explore more new stimuli and situations because of a higher need for environmental stimulation. Further, Balabanis and Reynolds<br />
(2001) confirm the influence of live brand attitudes on the attitude formation of online shoppers. Harvin (2000) also indicates that consumers<br />
are more comfortable with companies’ strong off-line brands that they already know and <strong>trust</strong>. Yoo and Stout (2001) posited that consumers<br />
with a high level of product involvement have more intentions to interact with a Web site, leading to more extensive search and more<br />
interactive functions tried. Finally, highly-involved people will search for more information before purchase, process relevant information in<br />
depth, and use more criteria in their purchase decisions than others (Leong, 1993; Laaksonen, 1994; Maheswaran and Meyers-Levy, 1990).<br />
Internet-involved customers will more likely purchase online than people with low levels of involvement (Kwak, Fox and Zinkhan, 2002).<br />
Therefore:<br />
H8: When consumers surf the Web, involvement is positively related to: a) attitude b) involvement in purchase decisions for the product, and c)<br />
purchase intentions.<br />
3.3.3. Outcomes<br />
3.3.3.1. Involvement in Purchase Decisions (or Pre-purchase Intentions)<br />
A consumer buying process is a sequence of several stages: 1-2/ information’s search and evaluation are two important preparatory steps.<br />
B2C sites which offer navigational tools that would ease the search process are likely to be more effective. 3/ evaluation of alternatives<br />
before making a decision. Decision aids have a favorable effect on the quality of online purchase decisions (Ranganathan and Ganapathy,<br />
2002).<br />
In general, customers often engage in ongoing information collection without specific needs or<br />
purchase decisions (Block et al. 1986). For them, <strong>value</strong>-added information can be interesting and helpful.<br />
Whether the URL to visit comes from word-by-mouth (e.g., reviews of books by other customers or stock<br />
recommendations by analysts), customers can enjoy this wealth of information about products and<br />
services not always available in the physical world (Koufaris, 2002). Access to such information can<br />
improve consumer decision and can be an important incentive for people to shop online (Jarvenpaa and<br />
Todd, 1997).<br />
In the traditional hierarchy-of-effects models, product purchase is the ultimate stage of the<br />
communication process and purchase usually takes place long after exposure to ad messages. Ad<br />
effects occur not in the short-term, but rather in the long-term, with a series of steps starting from<br />
unawareness of a particular brand to the actual buying of it. However, with Internet, that<br />
purchase can probably take place at the same time as their exposure to ad messages or within a<br />
206
short period of time because shoppers can place an order or request additional information<br />
instantly and directly via Internet rather than having to order through another method (Cho,<br />
1999).<br />
As involvement in purchase decision has been conceptualized as pre-purchase intentions, we can propose that in the hierarchy-of-effects<br />
model, this factor can considered as a step before purchase intention with a conative dimension:<br />
H9: When consumers surf the Web, involvement in purchase decisions is positively related to purchase intentions.<br />
The model we propose in this study is shown in figure 2. To facilitate its comprehension, we<br />
did not drawn either the non-significant paths or those whose p is less than 0.10.<br />
[insert figure 2 around here]<br />
4. Data and Methodology<br />
We test the structure of the proposed model in the context of a pharmaceutical Web site.<br />
Health care is one sector of the economy where the Internet has become an invaluable tool for<br />
communication. For wired consumers, healthcare ranks as the fourth most popular topic on the<br />
Web (Bellman, Lohse and Johnson, 1999), while among women and seniors, health sites are the<br />
second most popular destination (Cyber Dialogue, 1999). Obviously, the objectives of<br />
pharmaceutical companies are geared more towards influencing consumer attitude, rather than<br />
immediate online purchasing. As we mentioned in the introduction, the majority of the research<br />
to date is on online retailing, but the empirical context is justified by our objective of developing<br />
a comprehensive model of the effectiveness of the Web site through its content and its<br />
informational design (Internet atmospherics), which are represented by navigational<br />
characteristics, entertainment, informativeness, effectiveness and structure of the Web site.<br />
The data for the study were collected from the homepage of an OTC drug from one of the<br />
largest, well-known pharmaceutical companies in North America. (A recent study by Ipsos<br />
PharmTrends reported that this OTC drug was number two with a 23% U.S. market share,<br />
compared to the leader’s 32% share).<br />
Here, we propose a Web-based methodology that minimizes biases of existing ad testing<br />
methods. Our methodology is based on an experimental method that is totally clear and<br />
unobtrusive to each respondent. We measured their answers which reflect their flow and viewing<br />
behavior on a given Web site after they did their normal surfing activities on it. Hence,<br />
measurements are based on actual respondent behavior and do not suffer from any experimental<br />
effects or any self-report biases. The methodology is designed to test the effectiveness of<br />
207
environmental cues on purchase behavior on the Web and is implemented on the Web itself. The<br />
participants are Web surfers engaged in their own Web surfing activities but are part of a random<br />
sample of individuals who might or might not be involved with the product featured in the site.<br />
Thus, the method does not suffer from any biases due to lack of external validity as content is<br />
viewed in its actual form, by actual viewers, and within its actual viewing environment (within<br />
the Web site environment for which it is designed). The electronic data is collected from<br />
respondents instantaneously as they answer the questionnaire, in real time. Thus, the<br />
methodology potentially provides instantaneous measures of site environmental cues<br />
effectiveness.<br />
The questionnaire was a structured, non-disguised instrument, with closed-ended questions to indicate the respondents’ degree of<br />
agreement/disagreement on a five-point Likert scale, except for involvement which uses a five point-semantic differential scale. It contained<br />
variables measuring Navigational Characteristics, Entertainment, Informativeness, Effectiveness and Structure of the site that could influence<br />
the cognitive (i.e., exploratory behavior and involvement), affective (i.e., attitudes toward the site) variables, and outcomes for the OTC drug<br />
(i.e., involvement in purchase decision and purchase intentions). Finally, some demographic variables were measured.<br />
All these dimensions have been studied previously, providing a large pool of existing valid items to use in our survey. The most appropriate<br />
measures for each concept were selected from the literature and adapted to meet the needs of our study. The scale for “Navigational<br />
characteristics of the Web site” (CHPS), developed by Bell and Tang (1998), was operationalized with eleven items and adapted to our study.<br />
“Entertainment” (ENT) and “Informativeness” (INFO) of the Web site came from Chen and Wells (1999) and contained respectively two,<br />
four and three items. “Structure” (STR) of the Web site and “Effectiveness of the information content” (EFFI) of the Web site were created<br />
from the variables analyzed by Bell and Tang (1998). “Attitude toward the Web site” (ATTI) is described on one hand by the Chen and Wells<br />
(1999) scale and on another hand, by the Eighmey and McCord (1995) scale as this variable is also considered as a measure of<br />
approach/avoidance behavior. The “Exploratory Behavior” (EXPB) scale, developed by Novak et al (1997, 2000) was operationalized with<br />
eight items. The “Involvement” (INV) scale, represented by perceived message relevance and developed by Muehling, Stoltman, and<br />
Grossbart (1990) and Zaichkowsky (1990) was operationalized with eight items. The scale developed by Gore et al. (1994) about<br />
involvement in purchase decisions for nonprescription drugs was conceptualized as “Pre-purchase Intentions” (PPURI) and was<br />
operationalized with seven items. Finally, the last variable, named purchase intentions (PURI), consisted of one indicator.<br />
5. Results<br />
5.1 Exploratory Factor Analysis<br />
Prior to testing the full latent model, we begin with an Exploratory Factor Analysis (EFA) in order to determine how the observed variables<br />
are linked to their underlying factors. Knowing that some constructs could have items loading on more than one factor, we used a data<br />
reduction technique to identify the minimal number of factors underlying the observed variables (items) and explaining most of the variance<br />
observed. Maximum Likelihood Extraction removes highly correlated variables from the data and varimax rotation ascertains that constructs<br />
are distinct.<br />
Initially, the number of factors for each construct was equal to 1 except for CHPS, EFF, ATTI and EXPB. All Cronbach alpha coefficients<br />
were acceptable (higher than 0.60). A preliminary analysis of the psychometric properties of the items composing the different scales<br />
resulted in deleting certain items presenting poor psychometric properties or changes in Cronbach alpha coefficients. After deleting these<br />
items, each construct proved to be unidimensional and factorially distinct, all items used to operationalize a specific construct loaded on a<br />
single factor. The percentage of variance varied between 53.9% for PPURI to 86.5% for INFO. The EFA highlighted the existence of 9<br />
factors with eigen<strong>value</strong>s greater than 1.0. The criterion used to identify and interpret factors was that each item should have a factor loading<br />
208
greater than 0.4. According to Nunnally (1967), acceptable Cronbach’s α coefficients start at 0.60. In our study, all Cronbach’s coefficients<br />
except one were greater than 0.70, which indicates very high reliability. The exceptions are the EFF scale with a coefficient α of 0.63.<br />
Table 1 lists the scale items for each factor, factor loadings, Cronbach’s α and percentage of variance for each factor.<br />
5.2 Confirmatory Factor Analysis<br />
[Insert table 1 around here]<br />
Following Byrne (1994), confirmatory factor analysis (CFA) was used to confirm the<br />
measurement model before conducting the test of the structural model. The Lagrange Multiplier<br />
test identified a small number of covariances which were taken into account. The nine-factor<br />
structure obtained in the EFA was confirmed with a first-order CFA. Estimation of the CFA<br />
model generated a χ 2 based on 631 degrees of freedom, Satorra-Bentler scaled χ 2 , comparative fit<br />
indices (CFI) and standardized root mean-square error of approximation (RMSEA) <strong>value</strong>s of,<br />
respectively, 1087.5, (χ 2 /df=1.72), 894.3, (χ 2 /df=1.42), 0.90 and 0.05. According to Hu and<br />
Bentler’s (1999) cutoff criteria, the model demonstrated a good fit, taking into account the very<br />
large number of items and factors analyzed (Baumgartner and Homburg, 1996).<br />
5.3 Full Structural Model<br />
The results of the full structural model, along with corresponding fit indices and standardized<br />
parameter estimates are depicted in table 2. Overall, the findings show strong support for the<br />
model fit with CFI <strong>value</strong> of 0.92 and RMSEA statistics of 0.048. The average off-diagonal<br />
<strong>value</strong>s of the standardized residual matrix was 0.084. As per Hu and Bentler’s (1999) cutoff<br />
criteria, the fit of this full model is judged acceptable.<br />
[Insert table 2 around here]<br />
Following Byrne (1994), we then test the significance of individual parameters to assess their<br />
fit. The results of the factor loadings, and the test statistics indicate that all the factor loadings are<br />
significant. Finally, we analyzed the path coefficients representing the hypothesized<br />
relationships between the various constructs. Table 3 and figure 2 provide the regression<br />
coefficient estimates and their statistical significance. It also shows the standardized <strong>value</strong>s of<br />
the regression coefficients and relates the paths to our original hypotheses. Twelve subsections<br />
of hypotheses have non-significant paths. All the others are significant with t tests varying from<br />
1.80 to 6.11. Concerning the standardized estimates, low <strong>value</strong>s mean that the correlation<br />
coefficient between two theoretical constructs is not significantly different from zero, making<br />
some paths non-significant.<br />
209
6. Test of Hypotheses<br />
[Insert table 3 around here]<br />
We now briefly discuss the support for individual hypotheses. The results show a strong support for<br />
the set of hypotheses 1, which are related to the navigational characteristics of the Web site. Specifically,<br />
there is a positive and very significant relationship of navigational characteristics with surfers’<br />
involvement, exploratory behavior, involvement in purchase decisions, whereas it has a weakly positive<br />
link with attitude toward the Web site. However, hypothesis 1e, related to surfers’ purchase intentions, is<br />
not supported.<br />
Similarly we find a partial and weak support for the set of hypotheses 2. Hypotheses 2a and 2c do not<br />
show any link between structure of the Web site and surfers’ attitude and exploratory behavior towards it.<br />
However, the other hypotheses (H2b and 2d) show positive and very significant paths between structure<br />
of the Web site and shoppers’ involvement and pre-purchase intentions.<br />
The set of hypotheses 3 on the impact of atmospherics clues (information content effectiveness) on<br />
behavioral variables is mostly supported. H3a representing the effect of EFF on attitude is not supported.<br />
However, hypotheses 3b, 3c and 3e showed a significant effect of the EFF on INV, EXPB and PURI,<br />
while EFF (H3d) is significantly and positively related to surfers’ involvement in purchase decision when<br />
a one sided-test is used (t = 1.40, p < 0.1).<br />
We find that hypotheses 4a and 4b are supported with a positive and significant link between<br />
entertainment with the Web site and surfers’ attitudes (one-sided test: t = 1.89, p < 0.05) and involvement.<br />
Concerning informativeness of the Web site, hypothesis 5a showed significant but negative link of<br />
informativeness with shoppers’ attitude, whereas for H5b, informativeness has a positive and significant<br />
influence on exploratory behavior.<br />
For H6a, there is a positive and very significant path between surfers’ attitude and involvement in<br />
purchase decisions. For H6b, there is also a positive and significant path between attitude and purchase<br />
intentions when a one sided-test is used (t = 1.88, p < 0.05). This finding is consistent with expectations<br />
from prior research.<br />
The set of hypotheses 7 is partly supported. On one hand, there is no relationship between surfers’<br />
exploratory behavior and attitude, involvement and involvement in purchase decisions (7a, 7b and 7c). On<br />
the other hand, there is a negative and very significant link between exploratory behavior and purchase<br />
behavior (7d). This finding is interesting in the context of the hierarchy of the effects model.<br />
A curious result is found for the set of hypotheses 8 related to consumers’ involvement. Contrary to<br />
previous research, we found no relationship between involvement and involvement in purchase decisions<br />
(H8b), and involvement and purchase intentions (H8c), and a barely insignificant relationship between<br />
involvement and attitude (H8a) (the standardized estimate is high, but so is the standard error).<br />
210
Finally, for the last hypothesis, H9, we found that surfers’ involvement in purchase decisions is<br />
strongly and positively related to their purchase decisions.<br />
Overall, the results are very encouraging, with full or partial support for all except one set of<br />
hypotheses. This study was exploratory as no specific information was published before on most<br />
of the paths studied in this paper. However, close to 65% of the individual relationships<br />
proposed in our model were supported, and the overall model itself was found to fit the observed<br />
data well.<br />
7. Interpretation and Discussion of Results<br />
8.<br />
We will now discuss some of the major findings presented in the previous section, and follow it with<br />
the theoretical and managerial implications of the study.<br />
One of the more interesting and useful findings relates to the support for the impact of<br />
navigational characteristics effectiveness. These cues had impact on attitude toward the Web<br />
site. We find that navigational characteristics are positively related to surfers’ involvement in<br />
purchase decision. We could perhaps infer that when navigational characteristics are positive,<br />
surfers can develop some arousal early in their online browsing (arousal was not measured in the<br />
study), which can make shoppers more involved in the Web site and more keen to search for<br />
information (exploratory behavior), affecting positively their involvement in purchase decisions,<br />
without implicating a concrete purchase of the OTC drug, whatever the channels used<br />
(significant hypothesis with a one-sided test: t = 1.61; p < 0.1).<br />
Even though the literature seems to link STR (H2a) and EFF (H3a) to attitude, we did not find such<br />
results. First, as attitude correlates with involvement pretty well, and as the same inducers of the<br />
relationship with involvement were statistically significant, we can infer that the effects of involvement<br />
are already included in the attitude variable. Informativeness showed a relatively significant but negative<br />
relationship with attitude. In fact, even though it seems there is updated and not repetitive information<br />
(EFF is positively linked attitude), surfers did not consider the information given by the Web site as<br />
useful and/or resourceful, because this site seems to them ugly, inducing the development of negative<br />
affect (avoidance attitude) as they did not like it.<br />
Central cues such as structure of the Web site (H2b) and effectiveness of its information content<br />
(H3b) are significantly related to involvement. In fact, the more the STR and EFF are adequate and<br />
pleasing to the visitors, the more the surfers are engaged in the process of in depth information search.<br />
Surfers exerted cognitive efforts and used the central route, according to the ELM. Factors such as the<br />
expertise, credibility, likeability or attractiveness of the source are considered as peripheral cues (Petty,<br />
211
Cacioppo, Schumann, 1983; Petty and Cacioppo, 1986). Consequently, we can infer that entertainment<br />
(H4b) is also linked to involvement. In this case, consumers who did not want to give too much attention<br />
to the content itself, are attracted by visuals and/or attractive sources, giving them the opportunity to<br />
pursue the visit of the Web site because of the entertainment the site has developed. Visitors are affected<br />
by the visuals and/or attractive sources, elaborating affective reaction and following the peripheral route.<br />
Our results support prior research that attitudes toward the Web site have a very strong and positive<br />
effect on the surfers’ pre-purchase intentions, even though the items concern more specifically the drug<br />
(or brand of that company).This result is confirmed by previous studies (Shim et al., 2001). However, we<br />
did not find a very strong relationship between attitude toward the site and purchase intentions, whereas<br />
research on that subject found the opposite (Stevenson et al, 2000; Notani, 1997).<br />
Without any other study to support or not our findings, we did not find any significant links between<br />
consumers’ exploratory behavior and attitude, involvement, and involvement in purchase decisions.<br />
However, we found a significant but negative path between exploratory behavior and purchase decision.<br />
The more surfers scroll and browse, the more they are fond of information about the topic they are<br />
interested in, producing a delay in their purchase intentions.<br />
One of the interesting results relates to the support for the impact of involvement. We found, perhaps<br />
surprisingly that involvement has no impact on pre-purchase intentions and purchase behavior. But of<br />
more interest is the finding that involvement is weakly related to approach attitudes. Normally, highly-<br />
involved consumers are more attracted by Web site aspects related to the product (information content<br />
(EFF)), whereas low-involved ones focus more on the peripheral stimuli of the site (ENT) or the site’s<br />
design characteristics (STR). We can thus infer that highly-involved surfers can develop positive attitudes<br />
toward the site leading to behaviors such as repeat visits to collect up-to-date information. Obviously, this<br />
finding carries significant theoretical and managerial implications. Shopper’s involvement has normally a<br />
positive impact on involvement in purchase decisions. The more involved people are, the more they will<br />
search for information before purchase, process relevant information in depth and use more criteria in<br />
their purchase decisions than others. Moreover, Internet-involved consumers will more likely purchase<br />
online than those with low-levels of involvement. According to our results, this relationship is not<br />
significant. It is probably due to the fact that involvement and attitude are highly correlated, with the<br />
effects of involvement being already included in attitude.<br />
Central cues such as EFF (H3c) and INFO (H5b) impact consumers’ exploratory behavior, whereas<br />
STR (H2c) does not. EFF and INFO are factors related to the information of the Web site. When the<br />
manner the information is presented suited visitors and when the site is useful or resourceful to them<br />
(meaning that surfers find what they want), they live the flow and scroll and browse in order to gather the<br />
most information possible. According to ELM, these two variables make surfers follow the central route,<br />
exerting some cognitive efforts. Even though STR is also a central cue, the simple or complex level of<br />
212
structure does not influence the level of browsing or scrolling of consumers, contrary to our hypothesis.<br />
They do not seem to exert additional cognitive effort to collect information because the structure is more<br />
complex.<br />
Shoppers’ pre-purchase intention is highly and significantly linked to their purchase intentions (H9).<br />
In fact, it is reasonable for a consumer to be involved in the search for information, before buying a<br />
product such as an OTC drug. Moreover, according to the hierarchy-of-effects, PPURI can be considered<br />
as an antecedent of PURI. STR (H2d) and EFF (H3e), two central cues, has a direct impact on PURI. The<br />
more the structure and information content are complex, the more consumers are engaged in seeking<br />
information, the more cognitive efforts they develop. EFF also has an indirect path via PPURI toward<br />
PURI, which is consistent with the hierarchy-of-effects model. ENT, the peripheral cue of the model, has<br />
an indirect impact on PURI through attitude (affective factor) and PPURI, and through INV (cognitive<br />
variable) and PPURI. However, INFO impacts directly PURI through either attitude and EXPB. Finally,<br />
contrary to our hypothesis, EFF did not influence PPURI (H3d). This means that when the information<br />
content is effective, surfers do not have to engage in further information search before developing or not a<br />
purchase intent.<br />
8. Theoretical and Managerial Implications<br />
The main goal of this study was to examine the impact of atmospherics cues concerning<br />
Internet advertising on the behavior of consumers and its impact on purchase intentions. We<br />
defined under the concept of general behavior toward the Web site, several different dimensions.<br />
First, there is an affective variable represented by attitude toward the site. Second, there are<br />
behavioral/cognitive variables (because they are related to information search and acquisition)<br />
such as exploratory behavior and involvement. Finally, there are the outcomes variables, pre-<br />
purchase intentions and purchase intentions. This research also helps provide a better<br />
understanding of Internet consumers’ behavior and findings from the study of this model will be<br />
of interest to behavioral scientists both in retailing and psychology.<br />
The theoretical implications of this research take several forms. First, our study empirically confirmed<br />
several relationships discussed in the prior literature. We found that efficient navigational characteristics<br />
can help develop not only consumers’ involvement and their exploratory behavior (Menon and Kahn,<br />
2002), but also their attitude toward the site (Baronas and Louis, 1988; Regan and Fazio, 1977; Eagly and<br />
Chaiken, 1993; Csikszentmihalyi, 1977). The impact of EFF on INV was also found by Yoon (2000).<br />
According to Okasaki and Rivas 2002, EFF might influence purchase decision (here, purchase intention).<br />
Consistent with Chen et al. (1999, 2002), ENT and INFO are two other but independent dimensions of<br />
ATTI with which they correlate well. In our case, ENT and INFO are significantly related to ATTI (De<br />
213
Pelsmacker et al, 1998). ATTI is linked to PURI as Brown and Stayman (1992) and De Pelsmacker, et al,<br />
(1998) found. We confirmed the positive relationship between ENT and INV found by Park and Young<br />
(1983, 1986).<br />
More importantly, our model tested other relationships that had not been studied previously in the<br />
literature: the impact of CHPS and EFF, two central cues, on PPURI; STR, EFF and INFO on EXPB,<br />
STR and PPURI on PURI; EXPB on INV and on PPURI, EXPB on INV, and finally, ATTI on PPURI. In<br />
summary, ENT--> INV and ATTI; STR--> INV; INFO--> ATTI and EXPB; EFF--> INV and EXPB;<br />
CHPS--> INV, ATTI and EXPB.<br />
We adapted the ELM to our study. In that case, as a consumer’s motivation (represented by EXPB)<br />
using central route to process a site increases, the impact of central processing on attitudes toward the site<br />
should increase, the impact of peripheral processing should decrease, and the impact of attitudes toward<br />
the site on purchase intention should increase (Petty and Cacioppo, 1986). Thus, EXPB has its<br />
moderating effects by changing the central route (increase) that takes place and by changing peripheral<br />
perceptions (decrease). Consequently, STR and EFF follow the central route via INV (cognitive aspect);<br />
ENT and CHPS impacts on either INV (cognitive, central route) or ATTI (affective, peripheral route) and<br />
INFO impacts totally on ATTI (affective variable). Here, EXPB should moderate the relationship<br />
between EFF and INV, but not between INFO and ATTI. CHPS is linked with both peripheral (ATTI)<br />
and central (INV) cues, in the presence of EXPB. Here, we believe that the central route (using INV)<br />
might be preferentially used, compared to the peripheral route (using ATTI). Thus, we can mention that<br />
INFO, EFF, STR and CHPS (central cues) will take the central route, whereas ENT will follow both<br />
routes with a predilection for the affective route.<br />
Further, our study fails to find support for some relationships examined in previous studies,<br />
emphasizing the need for further research in this area. For instance, while CHPS was found to positively<br />
influences PURI (Lynch, Kent and Srinivasan, 2001), our study showed no significant direct path<br />
between both variables. Before developing a purchase intention, surfers have to navigate through the site<br />
or find more information via other channels. Whereas STR and ATTI and EFF and ATTI are not<br />
significant linked in our research, De Pelsmacker et al (1998) reported significant links. Our problem<br />
probably resides in the high correlation between ATTI and INV. Contrary to Kwak (2002), there is no<br />
significant direct link between INV and PURI. In the same way, INV and PPURI (Leong, 1993) and INV<br />
and ATTI (Yoo and Stout, 2001) do not display any significant relationship in our research because of the<br />
correlation of INV and ATTI.<br />
Finally, we note that some of our results contradicted previous findings, highlighting the need for<br />
more empirical research to increase our knowledge in this area. For instance, EXPB did not positively<br />
influence PURI, but instead negatively, and the positive relationship between STR and INV is reversed.<br />
With high involvement, but no ability to process information, peripheral cues of ad messages are used in<br />
214
order to develop involvement toward the brand or product. However, with high involvement and ability to<br />
process information, central cues are used.<br />
Finally, Bruner and Kumar (2000) found that attitudes toward the Web site impact purchase<br />
intentions. On the other hand, Kwak et al. (2002) found that attitudes toward online advertisements<br />
generally did not impact the overall Internet purchase process. We found the same results as Kwak et al.<br />
(2002), but with the effect of attitudes toward the site on pre-purchase intentions and purchase intentions<br />
for the product.<br />
This study provides marketing practitioners with insights into some of the individual and<br />
behavioral variables that influence consumers’ purchase intentions for an OTC drug when they<br />
use the Internet channel to seek and collect information about it.<br />
The findings generally indicate what types of navigational cues (CHPS), which kinds of design and<br />
effective information content (INFO, EFF and STR) are more likely to involve surfers in seeking product-<br />
related information from the Internet.<br />
Given the early positioning of information search in the buying decision process, if marketers can<br />
identify which consumer segments in their market niche rely more heavily on navigational characteristics,<br />
information content and structure of the Web site (central cues) or on entertainment (peripheral cue), how<br />
to decrease the difficulty of navigating on their site, and how to build a site with a structure and<br />
information convenient and in the same time appealing to their needs, they can tailor their communication<br />
strategies to better suit these segments.<br />
The study is not without limitations. Empirical surveys gathered on the Internet may have questions<br />
about external validity, more so since our sample of respondents was gathered from one single Web site<br />
and was composed of students with computer and Internet experience. The addition of emotions (pleasure<br />
and arousal) might have explained some paths considered in our study as non significant or through<br />
indirect paths.<br />
Some other areas for future research can be suggested here. It will have been interesting to also<br />
measure and add to our model attitude toward the brand in order to have a direct link with PPURI and<br />
PURI related to the brand. Knowing how consumers consider an OTC drug (search or experience<br />
product) will help us in testing the ELM in a web context. Other additional variables might be <strong>trust</strong> and<br />
experience as they influence consumers’ attitude and purchase intention at a specific Web site. Metrics for<br />
evaluating our environmental cues such as stickiness (average time per visit, frequency and recency)<br />
(Bhat et al., 2002) might also be studied in order to confirm our model.<br />
Researchers could use cross-cultural research to find out if people from different populations<br />
and cultures differ in their behavior vis-à-vis our model. Longitudinal studies could be done to<br />
trace the evolution and adaptation of consumer behavior when technological developments and<br />
215
improvements are brought into navigational characteristics, adding visual and audio capabilities<br />
such as voice intensity, intonation and speech rate (Gélinas-Chebat et Chebat, 1992; Gélinas-<br />
Chebat, Chebat and Boivin, 1996) and improving the quality of the information found on the<br />
Web.<br />
References<br />
Aaker, DA and Bruzzone, DE. Viewer Perceptions of Prime-Time Television Advertising. Journal of Advertising<br />
Research 21(5) (1985): 15-23.<br />
Aaker, D.S. and Norris, D.: Characteristics of TV Commercials Perceived as Informative. Journal of Advertising<br />
Research 22 (2) (1982): 61-70.<br />
Aaker, D.A. and Stayman, DM. Measuring Audience Perceptions of Commercials and Relating them to Ad Impact.<br />
Journal of Advertising Research 30(4) (1990): 7-17.<br />
Abels, E.G., White, M.D., and Hahn, K. Identifying User-Based Criteria for Web Pages. Internet Research 7 (4)<br />
(1997): 252-62.<br />
Aladwani, A.M. and Palvia, P.C. Developing and Validating an Instrument for Measuring User-Perceived Web<br />
<strong>Quality</strong>. Information & Management 39 (2002): 467-76.<br />
Anderson, PM. Personality, Perception and Emotional-state Factors in Approach-Avoidance Behaviors in the Store<br />
Environment. AMA Educators’ Proceedings, 35-39, 1986.<br />
Baker, J. The Role of Environment in Marketing Services: The Consumer Perspective, in The Services marketing<br />
Challenges Integrated for Competitive Advantage, J.A. Czpeil and C. Congram and J. Shanaham (Eds.). Chicago,<br />
IL: AMA, 1986.<br />
Baker, J., D. Grewal, and Parasuraman, S. The Influence of Store Environment on <strong>Quality</strong> Inferences and Store<br />
Image. Journal of Academy Marketing Science, 22 (Autumn) (1994): 328-39.<br />
Baker, WE. and Lutz, RJ. The Relevance-Accessibility Model of Advertising Effectiveness. In: S. Hecker and DW<br />
Stewart, eds. Nonverbal Communication in Advertising. Lexington, MA : Lexington Books, 1988.<br />
Balabanis, G. and Reynolds, N.L.: Consumer Attitudes towards Multi-Channels Retailers' Web Sites: The Role of<br />
Involvement, Brand Attitude, Internet Knowledge and Visit Duration. Journal of Business Strategies 18(2) (2001):<br />
105-132.<br />
Baronas, A.K. and Louis, M.R.: Restoring a Sense of Control during Implementation. MIS Quarterly 12 (1988):<br />
111-123.<br />
Batra, R. and Ray, M.L.: Affective Responses Mediating Acceptance of Advertising. Journal of Consumer<br />
Research 13(2) (1986): 234-249.<br />
Bauer, R.A. and Greyser, S.A. Advertising in America Consumer View. Boston, MA: Harvard University, 1968.<br />
Baumgartner, H. and Homburg, C.: Applications of Structural Equation Modeling in Marketing and Consumer<br />
Research: A Review. International Journal of Research in Marketing 13 (1996): 139-161.<br />
Baumgartner, H. and Steenkamp, J.B.E.M.: Exploratory Consumer Behavior: Conceptualization and Measurement.<br />
International Journal of Research in Marketing 13(2) (1996): 121-137.<br />
216
Becker, L.B., Martino, R.A., and Towners, W.M.: Media Advertising credibility. Journalism Quarterly, 53 (1976) :<br />
216-22.<br />
Bell, H. and Tang, N.K.H.: The Effectiveness of Commercial Internet Web Sites: A User’s Perspective. Internet<br />
Research 8(3) (1998): 219-228.<br />
Bellman, S., Lohse, G.L., and Johnson, E.J.: Predictors of Online Buying Behavior. Communications of the ACM<br />
42(12) (1999): 32-38.<br />
Berlyne, D.E.: Motivational Problems Raised by Exploratory and Epistemic Behavior, in Psychology: A Study of<br />
Science 5, S. Koch (ed.), New York: McGraw-Hill, 284-364, 1963.<br />
Bhat, S, Bevans, M., and Sengupta, S. Measuring Users' Web Activity to Evaluate and Enhance Advertising<br />
Effectiveness. Journal of Advertising, 31 (3) (2002): 97-106.<br />
Bloch, P.H. and Richins, M.L.: A Theoretical Model for the Study of Product Importance Perceptions. Journal of<br />
Marketing 47 (Summer) (1983): 69-81.<br />
Brännback, M. Is the Internet Changing the Dominant Logic of Marketing? European Management Journal 15 (6)<br />
(1997): 698-707.<br />
Brown, S.P. and Stayman, D.M.: Antecedents and Consequences of Attitudes toward the Ad: A Meta Analysis.<br />
Journal of Consumer Research, 19 (June) (1992): 34-51.<br />
Bruner II, G.C. and Kumar, A.: Web Commercials and Advertising Hierarchy-of-Effects, Journal of Advertising<br />
Research 40(1/2) (2000): 35-42.<br />
Byrne, B.M.: Structural Equation Modeling with EQS and EQS/Windows: Basic Concepts, Applications, and<br />
Programming, eds. Sage Publications, 1994.<br />
Cacioppo, J.T. and Petty, R.E.: The Need for Cognition. Journal of Personality and Social Psychology 42 (1982):<br />
116-131.<br />
Cacioppo, J.T. and Petty, R.E. Effects of Message Repetition on Argument Processing, Recall, and Persuasion.<br />
Basic and Applied Social Psychology 10 (1989): 3-12.<br />
Cacioppo, J.T., Petty, R.E., and Kao, C.F. Central and Peripheral Routes to Persuasion: An Individual Difference<br />
Perspective. Journal of Personality and Social Psychology 51 (1986): 1032-1043.<br />
Chebat, J.C, Gelinas-Chebat, C., and Vaillant, D.: Environmental Background Music and in-Store Selling, Journal<br />
of Business Research 54(2) (2001): 115-123.<br />
Chen, Q., Clifford, S.J. and Wells, W.D.: Attitude toward the Site II: New Information, Journal of Advertising<br />
Research 42(2) (2002): 33-45.<br />
Chen, Q. and Wells, W.D.: Attitude toward the Site. Journal of Advertising Research 39(5) (1999): 27-37.<br />
217
Cho, C.H.: How Advertising Works on the World Wide Web: Modified Elaboration Likelihood Model. Journal of<br />
Current Issues and Research in Advertising 21(1) (1999): 33-49.<br />
Cox, D.F. The Measurement of Information Value, in Emerging Concepts in Marketing. New York: American<br />
Marketing Association, 1962.<br />
Csikszentmihalyi, M. Beyond Boredom and Anxiety. M. Csikszentmihalyi, Ed (second ed.). San Francisco,<br />
Washington, London: Jossey-Bass, 1977.<br />
Dailey, L. (forthcoming), Navigational Web Atmospherics Explaining the Influence of Restrictive Navigation Cues.<br />
Journal of Business Research.<br />
Darden, W.R., Erdem, O., and Darden, D.K.: A Comparison and Test of Three Causal Models of Patronage<br />
Intentions. In: William, RD, Robert, FL, eds. Patronage Behavior and Retail Management. New York (NY): North<br />
Holland, 1983, 29-43.<br />
Day, E., Stafford, M.R. and Camacho, A.: Research note: Opportunities for involvement research--A scaledevelopment<br />
approach. Journal of Advertising 24(3) (1995): 69-75.<br />
De Pelsmacker, P, B Dedock, and M Geuens. A Study of 100 Likeable TV Commercials: Advertising<br />
Characteristics and the Attitude towards the Ad. Marketing and Research Today 27 (4) (1998): 166-179.<br />
Dholakia, U.M. and Rego, L.L. What Makes Commercial Web Pages Popular ? European Journal of Marketing 32<br />
(7/8) (1998): 724-36.<br />
Dodds, WB. In Search of Value: How Price and Store Name Information Influence Buyers’ Product Perception. The<br />
Journal of Services Marketing. 5 (3) (1991): 27-36.<br />
Donovan, R.J. and Rossiter, J.R. Store Atmosphere: An Environmental Psychology Approach. Journal of Retailing<br />
58(1) (1982): 34-57.<br />
Donovan R.J., Rossiter, J.R., Marcoolyn, G. and Nesdale, A. Store Atmosphere and Purchase Behavior. Journal of<br />
Retailing 70 (1994): 283-294.<br />
Dowling, G. Perceived Risk: The Concept and its Measurement. Psychology & Marketing 3 (1986): 193-210.<br />
Ducoffe, R.H.: Advertising Value and Advertising on the Web. Journal of Advertising Research 36(5) (1996):<br />
21-35.<br />
Eagly, A.H. and Chaiken, S.: The Psychology of Attitudes. Fort Worth (TX): Harcourt Brace Jovanovich, 1993.<br />
Eighmey, J.: Profiling User Responses to Commercial Web Sites. Journal of Advertising Research 37(3) (1997):<br />
59-66.<br />
Eighmey, J. and McCord, L.: Adding Value in the Information Age: Used and Gratifications of the World Wide<br />
Web, in Proceedings of the Conference on Telecommunications and Information Markets, R.R. Dholakia and D.R.<br />
Fortin, eds., Newport: University of Rhode Island, 1995.<br />
Eroglu, S.A., Machleit, K.A. and Davis, L.M.: Atmospherics Qualities of Online Retailing: A Conceptual Model<br />
and Implications. Journal of Business Research 50 (2001): 177-184.<br />
Gélinas-Chebat, C., Chebat, JC, and Boivin, R. Impact of Male and Female Voice Cues on Consumers' Attitudes in<br />
Telemarketing.<br />
Gelinas-Chebat, C. and Chebat, J.C. Effects of two Voice Characteristics on the Attitudes toward Advertising<br />
Messages. The Journal of Social Psychology 132(4) (1992): 447-459.<br />
218
Gore, P., Madhavan, S., McClung, G., and Riley, D.: Consumer Involvement in Non Prescription Medicine<br />
Purchase Decisions. Journal of Health Care Marketing 14(2) (1994): 16-20.<br />
Grossbart, S.L., Mittelstaedt, R.A., Curtis, W.N. and Rogers, R.D.: Environmental Sensitivity and Shopping<br />
Behavior. Journal of Business Research 3(October) (1975): 281-294.<br />
Harvin, R.: In Internet Branding, The Off-Lines Have It. Brandweek, 41(4) (Jan. 24, 2000): 30-31.<br />
Hoffman, D.L. and Novak, T.P.: Marketing in Hypermedia Computer-Mediated Environments: Conceptual<br />
Foundations. Journal of Marketing 60 (3) (1996): 50-68.<br />
Homer, P.M.: The Mediating Role of Attitude Toward the Ad: Some Additional Evidence, Journal of Marketing<br />
Research 27 (February 1990): 78-86.<br />
Hu, L. and Bentler, P.M.: Cutoff Criteria for Fit Indexes in Covariance Structure Analysis: Conventional Criteria<br />
Versus New Alternatives. Structural Equation Modeling 6(1)(1999): 1-55.<br />
Huizingh, E.K. The Content and Design of Web Sites: An Empirical Study. Information & Management 37 (3)<br />
(2000): 123-34.<br />
Jarvenpaa, S. and Todd, P. Consumer Reactions to Electronic Shopping on the World Wide Web). International<br />
Journal of Electronic Commerce 1(2) (1997): 59-88.<br />
Jee, J. and Lee, W.N.: Antecedents and Consequences of Perceived Interactivity: An Exploratory Study. Journal of<br />
Interactive Advertising 3(1): 1-16 (2002). (jiad.org/vol3/no1/jee).<br />
Johnson, K.L. and Misic, M.M.: Benchmarking: A Tool for Web site Evaluation and Improvement. Internet<br />
Research 9(5) (1999): 383-392.<br />
King, A.B. What Makes a Great Web Site ? (1996).<br />
Webreference.com, Webreference.com/greatsite.html.<br />
King, W.R., Whitehall, K., Reid, L.N., Tinkham, S.F. and Pokrywczynski, J. The Perceived Informativeness of<br />
National and Retail Advertising. Current Issues and Research in Advertising 10 (1) (1987): 173-198.<br />
Korgaonkar, P.K. and Wolin, L.D.: A Multivariate Analysis of Web Usage. Journal of Advertising Research<br />
(1999): 53-68.<br />
Kotler, P.: Atmosphere as a Marketing Tool. Journal of Retailing 49(winter) (1973): 48-64.<br />
Koufaris, M. Applying the Technology Acceptance Model and Flow Theory to Online Consumer Behavior.<br />
Information Systems Research 13(2) (2002): 205-224.<br />
Kwak, H., Fox, R.J. and Zinkhan, G.M.: What Products Can Be Successfully Promoted and Sold via the Internet?<br />
Journal of Advertising Research 42(1) (2002): 23-38.<br />
Laaksonen, P.: Consumer Involvement: Concepts and Research. London: Routledge, 1984.<br />
Larkin, E.F. Consumer Perceptions of the Media and their Advertising Content. Journal of Advertising 8 (2) (1979):<br />
5-7.<br />
Leavitt, C. A Multidimensional Set of Rating Scales for Television Commercials. Journal of Applied Psychology<br />
54(5) (1970): 427-429.<br />
Leong, S.M.: Consumer Decision Making for Common, Repeat-Purchase Products: A Dual Replication. Journal of<br />
Consumer Psychology 2(2) (1993): 193-208.<br />
219
Liu, C. and Arnett, K.P. Exploring the Factors Associated with Web Site Success in the Context of Electronic<br />
Commerce. Information & Management 38 (1) (2000): 23-33.<br />
Luna, D., Peracchio, L.A. and de Juan, M.: Cross-Cultural and Cognitive Aspects of Web Site Navigation, Journal<br />
of the Academy of Marketing Science 30(4) 2002: 397-410.<br />
Lutz, R.J., MacKenzie, S.B. and Belch, G.E.: Attitude toward the Ad as a Mediator of Advertising Effectiveness:<br />
Determinants and Consequences, in Advances in Consumer Research 10, Bagozzi R.P. and Tybout A.M. eds., Ann<br />
Arbor, MI: Association for Consumer Research, 1983: 532-539.<br />
Lynch, P.D., Kent, R.J. and Srinivasan, S.S.: The Global Internet Shopper: Evidence from Shopping Tasks in<br />
Twelve Countries. Journal of Advertising Research 41(3) (2001): 15-23.<br />
MacInnis, D.J. and Jaworski, B.J.: Information Processing from Advertisements: Toward an Integrative Framework.<br />
Journal of Marketing, 53 (October 1989): 1-23.<br />
MacKenzie, S.B. Lutz, R.J. and Belch, G.F.: The Role of Attitude toward the Ad as a Mediator of Advertising<br />
Effectiveness: A Test of Competing Explanations, Journal of Marketing Research 23(2) (1986): 130-143.<br />
Maheswaran, D. and Meyers-Levy, J.: The Influence of Message Framing and Involvement. Journal of Marketing<br />
Research 27 (August 1990): 361-367.<br />
McGaughey, R.E. and Mason, K.H.: The Internet as a Marketing Tool. Journal of Marketing Theory and Practice<br />
6(3) (1998): 1-11.<br />
McQuail, D. Mass Communication Theory: An Introduction. London: Sage, 1983.<br />
Mechitov, A.I., Moshkovich, H.M., Underwood, S.H. and Taylor, R.G. Comparative Analysis of Academic Web<br />
Sites. Education 121 (4) (2001): 652-62.<br />
Mehrabian, A. and Russell, J.A.: The Basic Emotional Impact of Environments. Perceptual and Motor Skills 38<br />
(1974): 283-301.<br />
Menon, S. and Kahn; B.: Cross-Category Effects of Induced Arousal and Pleasure on the Internet Shopping<br />
Experience. Journal of Retailing 78(1) (2002): 31-40.<br />
Miller, T.E. and Reents, S. The Health-Care Industry in Transition: The Online Mandate to Change, in American<br />
Internet User Survey: Cyber Dialog.<br />
Milliman, R.E. and Fugate, D.L. Atmospherics as an Emerging Influence in the Design of Exchange Environments.<br />
Journal of Marketing Management 3 (Spring/Summer) (1993): 66-74.<br />
220
Misic, M.M. and Johnson, K. Benchmarking: A Tool for Web Site Evaluation and Improvement. Internet Research<br />
9 (5) (1999): 383-92.<br />
Mitchell, A.A. and Olson, J.C.: Are Product Attribute Beliefs the Only Mediator of Advertising Effects on Brand<br />
Attitude? Journal of Marketing Research 18 (August 1981): 318-332.<br />
Moldovan, SE. Copy Factors Related to Persuasion Scores. Journal of Advertising Research 24(6) (1984): 16-22.<br />
Muehling, D.D., Stoltman, J.J. and Grossbart, S.L.: The Impact of Comparative Advertising on Levels of Message<br />
Involvement. Journal of Advertising 19(4) (1990): 41-50.<br />
Mukherji, J., Mukherji, A. and Nicovich, S. Understanding Dependency and Use of the Internet: A Uses and<br />
Gratifications Perspective. Boston, MA, 1998.<br />
Notani, AS. Perceptions of Affordability: Their Role in Predicting Purchase Intent and Purchase. Journal of<br />
Economic Psychology 18(5) (1997): 525-546.<br />
Novak, T.P., Hoffman, D.L. and Yung, Y.F. Modeling the Flow Construct in Online Environments: A Structural<br />
Modeling Approach. Marketing Science 19 (1) (2000): 22-42.<br />
Numbers. Business 2.0 (April 1999), 108.<br />
Nunnally, J.C.: Psychometric Theory. New York: McGraw-Hill, 1978.<br />
Obermiller, C. and Bitner, M.J.: Store Atmosphere: A Peripheral Cue for Product Evaluation, in American<br />
Psychological Association Annual Conference Proceedings, D.C. Stewart (Ed.) Vol. 52-53: American<br />
Psychological Association, 1984.<br />
Okasaki, S. and Rivas, J.A. A Content Analysis of Multinational's Web Communication Strategies: Cross-Cultural<br />
Research Framework and Pre-testing. Internet Research 12 (5) (2002): 380-390.<br />
Park, CW and Young, SM. Consumer Response to Television Commercials: The Impact of Involvement and<br />
Background Music on Brand Attitude Formation. Journal of Marketing Research 23 (February) (1986): 11-24.<br />
Petty, R.E., Cacioppo, J.T.: Attitudes and Persuasion: Classic and Contemporary Approaches. Dubuque, IA:<br />
William Brown Co, 1983a.<br />
Petty, R.E. and Cacioppo, J.T.: Communication and Persuasion: Central and Peripheral Routes to Attitudes<br />
Change. New York: Springer-Verlag, 1986.<br />
Petty, R.E., Cacioppo, J.T. and Schumann, D.: Central and Peripheral Routes to Advertising Effectiveness: The<br />
Moderating Role of Involvement. Journal of Consumer Research 10(2) (1983): 135-146.<br />
Petty, R.E., J.T. Cacioppo, and D. Schumann (1983), “Central and Peripheral Routes to Advertising Effectiveness:<br />
The Moderating Role of Involvement,” Journal of Consumer Research, 10 (2), 135-46.<br />
Ratchford, B.T.: The Value of Information for Selected Appliances. Journal of Marketing Research 27 (1) (1980):<br />
14-25.<br />
Regan, D.T. and Fazio, R.H.: On the Consistency between Attitudes and Behavior. Journal of Experimental<br />
Psychology 13 (1977): 28-45.<br />
Resnik, A. and Stern, B.L. An Analysis of the Information Content of Television Advertising. Journal of Marketing<br />
41 (1) (1977): 50-53.<br />
Rettig, J. “Beyond 'Cool'-Analog Models for Reviewing Digital Resources, Online 20 (5) (1996): 52-64.<br />
221
Rose, G., Khoo, H. and Straub, D.W. Current Technological Impediments to Business-to-Consumer e-Commerce,<br />
Communications of the Association for Information Systems, 1 (16) (1999).<br />
Rosen, DE and Purinton, E. Website Design Viewing the Web as a Cognitive Landscape. Journal of Business<br />
Research (forthcoming).<br />
Rowley, J.: Product Search in e-Shopping: A Review and Research Propositions. Journal of Consumer Marketing<br />
17(1) (2000): 20-35.<br />
Schlinger, MJ. A Profile of Responses to Commercials. Journal of Advertising Research 19(2) (1979): 37-46.<br />
Shneiderman, B. Designing Information-Abundant Websites. http://www.cs.umd.edu/projects/hcil//pubs/techreports.shtml,<br />
1996.<br />
Shavitt, S, Swan, S., Lowrey, TM, and Wanke, M. The Interaction of Endorser Attractiveness and Involvement in<br />
Persuasion Depends on the Goal that Guides Message Processing. Journal of Consumer Psychology 3 (1994): 137-<br />
162.<br />
Shim, S., Eastlick, M.A., Lotz, S.L. and Warrington, P. An Online Prepurchase Intentions Model: The Role of<br />
Intention to Search. Journal of Retailing 77 (3) (2001): 397-416.<br />
Shimp, T.A.: Attitude toward the Ad as a Mediator of Consumer Brand Choice. Journal of Advertising 10(2)<br />
(1981): 9-15.<br />
Siu, W.-S. and Chau, L.L.-F. Teaching Marketing Research with the Internet. Journal of Education for Business<br />
(1998) : 44-49.<br />
Stern, B.L., Krugman, D.M., and Resnik, A. Magazine Advertising: An Analysis of its Information Content.<br />
Journal of Advertising Research 21 (2) (1981): 39-44.<br />
Stevenson, J.S., Bruner II, G.C., and Kumar, A.: Web Page Background and Viewer Attitudes. Journal of<br />
Advertising Research 40(1/2) (2000): 29-34.<br />
Stigler, G. The Economics of Information. Journal of Political Economy 69 (1961): 213-25.<br />
Turley, L.W. and Milliman, R.E. Atmospherics Effects on Shopping Behavior: A Review of the Experimental<br />
Evidence. Journal of Business Research 49 (2000): 193-211.<br />
van der Heijden, H., Verhagen, T, and Creemers, M. Dieting Online Purchase Behavior: Replications and Tests of<br />
Competing Models. Proc. 34th Hawaii Internat. Conf. System Sci, Maui, HI. 2001.<br />
Venkatraman, M.P. and Price, L.L.: Differentiating between Cognitive and Sensory Innovativeness: Concepts,<br />
Measurement, and Implications. Journal of Business Research 20(4) (1990): 293-315.<br />
Yoo, C.Y. and Stout, P.A. Factors Affecting Users' Interactivity with the Web Site and the Consequences of Users'<br />
Interactivity, in Proceedings of the 2001 Conference of the American Academy of Advertising, C.R. Taylor (Ed.).<br />
Villanova University, Villanova, PA: American Academy of Advertising, 53-61, (2001).<br />
Yoon, D. Use of Endorsers in Internet Advertising: A Content Analysis of Top 100 American Advertisers Web<br />
Pages, in Proceedings of the 1999 Conference of the American Academy of Advertising, M.A. Shaver (Ed.).<br />
Michigan State University: East Lansing, MI, (2000).<br />
Zaichkowsky, J.L.: Measuring the Involvement Construct, Journal of Consumer Research 12 (December 1985):<br />
341-352.<br />
Zaichkowsky, J.L.: Conceptualizing Involvement, Journal of Advertising 15(2) (1986): 4-14.<br />
222
Zaichkowsky, J.L. The Personal Involvement Inventory: Reduction, Revision, and Application to Advertising.<br />
Journal of Advertising 23 (4) (1994): 59-70.<br />
223
Table 1: Results of Confirmatory Factor Analysis (after Deletions)<br />
Constructs Items % of<br />
CHPS<br />
STR<br />
EFF<br />
ENT<br />
INFO<br />
Navigational problems are limited<br />
Easy keywords to find information are used<br />
Product information is immediately accessible<br />
There is linkage to sites with relevant information<br />
It allows a great overview of its structure<br />
The structure is straightforward<br />
Information is not repetitive<br />
Information is superficial<br />
Information is accurate<br />
Information is up-to-date<br />
Exciting site<br />
Imaginative site<br />
Entertaining site<br />
Attractive site<br />
Useful site<br />
Resourceful site<br />
ATTI Surfing this Web site is an excellent way for me to spend my time<br />
I was smiling while I was exploring this Web site<br />
I was part of a like-minded group of people while using this Web site<br />
This Web site is an essential tool<br />
This Web site was a playful experience<br />
Compared with other Web sites, I would rate this one as the best<br />
EXPB When I hear about a new Web site, I'm always eager to check it out<br />
Surfing the Web to see what’s new is a waste of my time<br />
I like to browse the Web and find out about the latest sites<br />
224<br />
variance<br />
56.9<br />
Factor<br />
loadings<br />
0.752<br />
0.721<br />
0.607<br />
0.597<br />
78.9 0.886<br />
59.3<br />
67.6<br />
0.783<br />
0.509<br />
0.810<br />
0.913<br />
0.805<br />
0.897<br />
0.818<br />
0.690<br />
0.467<br />
86.5 0.677<br />
59.1<br />
0.468<br />
0.540<br />
0.792<br />
0.731<br />
0.844<br />
0.414<br />
0.614<br />
0.666<br />
Cronbach<br />
alpha<br />
0.78<br />
0.72<br />
0.63<br />
0.84<br />
0.84<br />
0.88
INV Important to me (1)... Unimportant to me (5)<br />
Means nothing to me (1) Means a lot to me (5)<br />
Worth remembering (1)... Not worth remembering (5)<br />
Relevant to my needs (1)... Irrelevant to my needs (5)<br />
Worth paying attention to (1). Not worth paying attention to (5)<br />
Convincing (1)... Unconvincing (5)<br />
Boring (1) Interesting (5)<br />
PPURI It takes a very long time to decide before buying drugs<br />
I get as much information as possible before purchasing a drug<br />
I always compare product characteristics among brands of a specific drug<br />
Before looking at this site, I will be interested in reading about the needed<br />
drug<br />
PURI Extremely willing to buy (1) Definitively not willing to buy (5)<br />
225<br />
64.6 0.506<br />
57.6<br />
53.9<br />
0.392<br />
0.668<br />
0.488<br />
0.733<br />
0.667<br />
0.588<br />
0.496<br />
0.454<br />
0.667<br />
0.852<br />
0.823<br />
0.707<br />
0.72<br />
0.87<br />
0.71
Table 2: Full Structural Model Fit<br />
FIT CRITERIA FULL MODEL<br />
Average Off-Diagonal Absolute Standardized<br />
Residuals<br />
0.084<br />
Distribution of Standardized Residuals Very good<br />
X 2<br />
924.4<br />
S-Bx2 767.5<br />
Degrees of Freedom (df) 578<br />
S-Bx2/df 1.33<br />
NFI 0.82<br />
NNFI 0.91<br />
CFI 0.92<br />
Adjusted CFI 0.94<br />
RMSEA 0.048<br />
226
Table 3: Statistical Significance of Regression Coefficients’ Estimates<br />
H Parameter estimate Standard<br />
error<br />
Test<br />
statistic<br />
Standardized<br />
estimate<br />
1CHPS� ATTI H1a *(one-sided test) 0.068 1.608 0.144<br />
11CHPS� INV H1b *** 0.039 2.951 0.206<br />
CHPS� EXPB H1c **** 0.060 3.431 0.325<br />
CHPS� PPURI H1d **** 0.068 4.569 0.378<br />
CHPS� PURI H1e NS 0.096 0.534 0.041<br />
STR� ATTI H2a *(one-sided test) 0.187 0.845 0.136<br />
STR� INV H2b **** 0.090 5.920 0.619<br />
STR� EXPB H2c NS 0.121 -1.137 -0.143<br />
11STR� PURI H2d ** 0.235 2.515 0.307<br />
EFF� ATTI H3a NS 0.167 0.934 0.104<br />
EFF� INV H3b ** 0.113 2.192 0.223<br />
11EFF� EXPB H3c *** 0.167 3.034 0.409<br />
EFF� PPURI H3d *(one-sided test) 0.150 1.402 0.130<br />
EFF� PURI H3e **(one-sided test) 0.219 1.805 0.159<br />
ENT� ATTI H4a **(one-sided test) 0.086 1.889 0.235<br />
11ENT� INV H4b *** 0.026 3.233 0.163<br />
1INFO� ATTI H5a * 0.166 -2.083 -0.310<br />
INFO� EXPB H5b ** 0.078 2.433 0.208<br />
ATTI�PPURI H6a **** 0.092 4.987 0.423<br />
ATTI� PURI H6b **(one-sided test) 0.116 1.884 0.132<br />
EXPB� ATTI H7a NS 0.127 -0.043 -0.005<br />
227
EXPB� INV H7b NS 0.080 0.062 0.006<br />
EXPB� PPURI H7c NS 0.121 -1.266 -0.117<br />
EXPB�PURI H7d *** 0.188 -2.605 -0.244<br />
INV� ATTI H8a NS 0.230 1.251 0.223<br />
INV� PPURI H8b NS 0.136 0.596 0.056<br />
INV� PURI H8c NS 0.283 -0.541 -0.069<br />
PPURI� PURI H9 **** 0.123 4.959 0.398<br />
**** significant at p < 0.001<br />
*** significant at p < 0.01<br />
** significant at p < 0.05<br />
* significant at p < 0.10<br />
228
Figure 1: Initial Conceptual Model<br />
RESPONSES<br />
STIMULUS ORGANISM<br />
ONLINE ENVIRONMENTAL CUES INTERNAL STATES<br />
SHOPPING OUTCOMES<br />
** High Task Relevant Affect * Pre-<br />
Purchase Intentions<br />
* Navigational Characteristics * Attitude<br />
(Involvement in Purchase<br />
*Informativeness Decisions)<br />
* Effectiveness of Information Content Cognition<br />
* Structure * Exploratory Behavior *<br />
Purchase Intentions<br />
** Low Task Relevant<br />
* Entertainment of the Web site<br />
229<br />
* Involvement
230
Mapping Retailing Enterpreneur Decisions And Behavior<br />
Arch G. Woodside, Boston College<br />
Abstract<br />
Retailing entrepreneurial behavior requires timely modifications in the assumptions of<br />
entrepreneurs in response to environmental responses / non-responses to decisions / actions of<br />
the new enterprise. This article applies Axelrod's (1976) and Huff’s (1990; Jenkins & Huff 2002)<br />
approach to mapping strategic thought (causal mapping) to: (1) categorize how retailing<br />
entrepreneurs may respond to environmental feedback to their decisions and (2) assess the<br />
effectiveness of alternative implemented decisions in assisting organizational growth. A detailed<br />
example of causal mapping is presented for a retailing entrepreneurial case study; the example<br />
covers processes linking events, decisions, and activities in business start-up, growth, and failure<br />
of the enterprise. The article closes by suggesting that causal mapping is a valuable tool for<br />
advancing case study research. A research plan for future reports applying causal mapping in<br />
retailing entrepreneur studies is suggested.<br />
231
MAPPING RETAILING ENTREPRENEUR DECISIONS AND BEHAVIOR<br />
In the early 1970's Mintzberg (1973) asked an important question on strategymaking:<br />
how do organizations make important decisions and link them together to form strategies?<br />
Based on a review of the available literature he concluded that little systematic evidence exists<br />
about this important process, known in business as strategy-making and in government as<br />
policy-making.<br />
Fortunately, since the early 1970's substantial advances have occurred in theoretical and<br />
empirical research on how and why strategy-making occurs. One research stream on strategy-<br />
making has been labeled the "emergent stream" approach (Nutt 1993), whereby the researcher<br />
collects field data on many strategymaking case studies and immerses in the raw data describing<br />
each case to find the<br />
key decision making activities (e.g., Mintzberg, Raisinghani, and Theoret 1976; Woodside and<br />
Vyas 1987). The emergent stream approach contributes substantially to our understanding of the<br />
linkages of decision-makers perceptions of environmental signals, events, decisions, and<br />
activities through time. A criticism of the emergent stream approach: the mass of detail makes it<br />
difficult to analyze the data. As a result, researchers using the emergent stream approach are<br />
forced to examine a limited number of cases, making generalizability of their conclusions<br />
suspect. "Researchers using a small case data base may fail to discover important action-taking<br />
steps or fail to recognize the idiosyncratic nature of the steps that are discovered" (Nutt 1993, p.<br />
228).<br />
232
Applications of causal mapping are a second research stream on strategy-making.<br />
Causal mapping is a form of content analysis that isolates the key assertions within a<br />
document, such as a detailed case research report; the content analysis includes proposing<br />
linkages of causality among signals, events, decisions, and activities (e.g., Fahey and<br />
Narayanan 1989; Cossette 1992; Barr, Stimpert, &Huff 1992; Jenkins & Huff 2002). Causal<br />
mapping studies have produced many linkages of observations -> insights -> propositions, for<br />
example, such maps indicate that (1) both successful and unsuccessful firms quickly notice<br />
environment signals but (2) respond to these signals very differently (two research findings<br />
that also serve as insights into success and failure, and well as theoretical propositions for<br />
future research). Calm mapping results indicate that leaders in failing firms fail to change their<br />
beliefs, focus, and ways of behaving during courses of protracted downward spirals, while<br />
leaders in firms able to adapt to new environments do make such transformations (cf. Barr et<br />
al. 1992, p. 34); the implication of these results to entrepreneurial strategy-making may be<br />
that leaders in new ventures may need to transform themselves and adopt new modes of<br />
strategy making (adaptive or planning rather than entrepreneurial) when their enterprises<br />
passes out of the start-up phase into growth, maturity, and renewal phases. Back in 1973, this<br />
point was emphasized by Mintzberg for the planning mode of strategy-making, "Planning is<br />
not a panacea for the problems of strategy-making." Some situations require little or no<br />
planning, such situations favor adaptive strategy-making; others require limited planning, such<br />
situations favor entrepreneurial strategy-making.<br />
233
Attempts to use a framework to find patterns in decision making are a third research<br />
stream (cf. Nutt 1993). Both reliability and generalizability improve when patterns emerge that<br />
have the same activity steps proposed in a framework and the step sequences fit a large number<br />
of cases. "However, imposing a framework has the disadvantage of creating the appearance of<br />
orderliness in what may be a chaotic process. Also, imposing a framework may result in losing<br />
important messages that do not fit the framework" (Nutt, 1993, p. 228). Nutt (1993; 2003)<br />
backs-up his view (with field data) that the advantage of systematic description of decisions<br />
and using a large case data base outweigh the disadvantages of matching to an overly neat set<br />
of steps and the possibility of lost information.<br />
This article describes an exploratory application of causal mapping to retailing<br />
entrepreneurial research. We begin by reviewing a few propositions unique to entrepreneurial<br />
strategy-making from insight and the available literature on entrepreneurial studies; the<br />
propositions serve as a framework for linking many of the decisions and events that occur in<br />
entrepreneurial behavior. Next, a brief review of causal mapping is provided; causal mapping<br />
may be used to summarize proposed, deductively developed, frameworks, as well as to<br />
inductively analyze entrepreneurial behavior. Third, a generic causal model of entrepreneurial<br />
start-up, growth, and failure is described. Fourth, a detailed field case study of the model is<br />
examined. Finally, implications are provided for research on entrepreneur strategy-making and<br />
for improving marketing decisions by leaders of new enterprises.<br />
234
Propositions on Entrepreneurial Strategy-Making<br />
The four principal characteristics of the entrepreneurial mode of strategy making<br />
proposed by Mintzberg (1973) serve as propositions distinguishing this mode of strategy-making<br />
from others (e.g.. adaptive and planning modes). The following four propositions are based, in<br />
part, on Mintzberg's 1973 statements. (1) In the entrepreneurial mode, strategy-making is<br />
dominated by the active search for new opportunities; problems are secondary and receive less<br />
attention. (2) In the entrepreneurial organization, power is centralized in the hands of the chief<br />
executive who rules by fiat, not by committee or teams. (3) Strategy-making in the<br />
entrepreneurial mode is characterized by dramatic leaps forward in the face of uncertainty; the<br />
organization makes dramatic gains with high risk of failure. (4) Growth, not efficiency, is the<br />
dominant goal of the entrepreneurial organization; thus, the entrepreneur is focused on growth in<br />
sales volume, not cost control or profits.<br />
Stevenson, Roberts, and Grousbeck (1989) definition of entrepreneurship also may<br />
serve as a central proposition of entrepreneurial strategy-making: (5) the pursuit of opportunity<br />
without regard to resources currently controlled. An axiom of this proposition is that<br />
entrepreneurs search for specific opportunities, and the selection/formulation of new venture<br />
concept, to invest their energies into transforming into realities before searching for financial<br />
resources. Waiting to grow a nest-egg to invest and then searching for an investment<br />
opportunity is not representative of most entrepreneurial strategy-making.<br />
Results from Collins and Moore's (1970) study of 100 entrepreneurships suggest<br />
several additional propositions that distinguish entrepreneurial strategy making, for example,<br />
almost all successful entrepreneurs experience several failures before creating and<br />
implementing a successful enterprise. An axiom to this proposition is that several start-up<br />
235
attempts resulting in failure are necessary for learning effective deal-making. Collins and<br />
Moore (1970, p. 80) use a school-of-hardknocks analogy for describing this process: basic<br />
dealing is not a course for the faint hearted, or for the fair-weather entrepreneur. This course<br />
separates the men from the boys. There is no telling how many broken businesses and broken<br />
homes are left behind by students who enroll in the course, but who did not have the character<br />
to complete it. This is part of the high price paid for the education of entrepreneurs.<br />
For their most successful new enterprise, entrepreneurs find one or two sponsors, or<br />
mentors, to help in achieving success for a unique financial, or marketing, decision/action.<br />
Seeking and finding help from someone outside the firm who has both the expertise and ability<br />
to help is found almost always in successful case studies on entrepreneurships (Collins and<br />
Moore 1970, Chapter 5).<br />
Likely, the 1973 insights by Mintzberg offer important propositions that still need to be<br />
examined empirically about entrepreneurial behavior. To achieve long-term success and avoid<br />
mid-range failure (often between the third and sixth year of the new enterprise), the entrepreneur<br />
must dramatically alter his / her strategy-making from the entrepreneur mode to include the<br />
adaptive and planning modes. Axioms of this proposition include (a) flexibility in actions<br />
mustshift to become constrained, not bold; (b) almost linkages between events and decisions<br />
must be integrated, not loosely coupled; and (c) analytical, not judgmental, evaluations of<br />
proposals must be made.<br />
Thus, at some point during the growth stage of the successful new enterprise, the<br />
entrepreneur needs to recognize the need to change his/her mode of strategy making; most<br />
236
entrepreneurs fail to recognize this need and continue making bold moves, focus on maintaining<br />
growth (forecasting impossible sales volumes), and ignoring major problems.<br />
Causal Mapping<br />
Causal mapping is mostly used as a form of content analysis that isolates the key<br />
assertions within a document that deal with causality, existence, and/or categorization. The links<br />
among decisions, activities/events, and the interactions among persons can be summarized<br />
through time within causal maps.<br />
Causal mapping can be applied to descriptive data (i.e., thick descriptions reported in<br />
case studies) on the streams of decisions and behavior occurring through the stages of<br />
formulation and implementation of new enterprises. Coding schemes developed by Axelrod<br />
(1976) with modifications by Huff, Narapareddy, and Fletcher (1990) may be used to indicate<br />
causal and definitional relationships among the linkages in the causal maps; we used some of the<br />
coding categories developed by these researchers for the relationships proposed and found in<br />
entrepreneur strategy-making. The seven coding categories used here are summarized in Table 1.<br />
The symbol, "c," for choice criterion in making a decision is the one additional category not<br />
found in the codes used by Barr et al. (1993).<br />
Table 1 here.<br />
A "map" or series of related maps is then constructed by connecting specific events,<br />
decisions, and interactions of people with a symbol for the type of relationship observed. For<br />
example, consider the sentence, "entrepreneurs search for specific opportunities, and the<br />
selection/formulation of new venture concept, to invest their energies into transforming into<br />
realities before searching for financial resources." The linkages among activities decisions<br />
237
included in this sentence would be coded as follows: (search for specific opportunities) �<br />
(selection / formulation of new venture business model) � (search for financial resources).<br />
Three coders were trained to analyze several thick descriptions of cases on entrepreneur<br />
start-ups (in Fraser 1992). Following training and discussion on two of cases, the third set of<br />
codings were completed individually and tested to ascertain intercoder reliabilities. The average<br />
agreement among the three coders was a satisfactory 88 percent on the causal linkage codes<br />
assigned. Previous applications<br />
of near identical coding methods have achieved similar levels of high reliabilities (e.g., Axelrod<br />
1976; Barr, et al. 1992).<br />
Following training and the establishment of intercoder reliability, all three coders were<br />
assigned to code a fourth case description on entrepreneur behavior, the Millie Hand Cooked<br />
Potato Chip case (in Fraser 1992). The average intercoder reliability for the Millie case was 92.1<br />
percent.<br />
Working separately, the three judges were also asked to provide a parsimonious map<br />
that further summarized the key concepts and links in the Millie Case. The three judges then<br />
worked jointly to combine their three summary maps into the one described in the results<br />
section.<br />
After testing for intercoder reliability and developing the parsimonious, summary, map.<br />
The three judges also worked together to combine their three detailed maps of the stages found<br />
in entrepreneur behavior in the Millie case. In developing their individual maps the three<br />
judges had concluded that three stages had occurred in the Millie case: start-up, growth, and<br />
demise.<br />
238
Finally, the three judges worked as a team to evaluate 17 decision areas in each of the<br />
three stages. A seven-level evaluation system was used ranging from:<br />
• !!! for a remarkably effective decision/event<br />
• ??? for a disastrous decision/event.<br />
Because the evaluation assignments were made knowing the outcomes of the decisions and<br />
events, the assignments were made with few disagreements among the judges; disagreements<br />
were settled by discussion and consensus. Having the judges make evaluation assignments<br />
individually and testing for interceder reliability would be an improvement on this method.<br />
The Millie Case<br />
The "Millie's Hand Cooked Potato Chips" case is an undisguised thick description of<br />
entrepreneur behavior covering a five-year period, 1984 through 1988. Brian Shore was the<br />
entrepreneur who founded the company in 1984. Sales of the Millie hatched cooked chips<br />
(versus continuous cooked chips offered by larger competitors) increased from $500,000 to $3<br />
million during the brief life of the firm.<br />
Limitations. Causal mapping approaches of retailing entrepreneur case studies are<br />
limited in several ways. For research on entrepreneur behavior, additional work on inter coder<br />
reliability is needed to confirm the consistency of both creating concepts and coding linkages in<br />
such maps. Also, the accuracy of most published thick descriptions of real-life entrepreneur<br />
cases is questionable. The use of multiple research methods and the checking of facts by using<br />
multiple sources, and the re-checking of mental thoughts is not often described in such cases;<br />
thus, no evidence is provided in most of these cases on concurrent validity.<br />
239
Detailed causal maps are needed in large samples of entrepreneur case studies to test the<br />
propositions. The application presented here is exploratory only. Certainly causal mapping of<br />
entrepreneur behavior provides a research approach suitable for examining large numbers of<br />
such cases, similar to the research on formulation processes in organizational decision making<br />
reported by Nutt (1993).<br />
A Generic Causal-Map Model of One Category of Entrepreneur Behavior<br />
Figure 1 is the summary map developed by the three judges and based on their<br />
240
individual summary maps of the Millie case. Note that this summary map does reflect most of<br />
the defining propositions described as representative of entrepreneur Behavior. For example,<br />
the first box in the map verifies the sixth proposition that most entrepreneurs have a history of<br />
starting several new ventures that fail.<br />
Figure 1 here.<br />
In Figure 1, search and venture concept formulation is shown as leading steps before<br />
funding search. This sequence fits the fifth proposition and what Stevenson et al. (1989, p. 7)<br />
focus on to define "entrepreneurship as a behavioral phenomenon." The appearance of box 14,<br />
unrealistic sales growth forecasts, is a concept that may often appear in entrepreneur causal<br />
maps; this concept may be an outcome of the fourth proposition that growth, not efficiency, is<br />
the dominant goal of the entrepreneurial organization; thus, the entrepreneur is focused on<br />
growth in sales volume, not cost control or profits. The rapid increase in costs reported in box 13<br />
reflects the lack of cost control of the fifth proposition.<br />
Of course, empirically testing of the eight propositions is not possible based on a<br />
summary of one case. However, the summary presented in Figure 1 serves to illustrate that<br />
several propositions representative of entrepreneur behavior are likely to occur in causal maps of<br />
such behavior. Testing for the occurrence of each proposition is possible using large sample<br />
sizes of entrepreneur case studies (e.g., n > 100). To test the eighth proposition on transforming<br />
entrepreneur to planning modes of strategy-making would require case samples to include<br />
successes and failures that extend through long time periods, for example, five to ten years of life<br />
for each case.<br />
Detailed Causal Map of Entrepreneur Start-up, Growth, and Demise<br />
241
Start-up. Details of the stream of decisions, events and interactions between channel<br />
members that involved the Millie Company are summarized in Figure. 2. Note in Figure 2 that<br />
some signals are present (and not present) that support the third proposition discussed on<br />
entrepreneur behavior, that is, strategy-making in the entrepreneurial mode is characterized by<br />
dramatic leaps forward in the face of uncertainty; the organization makes dramatic gains with<br />
high risk of failure. For example, no detailed marketing evaluation or plan occurs between before<br />
or after box 4, when the new venture formulation and selection process is complete. No<br />
verification is made that some market target may actually prefer the new product versus<br />
competing products before the product and packaging is completed. Substantial funding is<br />
achieved in the face of high risk of failure.<br />
Figure 2 here.<br />
The decisions within Millie displayed in Figure 2 are made by Brian Shore; for the start-<br />
up power is centralized in the hands of the chief executive who rules by fiat, not by committee or<br />
teams. Thus, the second proposition is supported for the first stage in the case. Note that this<br />
finding holds even for the flavor of the new potato chip, Mr. Shore alters the product to suit his<br />
own taste (box 2 in Product Design); customers in the selected target market are not consulted--<br />
no taste tests are done-before manufacturing.<br />
Marketing the product appears doomed for failure or limited success at the end of the<br />
start-up stage; no major supermarket chains agree to carry the new product because of lack of<br />
advertising to create customer awareness (box 13) and the failure of Mr. Shore to provide large<br />
retailers with expected payments for shelf space for new products (box 15).<br />
242
Growth. The growth stage of Millie Company is summarized in Figure 2. This causal<br />
map begins with a remarkably beneficial decision by Mr. Shore. He approaches a large<br />
Supermarket chain in the Ontario Province of Canada with a proposition to manufacture a<br />
Kosher potato chip for the Jewish holidays. This unique offer, marketing tactic, is accepted; for<br />
the first time, Millie is able to gain product placement in a large supermarket chain with stores in<br />
several Provinces (without offering shelf allowances). With the product's acceptance in one<br />
chain, the other' three largest chains quickly follow this lead (box 3). Thus, the third proposition<br />
described is supported: strategy-making in the entrepreneurial mode is characterized by dramatic<br />
leaps forward in the face of uncertainty; the organization makes dramatic gains with high risk of<br />
failure.<br />
Figure 3 here.<br />
.<br />
Note also that Mr. Shore continues to pursue rapid growth through-out the growth stage<br />
(see boxes 6 and 15 in Figure 3). He is unwilling to transform strategymaking from the<br />
entrepreneur mode to an adaptive, or planning, mode.<br />
Two decisions made by Mr. Shore to continue sales growth were judged to be very bad<br />
moves (??) by the three judges: the decisions shown in boxes 6 and 15. Millie's batch process<br />
versus competitors' continuous process requires substantially higher unit costs (see box 11 in<br />
Figure 2).<br />
Thus, offering the Millie product at a price lower than competitors' prices provides<br />
substantially less margin to cover costs and generate profits. Also, lessons from the Profit Impact<br />
of Marketing Strategies (PIMS 1980) include the folly of little market share brands companies<br />
attempting to compete head-on against much larger foes (box 15); successful small firms are<br />
243
more successful when they avoid bigger competitors and offer unique products to narrow market<br />
niches at higher prices<br />
(PIMS 1980).<br />
Demise. The final stage for the Millie company begins with a decision evaluated by the<br />
three judges to be a disastrous move: Mr. Shore purposively decreases quality by increasing the<br />
usage time of the frying oil in the manufacturing process (box 1 in Figure 4). The resulting<br />
product is substantially more greasy than prior manufacturing runs. Sales start to decline almost<br />
immediately (boxes 3 and 4 in Figure 4).<br />
Note also in Figure 4 that Mr. Shore never focuses on issues of lost sales but continues to<br />
focus his efforts on expanding market coverage: by moving more aggressively into the Ontario<br />
market (box 9) and attempting to hire a broker to add distributors (box 10).<br />
Figure 4 here.<br />
Evaluation of Outcomes of 17 Decisions Areas across the Three Stages.<br />
Table 2 includes the summaries of the three judges outcome evaluations of 17 decision<br />
areas. Note that between the start-up to the demise stages that a shift does occur in the number<br />
of decision areas be judged very good to very bad, for example, product design decisions shift<br />
from very good (box 6 in Figure 2) to remarkably good (box 1 in Figure 3) to very bad (box 15<br />
at the end of Figure 3) between the three stages.<br />
Table 2 here.<br />
Note also in Table 2 that the pricing strategy was judged very bad consistently across the<br />
three stages. Evidently, Mr. Shore did not consider that the selected target market of young,<br />
244
upwardly mobile, professionals, might be willing to pay a higher price for a better tasting with<br />
all "natural ingredients," Most likely, the high cost, low-price, strategy for the Millie chip helped<br />
the firm move to a negative cash flow and a lower quality image in customers' minds, than would<br />
have been achieved with the product's price being above competitors' prices.<br />
By the close of the company, only the outcomes associated with the packaging were<br />
considered positively. The outcomes of all other decision areas shifted negatively or remained<br />
negative. In Table 2, decision area outcomes indicated by both an exclamation point and<br />
question mark M) are to indicate that the outcome contains both positive and negative<br />
outcomes. For example, product quality is unique in the start-up and growth stages, but might<br />
have been made substantially better with some consumer taste tests of alternative recipes.<br />
Implications for Research on Retailing Entrepreneur Behavior<br />
Causal mapping may be used to both develop theoretical models of sets of propositions<br />
about processes representative of retailing entrepreneur strategy-making. Such deductively<br />
developed processes may be tested by comparing their predictions of the presence and sequence<br />
of decisions, events, and interactions of people with causal maps of actual entrepreneur behavior.<br />
Large size samples of thick descriptions of real-life entrepreneur cases may serve as data<br />
bases for developing empirical causal maps. Such large scale studies on decision processes are<br />
appearing in the literature of organization science. As such, causal mapping represents an<br />
advanced case study research method deserving wider use among researchers in entrepreneur<br />
behavior.<br />
References<br />
245
Axelrod, Robert (1976), "The Cognitive Mapping Approach to Decision Making," in Robert<br />
Axelrod, ed., Structure of Decision Making, Princeton, NJ: Princeton University Press,<br />
221-250.<br />
Barr, Pamela S., J. L. Stempert, and Anne S. Huff (1992), "Cognitive Change, Strategic Action,<br />
and Organizational Renewal," Strategic Management Journal, 13 (S), 15-36.<br />
Collins, Orvis, and David G. Moore (1970), The Organization Makers: A Behavioral<br />
Study of Independent Entrepreneurs, New York: Appleton-Century-Crofts.<br />
Cassette, Pierre, and Michel Audet (1992), "Mapping of an Idiosyncratic Schema,"<br />
Journal of Management Studies, 29 (3), 325-347.<br />
Fahey, Liam, and V. K. Narayanan (1989), "Linking Changes in Revealed Causal Maps and<br />
Environmental Change: An Empirical Study," Journal of Management Studies, 26 (4),<br />
361-378.<br />
Follows, Scott B. (1992), "Millie s Hand Cooked Potato Chips," in Hanna Fraser,<br />
Entrepreneurship in Atlantic Canada, Acadia University, Wolfville, Nova Scotia:<br />
Atlantic Entrepreneurial Institute, 147-152.<br />
Huff, A.S., V. Narapareddy, and K.E.Fletcher(1990), "Coding the Association of Concepts," in<br />
A.S. Huff, ed., Mapping Strategic Thought, Chichester, U.K.: Wiley, 311-326.<br />
Huff, A. S. (1990), "Mapping Strategic Thought," in A. S. Huff, ed., Mapping Strategic<br />
Thought, Chichester, U.K.: Wiley, 88-115.<br />
Jenkins, Mark, and A. S. Huff (2002), Mapping Strategic Knowledge, Thousand Oaks, CA:<br />
Sage.<br />
Mintzberg, Henry (1973), "Strategy-Making in Three Modes," California Management Review,<br />
16 (2), 44-53.<br />
246
Mintzberg, Henry, D. Raisinghani, and A. Theoret (1976), "The Structure of ‘Unstructured’<br />
Decision Processes,” Administrative Science Quarterly, 21, 246-275.<br />
Nutt, Paul C. (1993), "The Formulation Processes and Tactics Used in Organizational Decision<br />
Making," Organization Science, 4 (2), 226-252.<br />
PIMS, The PIMS Program (1980), Cambridge, MA: The Strategic Planning Institute. Stevenson,<br />
Howard H., Michael J. Roberts, and H. Irving Grousbeck (1989), NewBusiness Ventures<br />
and the Entrepreneur, Homewood, IL: Irwin.<br />
Woodside, Arch G., and Niran Vyas (1987), Industrial Purchasing Strategies, Lexington, MA:<br />
Lexington Books.<br />
247
1. Brian Shore starts several<br />
+<br />
2. B.S. searches for new<br />
7 Search for financing<br />
of new venture<br />
E’s that result 1 E in starts failure several new venture 2 opportunity Search for new<br />
ventures that fail<br />
venture opportunities +<br />
c<br />
+<br />
+<br />
3. Products generates services 4 Snack food, potato<br />
even in hard times<br />
e<br />
chips chosen<br />
e<br />
m +<br />
6 Final product design 4 Market + analysis mfg.<br />
5 Canadian retail sales in<br />
analysis<br />
1984 are $500 million; 3<br />
6 B.S. goal is 2% of<br />
+<br />
dominating<br />
competitors<br />
industry sales<br />
m<br />
+<br />
+<br />
7 Target market<br />
+ 9 Manufacturing<br />
selection and marketing<br />
process finalized and<br />
plan<br />
runs completed<br />
+<br />
e<br />
+<br />
m<br />
3 Venture concept<br />
e<br />
formulation<br />
8 $30.000 from<br />
silent partner<br />
e + m<br />
9 $64.000 from<br />
5 sixth Funding bank search<br />
and approached. success<br />
10 $10,000 from<br />
federal 10 Distribution government<br />
small problems business occur; loan<br />
secondary system<br />
developed<br />
Product Design<br />
7 Only firm with m<br />
8 Package<br />
hand cooked chip + design a<br />
e m 2 B.S. alters to suit his<br />
1 75 year-old<br />
in Canada<br />
own tastes<br />
Mennonite 8 recipe Pricing, Product, Promotion,<br />
12 Major, favorable, + e 11 Unique<br />
and Place Destination levels<br />
distribution development<br />
e<br />
marketing action<br />
occurs<br />
specified e<br />
6 Thicker, more nutritious = 9 “Millie’s sound taken by CEO<br />
3 Batch Process<br />
and flavorful chip<br />
liked by B.S.<br />
e<br />
+<br />
+<br />
e<br />
e<br />
5 No preservatives, no m.g.;<br />
sunflower<br />
+<br />
oil; chips<br />
10 “Natural ingredients” 15 Unrealistic and sales<br />
statement on growth mfg process forecasts<br />
4 Chips hand-stirred; cholesterol free 14 Attempt to reduce<br />
cooking time set by sight<br />
13 Rapid growth in<br />
+<br />
+<br />
costs by decreasing 11 Cost 20% higher than<br />
product quality conventional 17 chips Customer<br />
sales and costs;<br />
+ franchise declines;<br />
widespread distribution +<br />
rapid snowball<br />
acceptance<br />
16 Pricing strategy:<br />
decline in sales<br />
Implementation<br />
+<br />
be lower than larger<br />
competitors<br />
13 No advertising; lots a 14 Distribution: independent grocery<br />
12 Target<br />
of free samples<br />
and convenience stores<br />
market: Yuppies<br />
Key: E= entrepreneur a<br />
+<br />
+<br />
15 B.S. refuses to provide shelf<br />
16 Chains refuse to 17 Unique Go to<br />
allowances to get listings in chains carry new<br />
FIGURE<br />
product<br />
1<br />
product stage 2<br />
Generalized Cause Map of Entrepreneur Start-Up, Growth, and Failure Process<br />
FIGURE 2 a<br />
Cause Map of Failure Process of Entrepreneurship:<br />
Millie’s Handcooked Potato Chips; Stage 1, Start Up<br />
a key: E= entrepreneurship; m.g.= monosodium glutamate<br />
+<br />
248<br />
+<br />
-<br />
+
1 B.S. approaches<br />
Steinberg chain with<br />
offer to provide Kosher<br />
chip<br />
2 Unique product<br />
design matched to <strong>value</strong><br />
of narrow target market<br />
9 New $200,000 foam-<br />
filled<br />
packaging<br />
machine<br />
purchased;<br />
variety increased<br />
13 B.S. forecasts<br />
sales of $13 million<br />
next year<br />
14 Production<br />
operation moves into<br />
$1.3 million<br />
plant<br />
financed by $250, 000<br />
loan from SBDC<br />
e<br />
+<br />
+<br />
m<br />
a<br />
m<br />
+<br />
+<br />
3 Millie’s accepted in<br />
3 large chains; Sobey’s,<br />
The Food Group, IGA<br />
7 B.S. contracts with<br />
independent wholesalers<br />
through Maritime<br />
Provinces<br />
m<br />
8 Wholesalers not<br />
visited by B.S.; no store<br />
visits<br />
249<br />
+<br />
+ +<br />
11 Stores sold out of<br />
Millie’s in 2 weeks<br />
+<br />
15 B.S. wants to<br />
compute in<br />
conventional chip<br />
market and mfg. thin<br />
chip, “Archie’s”<br />
FIGURE 3<br />
Cause Map, Stage 2, Growth<br />
+<br />
+<br />
m<br />
a<br />
+<br />
4 Distribution<br />
expands to PEI and<br />
Newfoundland<br />
+<br />
+<br />
5 B.S. goal is to<br />
increase sales<br />
volumes<br />
+<br />
6 Millie positioned<br />
as low-price<br />
competitor<br />
10 1987, first large<br />
national order received<br />
12 First<br />
international order<br />
received from<br />
Taiwan importer<br />
16 Price strategy<br />
lower than national<br />
large, competitors<br />
products 1987 sales<br />
= $3 million<br />
-<br />
-
+<br />
1.<br />
B.S.<br />
‘Maximizes use<br />
of frying oil to<br />
reduce<br />
8.<br />
Some<br />
wholesalers<br />
drop product<br />
due to falling<br />
sales<br />
m<br />
9.<br />
B.S. continues to<br />
look for<br />
expansion in<br />
Ontario<br />
m<br />
2.<br />
No testing done<br />
on oil quality<br />
+<br />
+<br />
13.<br />
Sales drop further<br />
a<br />
+<br />
7.<br />
Millie’s sales<br />
drop<br />
dramatically<br />
a<br />
3.<br />
Millie’s chips<br />
became<br />
interestingly<br />
greasy<br />
250<br />
6.<br />
Government<br />
introduces new<br />
sales tax on snack<br />
food<br />
10.<br />
11.<br />
B.S. meets<br />
+<br />
Miles several<br />
+ Tentative<br />
m<br />
agreement<br />
times to act as<br />
Ontario broker reached: Miles to<br />
be broker<br />
m<br />
+<br />
+<br />
14.<br />
Touche Ross appointed to be<br />
receiver of Millie’s: Millie’s<br />
bankrupt<br />
Figure 4<br />
Cause Map, Stage 3, Demise<br />
+<br />
4.<br />
Sales start to<br />
decline in June<br />
1987<br />
5.<br />
Price war starts<br />
among 3 large<br />
national<br />
competitors<br />
12.<br />
B.S. stops<br />
returning<br />
Miles’<br />
phone calls<br />
m
An Empirical Examination of Retail Convenience for In-Store and Online Shoppers<br />
Nicole Ponder, Mississippi State University<br />
Michelle Bednarz, Mississippi State University<br />
Abstract:<br />
In this study, we develop and assess multidimensional scales of retail convenience for in-store<br />
and online shoppers. Principal components analysis and confirmatory factor analysis reveal five<br />
dimensions of retail convenience for in-store shoppers, and four dimensions of retail<br />
convenience for online shoppers. Analysis of variance results indicate that online shoppers<br />
benefit more from access convenience and search convenience than in-store shoppers.<br />
Implications for retailers and areas for future research are also addressed.<br />
Introduction<br />
The concept of convenience has been an important topic in marketing for a time period<br />
spanning approximately 80 years (Copeland 1923; Gardner 1945; Kelley 1958; Brown 1989,<br />
1990; Seiders, Berry, and Gresham 2000; Berry, Seiders, and Grewal 2002). However, much of<br />
this research focuses on convenience goods, rather than convenience as a benefit realized by the<br />
consumer. Because today’s consumer is more time-starved than ever, it is appropriate to more<br />
carefully consider convenience as a concept of utmost importance.<br />
Foote (1963) characterized the consumer of the future (in the year 2000) as one whose<br />
primary constraints are no longer money, but time and learning. His prediction is correct.<br />
Today’s consumers consider the resource of time as valuable as money (if not more valuable).<br />
Bhatnagar, Misra, and Rao (2000, p.98) confirm this by stating that “the consumer maximizes<br />
his utility subject to not only income constrains but also time constraints.”<br />
As time becomes a more valuable consumer resource, convenience also provides added<br />
<strong>value</strong>. Michael J. Sansolo, senior vice-president at the Food Marketing Institute, illustrates the<br />
251
degree of importance consumers place on convenience by stating, “Give shoppers a choice<br />
between lower prices or more convenience and convenience will win every time” (Forster 2002,<br />
p. 120). Online shopping is particularly well suited to offer convenience to time-starved<br />
consumers (Kaufman-Scarborough and Lindquist 2002). In an otherwise lackluster economy,<br />
the strong growth rates of companies such as eBay, Land’s End, and Amazon have occurred<br />
because they provide customers with what they want – its all about convenience (Green 2002).<br />
When examining the literature related to the convenience construct, many gaps exist,<br />
particularly in a retail context. While it is assumed that consumers often seek convenience in<br />
shopping situations, we know little about the individual dimensions of retail convenience.<br />
Seiders, Berry, and Gresham (2000) propose four dimensions of convenience that are<br />
particularly relevant for retailers: access, search, possession, and transaction convenience (see<br />
Table 1). An empirical investigation of how these convenience dimensions provide a benefit to<br />
consumers is warranted. Specifically, do in-store shoppers and online shoppers seek and obtain<br />
different types of convenience? This study considers that different structures of retail<br />
convenience may exist, depending on the shopping format chosen by the consumer. The<br />
argument developed here is that different shopping formats deliver different types of<br />
convenience, and a consumer’s preference for a specific type of convenience determines his or<br />
her decision to choose a particular shopping format – either online or at a traditional store.<br />
This study is important for several different reasons. First, it follows the logical<br />
progression of research in this area. Retailers may now better understand the existence of<br />
different convenience dimensions, but how can they use this new knowledge to better satisfy<br />
customers? As Berry (2001, p. 136) states, “Superior retailers understand that people’s most<br />
precious commodity in the modern world is time and do everything they can to save as much of<br />
it as possible for their customers.” By developing a better understanding of the different<br />
252
dimensions of retail convenience and by understanding which dimensions of convenience are<br />
most important to customers, retailers will be able to better understand how to meet customers’<br />
needs, thus improving customer <strong>satisfaction</strong>. If properly implemented, retail convenience could<br />
become a source of sustainable competitive advantage for retailers.<br />
This paper is organized in the following manner: A review of the literature relevant to this<br />
study is presented. Scale development procedures are followed in order to more carefully<br />
examine the specific dimensions of retail convenience for both in-store and online shoppers. A<br />
different model for each type of shopping format is hypothesized and tested using structural<br />
equation modeling techniques. Results are given, followed by a discussion that addresses the<br />
implications of the findings for retailers with traditional stores and/or an online presence.<br />
Limitations and directions for future research are also provided.<br />
Literature Review<br />
The concept of convenience first appeared in the marketing literature with Copeland’s<br />
(1923) classification of goods. Copeland suggests that by classifying goods according to his<br />
tripartite structure (convenience, shopping, or specialty goods), marketers can determine the type<br />
of store in which the product should appear and can determine the appropriate concentration of<br />
distribution. Convenience goods are those lower-priced goods which consumers are familiar<br />
with and which are purchased from easily accessible outlets. Gardner (1945, p. 275) provides a<br />
further description:<br />
Convenience goods are articles of daily purchase…which are insignificant in<br />
<strong>value</strong> or are needed for immediate use. These goods are, to a considerable extent,<br />
bought at the most convenient place without a comparison of <strong>value</strong>s….<br />
As marketers continued to develop other product classification systems, convenience<br />
goods remained an essential staple, re-appearing in several other schemata (Bucklin 1963; Kaish<br />
1967; Holbrook and Howard 1977; Enis and Roering 1980; Murphy and Enis 1986). Thus, the<br />
253
initial use of the word “convenience” in the marketing literature was as an adjective describing a<br />
class of consumer goods. Many researchers have conducted studies covering the vast domain of<br />
convenience goods, including convenience foods (e.g., frozen dinners, ready-to-eat cold cereal,<br />
fast-food restaurants) (Crist 1960; Anderson 1972; Reilly 1982; Darian and Cohen 1995),<br />
convenience time-saving durables (e.g., dishwashers, microwave ovens, washers and dryers)<br />
(Anderson 1972; Reilly 1982), and time-saving services (e.g., child care, house cleaning<br />
services, lawn care services) (Brown 1990).<br />
Over time, the use of the word “convenience” has changed/evolved from a descriptor of<br />
products into its own unique concept. The more complete definitions of convenience contain<br />
one common element - they all view convenience as any attribute that reduces the non-monetary<br />
costs associated with a product (Kelley 1958; Kotler and Zaltman 1971; Etgar 1978). For<br />
purposes of this study, retail convenience (at its most general level of abstraction) is defined as<br />
the consumer’s perceptions of time and effort costs associated with making a purchase. As the<br />
reduction of time and effort costs is a motivating factor for consumers to seek convenience, these<br />
concepts are described more fully below.<br />
Time and Effort Literature<br />
Time is a limited, scarce, and therefore valuable consumer resource (Jacoby, Szybillo, and<br />
Berning 1976). As a limited, scarce, and valuable resource, consumers are always looking for<br />
ways to save time, be it through convenience products, convenience services, convenience<br />
durables, or more recently through convenience shopping. One reason why saving time has<br />
become so important to consumers is because time, unlike money or other resources, is fixed and<br />
therefore incapable of being expanded (Berry 1979; Gross 1987). According to Berry (2001,<br />
p.136), “Superior retailers understand that people’s most precious commodity in the modern<br />
world is time and do everything they can to save as much of it as possible for their customers.”<br />
254
Like time, effort is also a valuable consumer resource which is characterized by<br />
consumers’ energy expenditures. Activities requiring great amounts of energy on the<br />
consumers’ part are considered inconvenient, while activities requiring minimal energy on the<br />
consumers’ part are considered convenient. As a completely different type of non-monetary<br />
cost, consumers’ effort expenditures not only influence perceptions of convenience (Seiders,<br />
Berry, and Gresham 2000), but also influence levels of <strong>satisfaction</strong> (Lovelock 1983).<br />
Human and cognitive effort has been the topic of many studies appearing in other<br />
disciplines including operations management, psychology, decision theory, and economics<br />
(Youngdahl and Kellog 1997; Bettman, Johnson, and Payne 1990). However, consumer effort<br />
expenditures have received significantly less attention within the marketing literature (Berry,<br />
Seiders, and Grewal 2002), perhaps because product or service attributes that aim to save effort<br />
are perceived as being the same as, and as a result are lumped together with, those that aim to<br />
save time (Brown 1990). Thus, in a retail context, consumers view both time and effort as costs<br />
that are associated with obtaining the desired product and/or service. In the decision-making<br />
process, consumers must decide if the costs of obtaining the desired product/service are worth<br />
the benefits they will receive from the purchase.<br />
Cost-Benefit Analysis<br />
The driving force that motivates consumers to seek convenience involves saving both time<br />
and effort expenditures. According to Prest and Turvey (1965, p. 683), “Cost-benefit analysis is<br />
a practical way of assessing the desirability of projects” and “implies the enumeration and<br />
evaluation of all the relevant costs and benefits.” When deciding between several alternatives<br />
(e.g., whether to shop in a traditional store or in a virtual store), consumers determine the costs<br />
and benefits associated with each and compare those costs to the benefits.<br />
255
In the decision-making process, time and effort are significant consumer costs and are<br />
often considered along with money and other resources (Jacoby, Szybillo, and Berning 1976;<br />
Bhatnagar, Misra, and Rao 2000). Consumers choose online shopping because it facilitates the<br />
steps in the decision process, saving consumers both time and effort in the search, alternative<br />
evaluation, and purchase stages. Bhatnagar, Misra, and Rao (2000) apply cost-benefit analysis<br />
to explain why consumers choose to shop online:<br />
[Internet stores] tend to reduce the time the consumer spends on shopping (travel<br />
time, time spent parking, time spent traveling from the parking lot to the store,<br />
time spent in the checkout lines) either directly or indirectly. … The only time<br />
component remaining is the time spent browsing the Web sites (which<br />
corresponds to the time spent browsing the aisles in the more traditional sources<br />
of retailing). Therefore, a great attraction of the Internet is the convenience that it<br />
affords (p. 98).<br />
In other words, the benefits of shopping online (easy access to retailers) outweigh the costs (not<br />
obtaining the product immediately). Depending on what type of convenience is most important<br />
to the consumer, the cost-benefit analysis could lead to a different shopping format decision.<br />
The different types of convenience that consumers may choose to seek are described below.<br />
The Multidimensional Nature of the Convenience Construct<br />
Table 1 presents the various definitions and dimensions of convenience proposed by<br />
researchers in this area. Brown (1989) is the first to define the construct of convenience, and he<br />
focuses on the need for a definition that reflects the term’s multidimensional nature. The<br />
definition of convenience proposed by Brown (1989, 1990) contains five different dimensions:<br />
time, place, acquisition, use, and execution. Note that all five of the dimensions reflect the idea<br />
of saving consumers’ time and effort expenditures.<br />
--------------------------------<br />
Table 1 about here<br />
--------------------------------<br />
256
Berry, Seiders, and Grewal (2002) identify and define five dimensions of convenience<br />
applicable to the services arena: access, decision, transaction, benefit, and post-benefit. Seiders,<br />
Voss, Grewal, and Godfrey (2003) empirically investigate these dimensions of service<br />
convenience and their relationship to <strong>value</strong> perceptions and behavioral intentions. Their findings<br />
suggest that decision convenience has a positive effect on <strong>value</strong> perceptions; access convenience<br />
has no significant effect on either <strong>value</strong> perceptions or behavioral intentions; transaction<br />
convenience has a positive effect on behavioral intensions; and benefit convenience has a strong<br />
positive effect on both <strong>value</strong> perceptions and behavioral intentions.<br />
Seiders, Berry, and Gresham (2000) identify and define four dimensions of convenience<br />
that are specific to retailers. These four dimensions of retail convenience are essential for the<br />
purposes of this study. They are discussed in greater detail below.<br />
Access convenience. Access convenience is defined as “the speed and ease with which<br />
consumers can reach a retailer” (Seiders, Berry, and Gresham 2000, p. 81). This access may<br />
occur in person, over the phone, through a computer, or in other ways. Access convenience is an<br />
extremely important dimension of retail convenience, because if the consumer cannot reach the<br />
retailer, then all other dimensions of retail convenience are meaningless. In other words, if the<br />
consumer cannot reach the retailer, then they will never be given the opportunity on that<br />
particular shopping attempt to make a decision, to complete a transaction, or to possess the<br />
desired product from the retailer.<br />
Consumer decision-making is significantly influenced by both the speed and ease with<br />
which consumers can make contact with retail outlets. Traditional retailers may improve access<br />
convenience by operating from a location that is easy to get to, near to most consumers, and near<br />
to other frequently visited stores (Seiders, Berry, and Gresham 2000). Online retailers are<br />
particularly suited for access convenience, as it provides the opportunity for consumers to shop<br />
257
at home 24 hr/7 days a week (Hofacker 2001). Morganosky and Cude (2000) found that the<br />
main reason consumers choose to purchase groceries online is that it eliminates travel time to<br />
and from the store.<br />
Although it is an important aspect of retail convenience, providing access convenience<br />
alone will not necessarily lead to sales. A virtual or physical store may be easy to access, but at<br />
the same time slow or difficult to use (Seiders, Berry, and Gresham 2000). In order to facilitate<br />
the decision-making process, the retailer must also provide the information necessary for the<br />
consumer to make the best purchase decision.<br />
Search convenience. After access convenience reduces the time and effort necessary to<br />
reach a retailer, search convenience then eases consumers through the shopping process by<br />
helping them make their purchase decision. Search convenience is “the speed and ease with<br />
which consumers identify and select products they wish to buy” (Seiders, Berry, and Gresham<br />
2000, p. 83), and includes effective interactive customer systems, store design and layout,<br />
product displays, store signage, and knowledgeable salespeople.<br />
Search convenience is extremely important for retailers operating virtual stores. One of<br />
the greatest consumer benefits of shopping online is the advanced search capability and the ease<br />
with which consumers can locate product information (Hof 2001; Shop.org 2001; Burke 2002).<br />
Wolfinbarger and Gilly (2001, p. 35) support this by stating that the “the online medium<br />
facilitates utilitarian behavior as search costs for product information are dramatically reduced.”<br />
Thus, shopping on the Internet facilitates search convenience.<br />
Possession convenience. Seiders, Berry, and Gresham (2000, p. 85) define possession<br />
convenience as “the speed and ease with which consumers can obtain desired products.”<br />
Included within the domain of possession convenience are in-stock merchandise, timely<br />
production, and timely delivery of merchandise. One of the main reasons why consumers<br />
258
choose traditional stores over virtual stores is the ability to actually leave the store with the<br />
desired product. Online shoppers must wait for their order to be processed and then wait for<br />
delivery to their home or office. For consumers shopping online, low possession convenience<br />
may be seen as a cost rather than a benefit.<br />
Transaction convenience. Transaction convenience is defined as “the speed and ease<br />
with which consumers can effect or amend transactions” (Seiders, Berry, and Gresham 2000, p.<br />
86) and includes the checkout process as well as the return process. Hence, transaction<br />
convenience addresses the ease of doing business with a retailer during and/or after the act of<br />
purchase. One benefit of online shopping is that consumers never have to wait in line at virtual<br />
stores, thus enhancing transaction convenience (Wolfinbarger and Gilly 2001). Traditional<br />
stores as well as virtual stores with quick checkouts and easy return policies also rank high in<br />
transaction convenience.<br />
The four dimensions of retail convenience share a common element - they each save the<br />
consumer time and effort in a unique way. Whether shopping online or in a physical store,<br />
consumers seek these various convenience dimensions to reduce time and effort costs associated<br />
with consumer decision-making. The next section addresses the different models of retail<br />
convenience for each shopping format.<br />
A Model of Retail Convenience for In-Store and Online Shoppers<br />
Consumers often cite convenience as a major benefit of shopping online (Szymanski and<br />
Hise 2000; Hoffman 2000; Childers, Carr, Peck, and Carson 2001; Wolfinbarger and Gilly<br />
2001). We argue that a consumer’s preference for a specific type of convenience influences his<br />
or her preference for a particular shopping format - either online or at a traditional store. Figure<br />
1 contains the hypothesized models to be tested in this study.<br />
--------------------------------<br />
259
Figure 1 about here<br />
--------------------------------<br />
As the dimensions of convenience have only begun to be examined empirically, the first<br />
hypothesis relates to the different structures of retail convenience for in-store and online<br />
shoppers. We concur with Seiders, Berry, and Gresham (2000) that there exists four distinct<br />
dimensions of retail convenience. For traditional in-store shoppers, we feel an additional<br />
dimension of convenience should be considered. Hoffman (2000) found that in-store shoppers<br />
consider it convenient to ask for and receive assistance from a salesperson in making a purchase,<br />
especially if the consumer lacks the necessary information to complete the purchase himself.<br />
Particularly for purchases that require extensive problem solving, if the consumer lacks the<br />
necessary information, he will seek that information from expert problem solvers like<br />
knowledgeable salespeople (Dunn, Thomas, and Lubawski 1981; Hoffman 2000). Thus,<br />
“assisted search,” defined as the speed and ease with which consumers identify and select<br />
products they wish to buy due to assistance from a salesperson, is an additional convenience<br />
dimension applicable to traditional retailers. It is not appropriate, however, to consider search<br />
features on a retailer’s website as assistance in the same manner in which it takes place at a<br />
physical store. It is the knowledge, training, and advice from a human salesperson that may<br />
provide convenience in a way that a virtual store cannot. Thus, the following is hypothesized:<br />
H1a: For traditional in-store shoppers, retail convenience is a multidimensional<br />
construct containing five distinct dimensions: access, search, assisted search,<br />
transaction, and possession.<br />
H1b: For online shoppers, retail convenience is a multidimensional construct<br />
containing four distinct dimensions: access, search, transaction, and possession.<br />
In addition to testing the multidimensional nature of retail convenience, we also<br />
hypothesize about the relationship of these dimensions to in-store and online shoppers. As<br />
previously stated, the dimension of access convenience is defined as “the speed and ease with<br />
260
which consumers can reach a retailer” (Seiders, Berry, and Gresham 2000, p. 81). Consumers<br />
who frequently shop at online retail stores do so because they can shop from the comfort of their<br />
homes and at any time of the day or night. The ability to reach the retailer at a time most<br />
convenient to the consumer (access convenience) is certainly a benefit of online shopping.<br />
Compared to shopping at traditional locations, shopping online saves the consumer travel time to<br />
the location, time spent parking, and time spent traveling from the parking lot to the store<br />
(Bhatnagar, Misra, and Rao 2000). With traditional locations, however, customers are required<br />
to adjust their preferred shopping time to fit within the retailer’s hours of operation.<br />
The concept of cost-benefit analysis (Prest and Turvey 1965) may be used to explain why<br />
consumers who shop online benefit most from access convenience. Online shoppers believe that<br />
the benefit of time saved by being able to access retail outlets from the comfort of their home or<br />
office at anytime of the day or night far outweighs the costs of delayed merchandise possession<br />
and the risks associated with shopping online (Wolfinbarger and Gilly 2001; Morganosky and<br />
Cude 2000). In-store shoppers receive the benefit of immediate possession of their purchases at<br />
the sacrifice of convenient store access. Formally stated:<br />
H2: Online shoppers realize the benefit of access convenience more than<br />
traditional in-store shoppers do.<br />
Consumers who <strong>value</strong> search convenience do so because of reduced time spent looking for<br />
a particular product and finalizing their product decision. Online shoppers are more likely to<br />
realize the benefit of search convenience than in-store shoppers, simply because they are able to<br />
compare product and pricing information without having to leave home. Benefits falling within<br />
the dimension of search convenience include site design (Szymanski and Hise 2000), navigation<br />
(Childers, Carr, Peck, and Carson 2001), and selection and availability of product information<br />
(Wolfinbarger and Gilly 2001). Many consumers who choose to shop online do so because of<br />
261
the organization and design of the website and the ease of navigation. E-tailers having a user-<br />
friendly site design facilitate search convenience as consumers arriving at such a site can easily<br />
find exactly what they are looking for. Also considered in the dimension of search convenience<br />
is the product selection offered by the retailer. A virtual retailer is not limited by shelf space like<br />
a traditional retailer; therefore, they are usually able to offer a wider selection of products. The<br />
ease and speed with which the consumer can find exactly what he or she wants is key. The final<br />
benefit classified under search convenience is the availability of product information. How<br />
much information is available directly from the e-tailer’s virtual store? Do they supply<br />
comparisons to similar products offered by competing e-tailers? This is also important as many<br />
consumers turn to the Internet specifically for their information search. To conduct as extensive<br />
a search via traditional retailers would consume considerable amounts of time and effort. This<br />
leads to hypothesis 3:<br />
H3: Online shoppers realize the benefit of search convenience more than<br />
traditional in-store shoppers do.<br />
Customers seeking possession convenience prefer to save the time associated with actually<br />
obtaining the desired product (Seiders, Berry, and Gresham 2000). These consumers would<br />
rather spend time on other aspects of their shopping experience (e.g., getting to the store’s<br />
location and physically moving through the store to find exactly what they want) in exchange for<br />
not having to wait on parcel delivery to have their desired purchase in their possession.<br />
Applying cost-benefit analysis to this situation (Prest and Turvey 1965), consumers valuing<br />
possession convenience prefer to shop at traditional brick-and-mortar stores because the benefit<br />
of having the desired product in their hands at the end of the shopping trip outweighs the costs<br />
associated with traveling to the physical location and physically searching through the store’s<br />
shelves to find exactly what they want. In other words, they do not mind putting in extra<br />
262
shopping time as long as the desired product is in their possession immediately as a result of the<br />
shopping trip. Hypothesis 4 states the following:<br />
Construct Measurement<br />
H4: Traditional in-store shoppers realize the benefit of possession convenience<br />
more than online shoppers do.<br />
Research Method<br />
In order to measure the different dimensions of convenience, appropriate scale<br />
development procedures were followed (Churchill 1979; DeVellis 1991; Spector 1992). An<br />
initial survey containing several open-ended questions was administered to 196 students enrolled<br />
in upper-level marketing courses at a major Southeastern university. Questions such as “Please<br />
describe below what the word ‘convenience’ means to you” and “Describe as specifically as<br />
possible what your ideal convenient shopping experience would be like” were asked in order to<br />
develop the most appropriate phrases to capture each dimension of retail convenience. Many<br />
items were developed for each dimension, then 14 expert judges were asked to select the items<br />
that most closely matched the definitions of each dimension. A pretest was then conducted in<br />
order to improve/clarify question wording and instructions. These pretest surveys were given to<br />
a sample of seventy-five upper-level undergraduate marketing students to determine the<br />
necessary modifications. This process resulted in slightly different item wordings for in-store<br />
and online shoppers. Table 2 contains the final set of items for each convenience dimension.<br />
Sampling Procedure<br />
--------------------------------<br />
Table 2 about here<br />
--------------------------------<br />
The final survey version was administered to a convenience sample consisting of both<br />
students and non-students. Marketing students enrolled in upper-level undergraduate consumer<br />
263
ehavior courses participated as both respondents and recruiters. Each student was asked to<br />
complete the survey and to recruit one other non-student to also complete the survey. Non-<br />
student names and phone numbers were collected and randomly checked to ensure authenticity.<br />
This process resulted in 308 total usable surveys (45% male, mean age 30); 241 completed their<br />
last major purchase in a traditional store, while 67 completed their last major purchase online.<br />
When answering the questions related to retail convenience, respondents were asked to<br />
think about their most recent major purchase. This was done to increase the chance that<br />
respondents would remember their purchase in as much detail as possible. Those respondents<br />
who made their most recent major purchase in a traditional store were directed to the scale items<br />
for in-store shopping, while those respondents who completed their most recent major purchase<br />
online were directed to the “online shopping” section of the survey.<br />
Statistical Technique<br />
Several statistical techniques were used to analyze the data. In order to test Hypothesis 1,<br />
statistics typically used in scale development were employed, including Cronbach’s alpha,<br />
principal components analysis, and confirmatory factor analysis using LISREL 8.3 for Windows.<br />
In order to test Hypotheses 2 through 4, analysis of variance was used to compare scale means of<br />
access, search, and possession convenience for in-store and online shoppers.<br />
Results<br />
In order to test Hypothesis 1, statistical procedures commonly used in scale development<br />
were employed. Reliabilities for each dimension of retail convenience were calculated using<br />
Cronbach’s alpha. Principal components analysis with varimax rotation was also undertaken in<br />
order to determine if five distinct dimensions were present for in-store shoppers, and four<br />
distinct dimensions were present for online shoppers. A more stringent confirmatory factor<br />
264
analysis using LISREL 8.3 for Windows was also undertaken in order to assess convergent and<br />
discriminant validity. Results for in-store shoppers are presented in Table 3, while results for<br />
online shoppers are presented in Table 4. Correlation matrices, means, and standard deviations<br />
of the scale items are provided for in-store shoppers in Table 5 and online shoppers in Table 6.<br />
--------------------------------<br />
Table 3 about here<br />
--------------------------------<br />
--------------------------------<br />
Table 4 about here<br />
--------------------------------<br />
--------------------------------<br />
Table 5 about here<br />
--------------------------------<br />
--------------------------------<br />
Table 6 about here<br />
--------------------------------<br />
Since all of the items within each dimension of retail convenience are reflective of their<br />
appropriate definitions, Cronbach’s alpha was used in order to examine the reliability of each<br />
dimension. As can be seen in the tables, these reliabilities were quite high, ranging from 0.7649<br />
to 0.9722. The dimensions of online retail convenience performed particularly well, as all were<br />
above the 0.9 level.<br />
For in-store shoppers, five dimensions of retail convenience were hypothesized to exist,<br />
while four dimensions of online retail convenience were hypothesized. In order to more<br />
carefully examine the dimensionality of these constructs, principal components analysis with<br />
varimax rotation was undertaken for each group separately. For in-store shoppers, five<br />
components with eigen<strong>value</strong>s greater than one were extracted from the data. Together, these five<br />
components explain 77.9% of the total variance. For online shoppers, four components with<br />
eigen<strong>value</strong>s greater than one were extracted; together, they explain 84.4% of the total variance.<br />
Thus, there is strong evidence in support of Hypothesis 1; the dimensionality of retail<br />
265
convenience is different for the two different types of shopping formats. Evidence of<br />
discriminant validity is provided by the fact that these items did not want to load on other<br />
components with which they were not supposed to be associated. Further, evidence of<br />
convergent validity is provided by the high loadings of each item on their respective component.<br />
A more rigorous examination of the validity of these scales was conducted with<br />
confirmatory factor analysis using LISREL 8.3 for Windows. As can be seen in Tables 3 and 4,<br />
the statistically significant λ x parameter estimates provide evidence of convergent validity.<br />
Additionally, the majority of the squared multiple correlations (SMCs), defined as the percentage<br />
of variance in each item that is explained by the latent construct of interest, are above 50%,<br />
indicating that each item performed well in capturing its construct of interest.<br />
Modification indices associated with λ x and Θ δ reveal some problems with discriminant<br />
validity. Specifically, there were seven modification indices in the λ x matrix for in-store<br />
shoppers, indicating that items search2, help3, possess1, and possess2 wanted to be associated<br />
with other dimensions of convenience. Additionally, there were 13 modification indices in Θ δ<br />
that indicate some error terms wanted to correlate. These changes were not incorporated in the<br />
model, as theoretically it does not make sense to do so. These problematic modification indices<br />
explain the poor overall fit: chi-square=498.08, 198 df, p=0.00; RMSEA=0.08; RMR=0.06;<br />
GFI=0.85.<br />
Problematic modification indices also surfaced in the measurement model for online<br />
shoppers. Three items (access2, possess2, and possess4) wanted to be associated with other<br />
constructs, while 6 error terms wanted to correlate. Again, these changes were not implemented,<br />
resulting in poor overall model fit: chi-square=206.34, 97 df, p=0.00; RMSEA=0.13;<br />
RMR=0.09; GFI=0.71. The overall fit does substantially improve if paths are freed as suggested<br />
by the modification indices. Therefore, confirmatory factor analysis results are mixed; there is<br />
266
strong evidence of reliability and convergent validity, but discriminant validity must be<br />
improved in further scale refinement attempts.<br />
For Hypotheses 2 through 4, analysis of variance (ANOVA) was performed in order to<br />
compare the mean scale scores for online and in-store shoppers. Hypothesis 2 states that online<br />
shoppers benefit more from access convenience than in-store shoppers. A comparison of scale<br />
means for these two groups yields an F statistic of 37.59 (p=0.000). Access convenience is more<br />
beneficial for online shoppers (scale mean=6.55) than in-store shoppers (scale mean=5.65),<br />
providing evidence of support for H2. Hypothesis 3 states that online shoppers benefit more<br />
from search convenience than do in-store shoppers; ANOVA here produces an F statistic of 8.57<br />
(p=0.004). The scale mean of 5.88 for in-store shoppers is significantly less than the scale mean<br />
of 6.26 for online shoppers; thus, there is evidence of support for H3. Finally, hypothesis 4<br />
predicts that in-store shoppers benefit from possession convenience more than online shoppers.<br />
The F statistic from this ANOVA is significant (F=11.07, p=0.001); however, the scale means<br />
indicate that the reverse is true. The possession scale mean for in-store shoppers is 5.60, while<br />
the scale mean for online shoppers is 6.23. This finding is quite counter-intuitive; possible<br />
reasons for this result are provided in the next section.<br />
Discussion<br />
This study provides an important contribution to the marketing convenience literature<br />
because it is the first of its kind to utilize the different dimensions of retail convenience to better<br />
understand customer needs. The support for Hypothesis 1 suggests that the dimensions of<br />
convenience are different for the two different types of shopping formats. The expansion of<br />
Seiders, Berry, and Gresham’s (2000) four dimensions of retail convenience to include “assisted<br />
search” is warranted. The five-component solution resulting from the principal components<br />
analysis is evidence of the existence of this newly proposed dimension. Further work in this area<br />
267
should seek to establish a similar convenience dimension for online shoppers. Technological<br />
capabilities that allow customers to experience “live help” or to receive recommendations based<br />
on what he has in his shopping bag may be considered a different type of “assisted help” than<br />
what is provided in a traditional store. It may be difficult, however, to obtain a large enough<br />
sample of online shoppers who regularly use these convenience-oriented features.<br />
The scale items crafted to measure the different dimensions of retail convenience possess<br />
high reliability levels and strong evidence of convergent validity as shown by Cronbach’s alpha<br />
and statistically significant λ x parameter estimates respectively. A more stringent confirmatory<br />
factor analysis using structural equation modeling reveals problems with discriminant validity, as<br />
evidenced by large λ x and Θ δ modification indices. Some scale items want to be associated with<br />
constructs that they are not supposed to be associated with. In addition, some error terms want<br />
to correlate with other error terms. This means that insufficient evidence exists to suggest that<br />
the dimensions of retail convenience are in fact different dimensions. Further studies must be<br />
undertaken to ensure that the dimensions of access, search, assisted search, transaction, and<br />
possession convenience are all distinct dimensions of convenience.<br />
The support of Hypothesis 2 suggests that online shoppers do benefit from access<br />
convenience more than traditional in-store shoppers do. One implication of this finding is that<br />
when given a choice between the two retail formats (online shopping or traditional in-store<br />
shopping) customers who <strong>value</strong> access convenience above all other types of convenience will<br />
often choose to shop online. Hypothesis 3 (that online shoppers benefit from search convenience<br />
more than traditional in-store shoppers) is also supported. When given a choice between the two<br />
retail formats, customers who <strong>value</strong> search convenience above all other types of convenience<br />
will also choose to shop online.<br />
268
From a marketing standpoint, the results of Hypothesis 2 and 3 suggest that retailers should<br />
try to better understand their customers; specifically, they should try to find out what type of<br />
convenience their customers want. It is possible that customers may <strong>value</strong> multiple convenience<br />
dimensions. For example, a customer may <strong>value</strong> both search convenience and possession<br />
convenience. One way to better satisfy this customer is to offer multiple channel outlets<br />
(maintain both a traditional brick-and-mortar store and an online store). By having multiple<br />
channel outlets, the retailer facilitates both search convenience and possession convenience. In<br />
other words, the customer can use the online store for his information search, then go to the<br />
traditional store and leave with his desired purchase. Offering multiple channels to reach<br />
customers offers ultimate convenience.<br />
Upon further review of hypothesis 4, the seemingly counter-intuitive results can be easily<br />
explained. It is true that online shoppers must wait longer for their purchases than in-store<br />
shoppers. But a post hoc examination of the item wordings that measured possession<br />
convenience for online shoppers reveals that this wait was not adequately captured. Instead, we<br />
asked if the order was delivered in a timely fashion. This captures <strong>satisfaction</strong> with possession,<br />
rather than how conveniently the possession actually took place. In subsequent scale refinement<br />
attempts, possession convenience might be captured more precisely if an objective measure was<br />
used. Suppose the question was worded, “How long did it take for you to receive the product(s)<br />
you ordered?” An in-store shopper would answer “zero” (the most convenient possession), and<br />
the longer one had to wait for his online order, the less convenient his possession would be.<br />
Conclusion<br />
This study is an initial attempt to delineate the different retail convenience dimensions<br />
for in-store and online shoppers. Several limitations must be mentioned. A convenience sample<br />
was used, and the respondents were all concentrated in one geographical area. Additionally, we<br />
269
obtained a small sample size of online shoppers. Scale refinement will greatly benefit from a<br />
national sample with equally large numbers of in-store and online shoppers.<br />
As mentioned above, future research should aim to establish discriminant validity of the<br />
convenience scales. Additional comparisons of in-store and online shoppers are also warranted.<br />
Future studies should investigate the time and effort expenditures for these two groups as well as<br />
examine possible antecedents to convenience-seeking behaviors. Constructs such as time<br />
pressure and shopping orientation may lead consumers to seek different types of convenience.<br />
Retailers would greatly benefit from such an understanding of their customers’ needs and<br />
motivations.<br />
270
References<br />
Anderson Jr. WT. Convenience orientation and consumption behavior. Journal of Retailing<br />
1972;48(3):49-72.<br />
Berry LL. The time-buying consumer. Journal of Retailing 1979;55(4):58-69.<br />
Berry LL, Seiders K, Grewal D. Understanding service convenience. Journal of Marketing<br />
2002;66(3):1-17.<br />
Berry LL. The old pillars of new retailing. Harvard Business Review 2001;79(4):131-137.<br />
Bettman JR, Johnson EJ, Payne JW. A componential analysis of cognitive effort in choice.<br />
Organizational Behavior and Human Decision Processes 1990;45(February):111-139.<br />
Bhatnagar A, Misra S, Rao HR. On risk, convenience, and Internet shopping behavior.<br />
Communications of the ACM 2000;43(11):98-110.<br />
Brown LG. The strategic and tactical implications of convenience in consumer product<br />
marketing. Journal of Consumer Marketing 1989;6(3):13-19.<br />
Brown LG. Convenience in services marketing. Journal of Services Marketing 1990;4(1):53-<br />
59.<br />
Bucklin LP. Retail strategy and the classification of consumer goods. Journal of Marketing<br />
1963;27(1):50-55.<br />
Burke RR. Technology and the customer interface: what consumers want in the physical and<br />
virtual store. Journal of the Academy of Marketing Science 2002;30(4):411-432.<br />
Childers T L, Carr CL, Peck J, Carson S. Hedonic and utilitarian motivations for online retail<br />
shopping behavior. Journal of Retailing 2001;77(4):511-535.<br />
Churchill GA. A paradigm for developing better measures of marketing constructs. Journal of<br />
Marketing Research 1979;16(1):64-73.<br />
Copeland MT. Relation of consumers’ buying habits to marketing methods. Harvard Business<br />
Review 1923;1(3):282-289.<br />
Crist B. Myths about convenience food costs. Journal of Marketing 1960;24(4):49-55.<br />
Darian JC, Cohen J. Segmenting by consumer time shortage. Journal of Consumer Marketing<br />
1995;12(1):32-44.<br />
DeVellis RF. Scale development: theory and applications (Applied Social Research Methods<br />
Series, Vol. 26). Newbury Park: Sage Publications, 1991.<br />
271
Dunn DT, Thomas CA, Lubawski JL. Pitfalls of consultative selling. Business Horizons<br />
1981;24(5):59-65.<br />
Enis BM, Roering KJ. Product classification taxonomies: synthesis and consumer implications.<br />
In: Theoretical developments in marketing. Chicago: American Marketing Association,<br />
1980. p. 186-189.<br />
Etgar, M. The household as a production unit. In: Sheth JN, editor. Research in marketing, vol.<br />
1. Greenwich, CT: JAI Press, 1978. p. 79-98.<br />
Foote NN. The Image of the Consumer in the Year 2000. Proceedings, Thirty-fifth Annual<br />
Boston Conference on Distribution 1963, 13-18.<br />
Forster J. Hungry for convenience. Business Week (1/14/2002); Issue 3765: 120.<br />
Gardner EH. Consumer goods classification. Journal of Marketing 1945;9(3):275-276.<br />
Green H. Happy holidays – for e-tailers, at least. Business Week (11/11/02); Issue 3807:44-45.<br />
Gross BL. Time scarcity: interdisciplinary perspectives and implications for consumer behavior.<br />
In: Sheth JN, Hirschman EC, editors. Research in consumer behavior. Greenwich, CT:<br />
JAI Press, 1987. p. 1-54.<br />
Hof RD. Don’t cut back now. Business Week (10/1/2001); Issue 3751:EB34.<br />
Hofacker CF. Internet Marketing, 3 rd ed. New York: John Wiley & Sons, Inc., 2001.<br />
Hoffman NP. May I help you?: customer intimacy versus customer empowerment in a retail context.<br />
Presented at the Third Annual Retail Strategy and Consumer Decision Research Seminar 2000,<br />
Orlando, FL, November.<br />
Holbrook MB, Howard JA. Frequently purchased nondurable goods and services. In: Ferber R,<br />
editor. Selected aspects of consumer behavior: a summary from the perspective of<br />
different disciplines. Washington D.C.: National Science Foundation, Directorate for<br />
Research Applications, Research Applied to National Needs, 1977. p. 189-222.<br />
Jacoby J, Szybillo GJ, Berning CK. Time and consumer behavior: an interdisciplinary overview.<br />
Journal of Consumer Research 1976;2(4):320-339.<br />
Kaish S. Cognitive dissonance and the classification of consumer goods. Journal of Marketing<br />
1967;31(4):28-31.<br />
Kaufman-Scarborough C. , Lindquist JD. E-shopping in a multiple channel environment.<br />
Journal of Consumer Marketing 2002; 19(4):333-350.<br />
272
Kelley EJ. The importance of convenience in consumer purchasing. Journal of Marketing<br />
1958;23(1):32-38.<br />
Kotler P, Zaltman G. Social marketing: an approach to planned social change. Journal of<br />
Marketing 1971;35(3):3-12.<br />
Lovelock CH. Classifying services to gain strategic marketing insights. Journal of Marketing<br />
1983;47(3):9-20.<br />
Morganosky MA, Cude BF. Consumer response to online grocery shopping. International<br />
Journal of Retail and Distribution Management 2000;28(1):17-26.<br />
Murphy PE, Enis BM. Classifying products strategically. Journal of Marketing 1986;50(3):24-<br />
42.<br />
Prest AR, Turvey R. Cost-benefit analysis: a survey. Economic Journal 1965;75(300):683-735.<br />
Reilly MD. Working wives and convenience consumption. Journal of Consumer Research<br />
1982;8(4):407-418.<br />
Seiders K, Berry LL, Gresham LG. Attention, retailers! How convenient is your convenience<br />
strategy? Sloan Management Review 2000;41(3):79-89.<br />
Seiders K, Voss GB, Grewal D, Godfrey AL. Customer evaluation of service convenience: an<br />
empirical investigation. Proceedings, American Marketing Association Winter<br />
Educators’ Conference, (Winter 2003), 163-164.<br />
Shop.org. The multi-channel retail report 2001. Washington D.C.: National Retail Federation,<br />
2001.<br />
Spector, PE. Summated Rating Scale Construction: An Introduction. Newbury Park: Sage<br />
Publications, 1992.<br />
Szymanski DM, Hise RT. E-<strong>satisfaction</strong>: an initial examination. Journal of Retailing<br />
2000;76(3):309-322.<br />
Wolfinbarger M, Gilly MC. Shopping online for freedom, control, and fun. California<br />
Management Review 2001;43(2):34-55.<br />
Youngdahl WE, Kellog DL. The relationship between service customers’ quality assurance<br />
behaviors, <strong>satisfaction</strong>, and effort: a cost of quality perspective. Journal of Operations<br />
Management 1997;15(1):19-32.<br />
273
Table 1<br />
Dimensions of Convenience<br />
General Convenience Definition<br />
(Brown 1989, 1990)<br />
1. Time Products/services may be provided at a time that is most<br />
convenient for the customer<br />
2. Place Products/services may be provided in a place that is more<br />
convenient for the customer<br />
3. Acquisition Firms may make it easier for the customer, financially and<br />
otherwise, to purchase their products/services<br />
4. Use Products/services may be made more convenient for the<br />
customer to use<br />
5. Execution Perhaps the most obvious convenience is simply having some<br />
one else provide the product/service for the consumer<br />
Service Convenience (Berry,<br />
Seiders, and Grewal 2002)<br />
1. Access convenience Involves consumers’ perceived time and effort expenditures to<br />
initiate service delivery<br />
2. Decision convenience Involves consumers’ perceived time and effort expenditures to<br />
make service purchase or use decisions<br />
3. Transaction convenience Involves consumers’ perceived expenditures of time and effort<br />
to effect a transaction<br />
4. Benefit convenience Involves consumers’ perceived time and effort expenditures to<br />
experience the service’s core benefits<br />
5. Post-benefit convenience Involves consumers’ perceived time and effort expenditures<br />
when reinitiating contact with a firm after the benefit stage of<br />
the service<br />
Retail Convenience (Seiders,<br />
Berry, and Gresham 2000)<br />
1. Access convenience The speed and ease with which consumers can reach a retailer<br />
2. Search convenience The speed and ease with which consumers can identify and<br />
select products they wish to buy<br />
3. Transaction convenience The speed and ease with which consumers can effect or amend<br />
transactions<br />
4. Possession convenience The speed and ease with which consumers can obtain desired<br />
products<br />
274
Dimension Items for In-Store Shoppers 1<br />
Table 2<br />
Scale Items Measuring Retail Convenience<br />
Items for Online Shoppers 1<br />
Access 1. The store was easy to get to. 1. The website was easy to find.<br />
2. The store had convenient hours. 2. I could order any time I wanted.<br />
3. Parking was reasonably available. 3. I could order from remote locations<br />
4. I was able to get to the store’s location<br />
quickly.<br />
(e.g., home, work, etc.)<br />
4. I was able to find the website quickly.<br />
Search 1. The store was well-organized. 1. The website was well-organized.<br />
2. I could easily find what I was looking 2. It was easy to find what I was looking<br />
for.<br />
for.<br />
3. The store was neat. 3. It was easy to navigate the website.<br />
4. The store was clean. 4. The website provided useful<br />
information.<br />
5. It was easy to get the information I<br />
needed to make my purchase decision.<br />
Help with Search 1. A salesperson was readily available to<br />
help me.<br />
2. The salesperson offered good advice.<br />
3. The salesperson helped me find exactly<br />
what I was looking for.<br />
4. The salesperson was knowledgeable.<br />
5. The salesperson gave me useful<br />
information.<br />
6. I thought the salesperson was welltrained.<br />
Transaction 1. The store has a fast checkout. 1. The checkout process was fast.<br />
2. My purchase was completed easily. 2. My purchase was completed easily.<br />
3. I was able to complete my purchase 3. It didn’t take a long time to complete<br />
quickly.<br />
4. I didn’t have to wait to pay.<br />
5. It didn’t take a long time to complete<br />
the purchase process.<br />
the purchase process.<br />
Possession 1. I got exactly what I wanted. 1. I got exactly what I wanted.<br />
2. It took a minimal amount of effort on 2. It took a minimal amount of effort on<br />
my part to get what I wanted.<br />
my part to get what I wanted.<br />
3. I got what I wanted when I wanted it. 3. My order was delivered in a timely<br />
fashion.<br />
4. I was properly notified of my order<br />
status.<br />
1All items were measured on a 7-point scale anchored by Strongly Agree and Strongly Disagree.<br />
275
Table 3<br />
Retail Convenience Scale Results for In-Store Shoppers<br />
Dimensio<br />
n<br />
Alpha Component CFA Results<br />
1 2 3 4 5 λx estimate t-<strong>value</strong> SMC<br />
Access1 0.7759 0.87<br />
7<br />
0.89 16.56 0.80<br />
Access2 .077<br />
1<br />
0.73 12.48 0.53<br />
Access3 .063<br />
1<br />
0.57 9.26 0.33<br />
Access4 0.85<br />
7<br />
0.79 13.95 0.62<br />
Search1 0.8860 0.72<br />
6<br />
Search2 0.62<br />
2<br />
Search3 0.85<br />
8<br />
Search4 0.82<br />
6<br />
Help1 0.9503 0.77<br />
3<br />
Help2 0.88<br />
1<br />
Help3 0.79<br />
9<br />
Help4 0.92<br />
3<br />
Help5 0.90<br />
5<br />
Help6 0.87<br />
1<br />
Transact1 0.9609 0.88<br />
5<br />
Transact2 0.88<br />
7<br />
Transact3 0.92<br />
1<br />
Transact4 0.87<br />
0<br />
Transact5 0.92<br />
3<br />
0.84 15.27 0.71<br />
0.76 13.28 0.58<br />
0.78 13.62 0.61<br />
0.73 12.43 0.53<br />
0.75 13.74 0.56<br />
0.90 18.15 0.81<br />
0.84 16.26 0.71<br />
0.94 19.71 0.89<br />
0.94 19.45 0.88<br />
0.88 17.33 0.77<br />
0.87 17.24 0.76<br />
0.95 20.05 0.90<br />
0.98 21.07 0.95<br />
0.84 16.27 0.70<br />
0.95 20.19 .091<br />
Possess1 0.7649 0.761 0.76 12.39 0.57<br />
Possess2 0.663 0.67 10.74 0.45<br />
Possess3 0.778 0.72 11.63 0.52<br />
n=241<br />
276
Dimensio<br />
n<br />
Table 4<br />
Retail Convenience Scale Results for Online Shoppers<br />
Alpha Component CFA Results<br />
1 2 3 4 λx estimate t-<strong>value</strong> SMC<br />
Access1 0.9298 0.866 0.86 8.26 0.73<br />
Access2 0.735 0.81 7.65 0.66<br />
Access3 0.852 0.93 9.59 0.87<br />
Access4 0.903 0.92 9.34 0.85<br />
Search1 0.9033 0.537 0.86 8.31 0.75<br />
Search2 0.508 0.87 8.46 0.76<br />
Search3 0.738 0.88 8.65 0.78<br />
Search4 0.866 0.66 5.61 0.43<br />
Search5 0.850 0.65 5.55 0.42<br />
Transact1 0.9722 0.921 0.96 10.22 0.93<br />
Transact2 0.914 0.97 10.35 0.94<br />
Transact3 0.918 0.95 10.04 0.91<br />
Possess1 0.9110 0.800 0.85 8.12 0.73<br />
Possess2 0.669 0.83 7.80 0.69<br />
Possess3 0.845 0.87 8.45 0.76<br />
Possess4 0.897 0.84 7.98 0.71<br />
n=67<br />
277
Table 5<br />
Correlations, Means, and Standard Deviations of Scale Items for In-store Shoppers<br />
Item A1 A2 A3 A4 S1 S2 S3 S4 H1 H2 H3 H4 H5 H6 T1 T2 T3 T4 T5 P1 P2 P3<br />
Acc1 1<br />
Acc2 .63 1<br />
Acc3 .49 .50 1<br />
Acc4 .73 .54 .40 1<br />
Sear1 .37 .41 .40 .31 1<br />
Sear2 .26 .29 .25 .21 .63 1<br />
Sear3 .23 .32 .30 .16 .67 .60 1<br />
Sear4 .27 .35 .34 .21 .63 .53 .80 1<br />
Help1 .20 .12 .10 .18 .38 .38 .38 .33 1<br />
Help2 .17 .14 .06 .10 .39 .41 .39 .35 .70 1<br />
Help3 .18 .17 .12 .11 .41 .48 .42 .37 .68 .81 1<br />
Help4 .19 .17 .07 .10 .40 .38 .38 .38 .70 .83 .78 1<br />
Help5 .18 .15 .07 .08 .35 .36 .39 .37 .66 .85 .75 .90 1<br />
Help6 .15 .11 .06 .14 .36 .40 .41 .38 .69 .76 .72 .84 .82 1<br />
Tran1 .21 .28 .23 .12 .37 .33 .22 .31 .25 .31 .35 .27 .26 .22 1<br />
Tran2 .21 .24 .22 .13 .33 .43 .33 .34 .29 .34 .42 .31 .29 .32 .83 1<br />
Tran3 .18 .22 .23 .11 .32 .42 .32 .32 .26 .31 .39 .27 .27 .27 .84 .93 1<br />
Tran4 .12 .12 .22 .03 .31 .38 .26 .36 .27 .28 .35 .28 .23 .25 .79 .77 .81 1<br />
Tran5 .18 .20 .17 .10 .29 .41 .30 .29 .26 .32 .39 .28 .25 .25 .83 .90 .93 .82 1<br />
Pos1 .07 .10 .03 .05 .27 .39 .27 .22 .39 .46 .56 .42 .44 .43 .30 .41 .36 .30 .37 1<br />
Pos2 .27 .24 .20 .16 .35 .36 .31 .30 .23 .30 .34 .20 .25 .21 .41 .46 .49 .40 .46 .49 1<br />
Pos3 .21 .25 .16 .13 .35 .42 .32 .33 .33 .29 .39 .24 .30 .30 .32 .39 .37 .29 .32 .57 .47 1<br />
Mean 5.6 5.9 5.8 5.3 5.8 5.8 5.9 6.0 6.0 5.7 5.8 6.0 5.8 5.9 5.1 5.3 5.1 5.2 5.1 6.0 5.0 5.8<br />
SD 1.4 1.2 1.3 1.7 1.1 1.2 1.2 1.0 1.4 1.5 1.5 1.3 1.3 1.3 1.5 1.6 1.6 1.7 1.7 1.3 1.8 1.5<br />
n=241<br />
Table 6<br />
Correlations, Means, and Standard Deviations of Scale Items for Online Shoppers<br />
Item A1 A2 A3 A4 S1 S2 S3 S4 S5 T1 T2 T3 P1 P2 P3 P4<br />
Acc1 1<br />
Acc2 .64 1<br />
Acc3 .77 .79 1<br />
Acc4 .85 .72 .86 1<br />
Sear1 .56 .66 .62 .59 1<br />
Sear2 .51 .67 .67 .55 .76 1<br />
Sear3 .47 .66 .60 .52 .78 .74 1<br />
Sear4 .29 .51 .38 .37 .52 .51 .71 1<br />
Sear5 .29 .46 .33 .28 .48 .59 .67 .77 1<br />
Tran<br />
1<br />
.24 .53 .34 .33 .43 .58 .48 .38 .42 1<br />
Tran<br />
2<br />
.16 .48 .26 .21 .39 .55 .49 .46 .54 .93 1<br />
Tran .15 .42 .27 .22 .37 .50 .48 .43 .50 .92 .93 1<br />
3<br />
Pos1 .44 .45 .46 .42 .62 .65 .50 .30 .42 .54 .47 .43 1<br />
Pos2 .41 .63 .56 .48 .60 .66 .51 .41 .43 .61 .53 .55 .74 1<br />
Pos3 .47 .47 .59 .52 .51 .59 .49 .20 .19 .38 .29 .29 .71 .70 1<br />
Pos4 .41 .35 .51 .43 .53 .48 .41 .19 .16 .31 .24 .24 .72 .65 .81 1<br />
Mean 6.5 6.6 6.5 6.6 6.2 6.3 6.2 6.3 6.3 5.7 5.7 5.6 6.4 5.9 6.2 6.4<br />
278
SD .89 .70 .80 .82 .91 .98 .91 .85 .88 1.2 1.4 1.3 .80 1.2 1.2 1.1<br />
n=67<br />
279
Error!<br />
Figure 1<br />
Retail Convenience for In-Store and Online Shoppers<br />
In-Store Retail<br />
Convenience<br />
Access Search Assisted<br />
Search<br />
Transaction Possession<br />
Online Retail<br />
Convenience<br />
Access Search Transaction Possession<br />
280
What influences customer reaction to incompatibility? An empirical investigation<br />
Abstract<br />
This paper seeks to understand the factors that influence customer reaction<br />
to incompatible behavior of fellow customers in context of foodservice business.<br />
Based on extensive literature review, we develop hypotheses about the direction<br />
of relationship between controllable and uncontrollable psychological variables<br />
and individual reactions to incompatibility. Using experimental design technique<br />
we confirm these hypotheses. Mood, expectations, and perceived control over<br />
outcome were found to be three most important factors influencing the intensity<br />
of reaction towards incompatibility. Using Taguchi experimental design technique,<br />
we further develop optimal combination of alternate levels of controllable and<br />
uncontrollable design factors that minimize the negative impact of uncontrollable<br />
factors. Managerial implications of research are discussed.<br />
Introduction<br />
281
Customer-to-customer interaction is known to be an important aspect of<br />
overall service encounter as the behavior of fellow customers can impact overall<br />
<strong>satisfaction</strong> and possible future purchase intentions (Parker and Ward 2000,<br />
Bitner et al. 1997, Swinyard 1993). Customer <strong>satisfaction</strong> is a recursive process<br />
where <strong>satisfaction</strong>/dis<strong>satisfaction</strong> with a previous service encounter influences<br />
future patronage intentions. Four this process to work, consumers rely on some<br />
kind of recall from previous service experience. This recall tends to be biased in<br />
the direction of momentary emotions associated with the event being recalled<br />
(Machleit et al. 2000). Therefore the momentary emotions felt during service<br />
encounters such as negative response to incompatible behavior of fellow<br />
customers are likely to influence recall and future intention to purchase.<br />
In situations where customers have to share space and time, customer-to-<br />
customer contact -both verbal and non-verbal- is inevitable. It is also inevitable<br />
that customers will find themselves compatible with some customers and<br />
incompatible with others (Martin 1996, Martin and Partner 1989). In cases where<br />
incompatibility is experienced, the response is expected to vary among<br />
customers. Martin (1989 pp. 12) points out “some customers may view certain<br />
behaviors in particular service environments as intolerable, yet other customers<br />
may not be disturbed”. The reaction towards incompatible behavior of fellow<br />
customers can, therefore, be characterized as individual specific. Since the<br />
reaction to incompatibility can range from indifference to negative word of mouth<br />
(Martin 1989), It is important for marketers to understand the factors that<br />
moderate the intensity of this reaction.<br />
282
Management of in compatibility has traditionally been treated as an<br />
uncontrollable phenomenon that needs to be avoided rather than something that<br />
should be managed operationally. Some of the factors that are expected to<br />
moderate the intensity of reaction to incompatibility such as mood (Swinyard<br />
1993), involvement (Swinyard 1993), and personal <strong>value</strong>s (Schwartz 1992) are,<br />
unfortunately, beyond the control of marketing managers. That is, perhaps, the<br />
reason for emphasis on avoiding incompatibility through effective management of<br />
different customer segments. Articulation of a clear positioning statement which<br />
enables customers to self select businesses where they will feel comfortable in<br />
the company of their fellow customers is expected to help avoid incompatible<br />
situations.<br />
Complete avoidance of incompatibility will, however, require extreme<br />
segmentation which may not be a practical option for all businesses. It has been<br />
suggested that for most of the businesses to grow, they need to serve diverse<br />
groups of customers which show different levels of tolerance to incompatible<br />
behaviors (Martin 1996). Incompatibility, therefore, seems unavoidable. In<br />
addition to effective segmentation incompatibility also needs to be dealt at an<br />
operational level. Managers may use both on site solutions such as physical<br />
separation, enforcement of policies designed to control unacceptable behavior,<br />
and advance communication with customers about the possibility of encountering<br />
some undesirable behaviors.<br />
For an active management of incompatibility we need to accomplish two<br />
tasks. First, we need to identify the factors that influence the intensity of reaction<br />
towards undesirable public behaviors and understand their relative contributions.<br />
283
Second, we need to find out the optimal combination of controllable factors that<br />
would minimize the negative impact of uncontrollable factors. In marketing<br />
literature, there is an apparent lack of information on either of these issues. This<br />
article is an attempt to bridge this gap of information.<br />
Literature Review<br />
Research on the role of customers in service encounters has traditionally<br />
been limited to the study of interaction between customers and service<br />
employees. The influence of customer-to-customer interaction on service<br />
encounter quality, <strong>satisfaction</strong>, and future purchase intentions has largely been<br />
ignored in service marketing literature. This omission becomes clear when we<br />
look at prominent service quality measurement scales such as SERVEQUAL and<br />
SERVPREF which fail to capture the effect of customer-to-customer interaction.<br />
Although some of the researchers (Baker 1987) do discuss a social dimension of<br />
tangible quality that represents organization’s concern for the people in the<br />
environment such as customer, employees and non-customers, measurement<br />
researchers in general have failed to incorporate this concern in to existing<br />
service quality scales.<br />
Research in the area of customer-to-customer interactions can be<br />
grouped in into four categories i.e. identification and grouping of public behaviors,<br />
role adoption, impact of demographic and individual factors on reaction to<br />
incompatibility, and compatibility management. Grove ad Fisk (1997) and Martin<br />
(1996) developed categories of positive and negative public behaviors at<br />
business places. Grove and Fisk employed critical incidence technique to drive<br />
the dimensions while Martin used exploratory factor analysis to extract the same.<br />
284
A lot of commonalities can be found between seven factor solution by Martin and<br />
six categories presented by Grove and Fisk. In fact most of the Grove and Fisk’s<br />
six categories can easily be fitted into Martin’s seven factor solution. Since the<br />
tolerance for public behaviors is situation and individual specific (Martin 1996),<br />
the classification of public behavior can serve as a good basis for customer<br />
segmentation. This classification also alerts service managers to identify and<br />
control the negative public behaviors and encourage the positive behaviors.<br />
Research on roles fellow customers play is also very limited. Parker and<br />
Ward (2000), Bitner et. al. (1997), and McGrath and Otnes (1995), describe roles<br />
that customers may play in improving service experience of other customers.<br />
These studies identify two basic roles customers adopt when interacting with<br />
each other; help seeker and help provider. By identifying typical scripts<br />
associated with these roles, these studies stress the huge opportunities that<br />
service managers need to exploit by planning and encouraging interactions<br />
among customers.<br />
Research on the factors influencing customer perception of incompatibility<br />
is limited to two studies only. Martin and partner (1989) in an exploratory study<br />
propose that incompatibility can arise because of demographic, social and<br />
cultural differences. These differences may include different preferences,<br />
different purchase goals or sought benefits, stereotyping, beliefs, attitude and<br />
cultural backgrounds, differences in past experience with service and other<br />
customers’ physical characteristics and medical condition. These propositions<br />
were based on interviews and customer surveys. Grove and Fisk (1997) while<br />
empirically testing the impact of individual demographic differences on the<br />
285
esponse to the behavior of other customers found that most of the demographic<br />
differences such as age, education, income and gender are not related to our<br />
behavior towards fellow customers. They however found that marital status is<br />
positively related to dis<strong>satisfaction</strong> with the behavior of fellow customers.<br />
Since most of the demographic variables fail to explain much of the<br />
variation in customers’ reactions towards incompatibility, we need additional<br />
variables to explain the variation. Another set of variables, personal psychological<br />
variables, seems promising in improving our understanding of incompatibility.<br />
Variables such as mood states, perceived control, prior expectations,<br />
involvement and personal <strong>value</strong>s has been demonstrated to be strongly linked to<br />
consumer purchase intentions (Machleit et al. 2000, Swinyard 1997, Hui and<br />
Bateson 1991). We believe that these variables, in addition to having a direct<br />
effect on purchase intentions, also directly impact the intensity of a consumers’<br />
reaction to the incompatibility of their fellow customers which in turn contributes<br />
to future purchase intentions and re-patronage. Although Martin (1989) suggests<br />
the possible impact of personal psychological variables such as individual beliefs,<br />
attitudes, personal <strong>value</strong>s on our reactions to customer incompatibility, his<br />
propositions have not been tested.<br />
In providing guidelines for incompatibility management, researchers have<br />
predominantly opted for segmentation as the preferred method to avoid<br />
unpleasant situations (Martin 1996, Martin and Partner 1991, Martin and Partner<br />
1989). Customer education on their roles in achieving <strong>satisfaction</strong>, clear<br />
communication about the acceptable behaviors (Grove and Fisk 1997, Bitner et<br />
al. 1997), realistic expectation setting (Bitner et al. 1997), and efficient<br />
286
management of space (Martin and Partner 1997) has also been suggested to<br />
reduce the negative impacts of incompatibility. No empirical study, however, is<br />
available that tests the impact of expectation management, enforcement of the<br />
behavioral code of conduct and physical space management (which is expected<br />
to improve customers’ perception of control) on reaction to incompatible<br />
situations.<br />
Literature review establishes two basic gaps. First, the impact of personal<br />
psychological variables on reaction towards incompatibility has not been<br />
considered. Second, no empirical testing has been done on neither the impact of<br />
uncontrollable factors such as mood, <strong>value</strong>s or involvement and/or the impact of<br />
controllable factors such as expectation communication and physical<br />
management of the space on reaction to incompatibility; neither the interactions<br />
between these factors.<br />
In this study, we attempt to fill both of these gaps. We start by developing<br />
hypotheses about the impact of both controllable and uncontrollable factors on<br />
customers’ reaction to incompatible situations. We proceed further by testing<br />
these hypotheses using an experimental design setting.<br />
Hypotheses<br />
Mood can be conceptualized as mild, transient feeling states that are<br />
subjectively perceived by individuals. Mood states may affect cognitive<br />
processes such as evaluation, memory and decision making (Gardner 1985). It<br />
has often been conceptualized as constituting of two independent bipolar positive<br />
and negative feeling states (Isen 1984). A positive mood seems to make one<br />
kinder, generous, more resistant to temptations and more willing to delay self<br />
287
ewards (Swinyard 1993). A customer in positive mood is expected to<br />
demonstrate a more positive evaluation of service encounter than those with<br />
negative or positive mood (Knowles et al. 1993). In other words, customers in<br />
good mood will display greater tolerance towards negative impacts of<br />
incompatibility. Negative moods on the other hand produce greater dislike for<br />
fellow customers, greater vulnerability to provocation and lesser willingness to<br />
forgive (Gardner 1985). Alternatively stated, a customer in negative mood can<br />
strongly react to even small incompatible behaviors.<br />
H1 : Customers in good mood will show higher tolerance for<br />
incompatibility and customers in bad mood will show low tolerance<br />
for incompatibility.<br />
Recent research suggests there are two levels of service expectations i.e.<br />
desired and adequate (Kalra 1991 and Boulding et al. 1993). Desired<br />
expectations represent the level of service a consumer hopes to receive, while<br />
adequate expectations, a lower level of expectations, relate to what consumers<br />
deem an acceptable level of performance. Desired expectations are known to<br />
remain relatively stable over time, while adequate performance expectations may<br />
vary more widely. Between these two service quality expectation levels is a zone<br />
of tolerance. The zone of tolerance describes the latitude in customer’s<br />
willingness to accept deviation from desired standards. This zone of tolerance will<br />
be different for different services (Gwynne and Devlin 2000). For example<br />
patients in waiting room to see a doctor will expect and accept a low level of<br />
compatibility where as a customer in his/her favorite bar may not expect and<br />
accept a high level on incompatibility. It follows then that if the level of customer<br />
incompatibility lies within the zone of tolerance, customer evaluation of service<br />
288
may not be adverse. Expected incompatibility may lead to a reduction in the<br />
intensity of reaction while the unexpected incompatibility may increase the<br />
intensity of reaction.<br />
H2 : Prior expectations of incompatibility will increase tolerance for<br />
incompatibility.<br />
Control refers to the ability to regulate one’s own affairs. It has often been<br />
defined as the need to demonstrate one’s competence, superiority and mastery<br />
over the environment (White 1959). Literature makes a distinction between<br />
behavioral, cognitive and decisional control (Averill 1973). Behavioral control –<br />
also referred to as control over activities—“refers to availability of a response<br />
which may directly influence or modify the objective characteristic of an event”<br />
(pp.287). Decisional control or control over outcome refers to “the opportunity to<br />
choose among various courses of action” (pp.287). The cognitive control refers to<br />
“the way in which the event is interpreted, appraised, or incorporated into a<br />
cognitive plan” (pp.287). In a restaurant situation control over activities may be<br />
though as the ability to regulate improper public behaviors of fellow customers by<br />
asking manager to enforce rules of conduct while control over outcome can be<br />
operationalized as the ability to escape an undesirable situation by moving to<br />
another section of the restaurant. Perception of high control has been shown to<br />
positively impact the tolerance of pain and frustration, and self-report of distress<br />
and anxiety (Hui and Bateson 1991).<br />
H3 : Higher perceived control over service activities will increase<br />
tolerance for incompatibility.<br />
H4 : Higher perceived control over service outcome will increase<br />
tolerance for incompatibility.<br />
289
Values may be defined as beliefs that pertain to desirable end states or<br />
modes of conduct, transcend specific situations such as behavior of fellow<br />
customers, guide selection or evaluation of behavior, and are ordered by<br />
importance in relation to one another to form a system of <strong>value</strong> priorities.<br />
Schwartz (1992) provides a typology of <strong>value</strong>s, where the <strong>value</strong>s are arranged<br />
according to the type of motivational goal they express. These ten <strong>value</strong> types<br />
represent two basic bipolar dimensions; openness to change versus<br />
conservation and self transcendence versus self-enhancement. In context of<br />
reaction to customer incompatibility, the bipolar dimension of conservation<br />
versus openness to change seems very relevant. Conservative individuals are<br />
very concerned with security, conformity, and tradition. These individuals are<br />
expected to display low tolerance for incompatibility. On the other hand<br />
individuals displaying openness are focused on hedonism, stimulation and self-<br />
direction and are expected to show greater tolerance for customer<br />
incompatibility.<br />
H5 : Customers with resultant conservatism will show low tolerance for<br />
incompatibility.<br />
H6 : Customers with resultant openness will show high tolerance for<br />
incompatibility.<br />
The intensity of customer involvement in purchase decision is also<br />
expected to moderate reaction to customer incompatibility. The information<br />
processing theory in consumer behavior literature suggests that the consumer is<br />
an intelligent, rational, problem-solver who actively seeks and uses information to<br />
evaluate the various alternatives or choices (Zaichowsky 1985). The extent of<br />
290
consumer involvement varies with the significance or degree of importance of the<br />
decision to the consumer (Engel and Blackwell 1982). Depending on the degree<br />
of involvement in a purchase decision, consumer decision making has been<br />
classified as being high or low involvement. In a low-involvement purchase<br />
decision, because the purchase does not have much significance to the<br />
consumer, he or she does not extensively search for information, and rarely<br />
evaluates alternatives or choices before making the purchase decision. In order<br />
to reduce the risk associated with high-involvement decisions, consumer<br />
searches for more information and spend more time searching for the right<br />
selection. Because of this high risk component, high involvement service<br />
purchasers are expected to show low tolerance for customer incompatibility that<br />
could interfere with desired service outcome. On the other hand, low involvement<br />
service purchasers are expected to show greater tolerance for customer<br />
incompatibility.<br />
H7 : Customers with high involvement will show low tolerance for<br />
incompatibility.<br />
Sources of Data<br />
Two hundred and ten respondents were first self-administered Personal<br />
<strong>value</strong> system questionnaire. Respondents were then separated into groups of<br />
open to change and conservative respondents.<br />
Methodology<br />
Two different experiments were conducted. The purpose of the first<br />
experiment was to confirm whether the factors being considered in the<br />
experiment and some of the first order interactions had significant effect on<br />
reaction to incompatible situations. The second experiment was conducted to<br />
291
find out the optimal combination of controllable and uncontrollable factors would<br />
minimize the negative impact of uncontrollable factors on reaction to<br />
incompatible situations.<br />
For understanding main and interaction effects, a<br />
6 2<br />
2 − fractional factorial<br />
iv<br />
design with sixteen treatments, as shown in figure 1, was used to create service<br />
scenarios or profiles for understanding the impact of antecedents on reaction<br />
towards customer incompatibility. Since it was a resolution four design, no main<br />
effect was confounded with first order interactions. This means that not only main<br />
effect estimates were clean but we could also calculate some of the first order<br />
interactions rather cleanly.<br />
---------------------------------------------------------------------------------------------------<br />
Place Figure 1 about here<br />
---------------------------------------------------------------------------------------------------<br />
Three hundred and twenty respondents self administered 27 item<br />
Schwartz <strong>value</strong> system questionnaire for measuring conservative versus<br />
openness to change orientation. Based on the results of the survey, respondents<br />
were segregated into two groups of conservative and open to change. Following<br />
Weyant (1978), mood of each group was manipulated through false feedback.<br />
Half of the respondents in each group were given two different types of anagrams<br />
to be solved. Anagrams are the words, from whose alphabet another word can<br />
be created. One set of respondents in each group was handed anagrams which<br />
were supposed to easier to solve while the other group got a difficult set. Each<br />
anagram test contained 25 questions. Subjects were given 15 minutes to<br />
complete as many anagrams as possible. After the end of 15 minutes<br />
respondents read the false statistics about the tests. Respondents in the groups<br />
that received easy anagrams were told that they had done exceedingly bad and<br />
292
their results were well below the average for these kinds of tests, thereby placing<br />
them in bad mood. Group that received difficult anagrams were told that they had<br />
done exceedingly well and their results were far above the average for these<br />
kinds of tests, thereby placing them in good mood.<br />
For treatment of control over activities, control over outcome,<br />
expectations, and involvement, each respondent received one of the sixteen<br />
combinations (in form of a video movie) and recorded his/her reaction to<br />
customer incompatibility on a scale of 1-6. Instead of using written scenarios,<br />
video films were developed to operationalize the design factors of involvement,<br />
perceived control and expectations. We believe that video films provided<br />
respondents were in restaurant reality and their responses were expected to<br />
more realistic than would have been with written scenarios. At the end,<br />
manipulation measurement checks were made for mood, perceived control and<br />
involvement.<br />
For experiment to find out the optimal combination of controllable and<br />
uncontrollable factors, half fractions of 2 3-1 were used as outer and inner arrays in<br />
a Taguchi style experiment (see figure 2). The inner array is composed of<br />
controllable factors and the outer array consists of uncontrollable factors. In this<br />
arrangement each combination of controllable factors was contrasted with all<br />
combination of uncontrollable factors providing us with detailed information on all<br />
possible impacts of uncontrollable factors.<br />
---------------------------------------------------------------------------------------------------<br />
Place Figure 2 about here<br />
---------------------------------------------------------------------------------------------------<br />
293
Taguchi recommends the use of signal to noise ratio (S/N ratio) as the<br />
basis for selecting the optimal combination, where the term signal represents the<br />
controllable component while the term noise represents the uncontrollable<br />
component. This ratio, infact, measures the ability to perform according to<br />
specifications in varying conditions. The objective of S/N ratio is to determine an<br />
optimum set of operating conditions that simultaneously maximizes the objective<br />
quality function while reducing the variation in output quality.<br />
Taguchi recommends three types of S/N ratios: Larger the better<br />
(maximizing the desired response variable), smaller the better (minimizing the<br />
undesirable response variable) or minimal is best (attaining a predefined level).<br />
In this case, because we were trying to maximize choice probabilities, the<br />
appropriate performance statistic deemed to be the “smaller the better”. It is<br />
given by the following formula:<br />
SN<br />
s<br />
⎡1<br />
n<br />
= − 10 log ⎢ ∑ Y<br />
⎣n<br />
i = 1<br />
2<br />
i<br />
⎤<br />
⎥<br />
⎦<br />
where yi is the response variable which in our case is the reaction to incompatible<br />
situation, and n is the number of observations.<br />
Measures<br />
Mood: Mood scale was adapted from Peterson and Sauber (1983). Using a<br />
seven point likert type scale, mood was measured by four summed bipolar items.<br />
Four bipolar items were sad/happy, good mood/bad mood, irritable/pleased and<br />
depressed/cheerful.<br />
Involvement: We used a modified form of involvement scale used by Gore and<br />
Madhavan (1994) for measuring consumer involvement in nonprescription<br />
294
medicine purchase decisions. A five item seven point likert scale was used.<br />
These items represented the various theoretical propositions about the<br />
involvement construct such as search for information, evaluation of product<br />
alternatives, and perception of differences among the various brands.<br />
Perceived Control: Following Hui and Bateson (1991), we used a semantic<br />
differential combination of Meharbian and Russel’s (1974) scales of dominance<br />
and Glass and Singer’s (1972) scales of helplessness as a proxy for the<br />
construct of perceived control.<br />
Expectations: Prior expectation of customer compatibility were measured by<br />
asking respondents to rate their expectation regarding compatibility on seven<br />
point (0-6) scale where 0 represents no compatibility incompatibility and 6<br />
represents high compatibility.<br />
Personal Values: For measuring personal <strong>value</strong>s, a twenty seven item scale<br />
(Schwartz, 1992) was used. These questions represented bipolar dimensions of<br />
conservatism versus openness to change Schwartz <strong>value</strong> system has been used<br />
and found reliable in many different parts of the world including surveys in forty-<br />
four countries (Schwartz and Sagiv 1995).<br />
Compatibility Threshold: We used six point customer compatibility<br />
dis<strong>satisfaction</strong> reaction scale developed by Martin (1989). The scale ranges from<br />
a tolerable behavior of “would not effect me one way or the other” to an extremely<br />
sever reaction “would bother me enough that I would never return”.<br />
Results<br />
Table 1 presents the estimated marginal means for the reaction to<br />
incompatible situation for both levels across six factors. Lower marginal means<br />
295
epresent higher tolerance of incompatibility while higher marginal means<br />
represent lower tolerance. All results were in expected direction. Data supports<br />
all seven hypotheses. Means for good and bad mood (2.63 and 3.70<br />
respectively) provide strong support for hypothesis 1. The range of marginal<br />
means (the difference between means for two levels) signifies the relative<br />
intensity of the impact of design factors on response variable. Larger is the<br />
range, higher is the impact. Range for mood is the third highest among the six<br />
factors. Data also provide strong support for hypothesis 2, where marginal means<br />
for expectation of incompatibility and no expectation were 2.58 and 3.78 and had<br />
the second highest range (1.20). Hypotheses 3 about the impact of perception of<br />
control on activity received only moderate support (3.38 and 2.97 for perception<br />
of control over activities and no control respectively with a small range of 0.41).<br />
Hypothesis 4 received the strongest support (2.55 and 3.80 for control and no<br />
control over outcome with a range of 1.25). Hypotheses 5 and 6 received<br />
moderate support (2.92 and 3.43 for open to change and conservative<br />
orientations with a small range of 0.48). Similarly hypothesis 7 was also<br />
supported moderately with means of 2.90 and 3.46 for low and high involvement<br />
with a range of 0.56.<br />
Place table 1 about here<br />
Factorial analysis of variance was conducted to investigate the impact of<br />
main and interaction effects on reaction to customer incompatibility. Model seems<br />
to fit the data well (Adjusted R 2 =0 .893). ANOVA results presented in table 2,<br />
showed a significant effects for control over outcome (F = 322, p
(F=297, p
estaurant where they can escape incompatibility; communicate to them in<br />
advance about the probability of encountering incompatible behavior then even a<br />
conservative customers in bad mood and high involvement in restaurant selection<br />
will not react adversely to incompatibility.<br />
Discussion<br />
Place table 3 about here<br />
Purpose of this study was twofold; to explore the antecedents of customers’<br />
reaction to incompatibility and to develop operational guidelines for practitioners<br />
to manage incompatibility at foodservice outlets. Although the factors selection<br />
and testing was based on review of literature that assumed these to be linked to<br />
incompatibility, it was important to test these commonly held assumptions. By<br />
testing hypotheses about this linkage we were able to determine the direction of<br />
these linkages. Although the model fit statistics are fairly high (adjusted R 2 =0<br />
.893) we feel that the model tested can not be considered as complete. Some of<br />
the factors that may have an impact on incompatibility such as educational level<br />
of respondent and price of the meal were not included in the experiment because<br />
of the increasing response burden on the respondents. Even the six factor<br />
experiment can be considered as one with high response burden and we tried to<br />
lighten up this burden by using video films in place of traditional written<br />
scenarios.<br />
Although the testing of hypotheses and information obtained from these were<br />
important in understanding the phenomenon of incompatibility, it unfortunately<br />
did not provide relevant guidelines in terms of managing incompatibility at the<br />
business place. It is obvious that in most of the cases, incompatibility at business<br />
place is inevitable. Good segmentation can help reduce incompatibility but it can<br />
298
not eliminate it. Further, extreme segmentation has its own shortcomings. For<br />
most of the businesses to grow, they have to attract diverse group of customers<br />
and diversity inevitably results in some form of incompatibility. The emphasis,<br />
therefore, has to be on managing on site compatibility.<br />
Results of experimental design on the antecedents of incompatibility<br />
indicated that only one of the three most important factors, perception of control<br />
over outcome, was under the control of operating manages. Customers mood<br />
was a beyond the control of managers, while customers prior expectations could<br />
only be considered semi controllable. If two of the three most important factors<br />
contributing to reaction towards incompatibility were beyond the control of<br />
operating managers, then the next logical question is what can be done about<br />
the impact of uncontrollable factors? Stated alternatively, what the optimal<br />
combination controllable and uncontrollable factor levels that will minimize the<br />
severity of customer reaction towards incompatibility?<br />
The answer to this question was obtained by conducting a Taguchi<br />
experiment. Results of Taguchi experiment suggested that if we provide<br />
customers with an option to escape the incompatibility by moving them to<br />
another section and alert them to the possibility of encountering incompatible<br />
situation through effective communications then the adverse impact of bad mood,<br />
conservatism and high involvement can be minimized. Enforcing the rules for<br />
proper code of conduct – perceived control over activities — alone, without<br />
moving customers to another section – perceived control over outcome – will not<br />
minimize the severity of reaction to incompatibility.<br />
299
Three significant interaction terms also provide useful information. A<br />
significant interaction between control over activities and mood suggests<br />
customers in bad mood will have greater desire for enforcing the rules of conduct<br />
regarding public behaviors. Similarly significant interaction between expectations<br />
and involvement suggests the customers with high involvement in the selection<br />
of restaurant such as those going for a romantic dinner have low expectations of<br />
incompatibility and therefore are expected to react severely to an incompatible<br />
situation. Perhaps, the most significant interaction was found to be between<br />
involvement and control over outcome. A higher involvement in the restaurant<br />
selection enhances the desire for greater control over outcome when faced with<br />
incompatible situation. Significant interaction of involvement with desired control<br />
over outcome and prior expectation of incompatibility suggests the threat of<br />
severe reaction to incompatible will be higher for full service dinning<br />
establishment which can generally be characterized as destinations that require<br />
high customer involvement than fast food restaurants than can generally be<br />
characterized as low involvement destinations.<br />
Using video films instead of traditional written scenario was another<br />
novelty of this research. Written scenarios at times may not be able to fully<br />
describe the situation in which respondent has to make a decision. The use of<br />
video film was not only expected to fully describe the situation in reality but also<br />
to reduce the response burden where respondents can watch the film and place<br />
themselves in a character’s shoes. Imaging a situation without the help of<br />
pictures will involve greater response burden.<br />
References<br />
300
Averill, J. R. (1973), “Personal control over aversive stimuli and its relationship to stress”<br />
Psychological Bulletin, 80, 286 –303.<br />
Baker, Julie (1987), “The Role of the Environment in Marketing Services: The Consumer<br />
Perspective,” in The Services Challenge: Integrating for Competitive Eds. John A.Cecil et al.<br />
Chicago, IL: American Marketing Association, pp.79-84.<br />
Bitner, Mary Jo, Faranda, William T., Hubbert, Amy R., Zeithaml, Valarie A.,(1997) “Customer<br />
contributions and roles in service delivery”, International Journal of Service Industry Management;<br />
Vol. 8 Issue 3, p193-205<br />
Boulding, W., Kalra A., Staelin, R., Zeithmaml, V., (1993), “A Dynamic Process Model of Service<br />
<strong>Quality</strong>: From Expectations to Behavioural Intentions,” Journal of Marketing Research,v30,pp.7-<br />
27<br />
Eangel, J. F., Blackwell R., (1982) Consumer Behavior New York Dryden Press.<br />
Gardner, Meryl Paula, (1985), “Mood States and Consumer Behavior: A Critical Review” Journal<br />
of Consumer Research; Vol. 12 Issue 3, p281-300<br />
Glass, D.C. & Singer, J.E. (1972). Urban Stress: Experiments on noise and social stressors. New<br />
York: Academic Press.<br />
Gore P, Madhavan S, McClung G, Riley DA., (1994), "Consumer Involvement in Nonprescription<br />
Medicine Purchase Decisions". Journal of Health Care Marketing, Vol 14(2):16-23.<br />
Grove, Stephen J., Fisk, Raymond P., (1997), “The impact of other customers on service<br />
experiences: A Critical Incidence Examination of “Getting Along”” Journal of Retailing; Vol. 73<br />
Issue 1, p63-87<br />
Gwynne, Anne L., Devlin, James F., (2000), “The Zone of Tolerance: Insights and Influences”<br />
Journal of Marketing Management; Vol. 16 Issue 6, p24<br />
Hui, Michael K., Bateson, John E.G., (1991), “Perceived Control and the Effects of Crowding and<br />
Consumer Choice on the Service “ Journal of Consumer Research;Vol. 18 Issue 2, p174-184<br />
Isen, Alice M. (1984), “Toward Understanding the Roleof Affect in Cognition”, In Handbook of<br />
Social Cognition, R. Wyer and T. Srull, eds. Hillsdale, NJ: Lawrence Erlbaum Associates, 179-<br />
236.<br />
Kalra, A., (1991), “An Expectations Based Model of Service <strong>Quality</strong> Assessment,” paper<br />
presented at the American Marketing Association Summer Educators’ Meeting, Chicago, IL.<br />
Knowles, Patricia A., Grove, Stephen J., Pickett, Gregory M., (1993), “Mood and the Service<br />
Customer” Journal of Services Marketing; Vol. 7 Issue 4, p41-52<br />
Machleit, Karen A., Eroglu, Sevgin A., Mantel, Susan Powell, (2000), “Perceived Retail Crowding<br />
and Shopping Satisfaction: What Modifies This Relationship?” Journal of Consumer Psychology;<br />
Vol. 9 Issue 1, p29-42<br />
Martin, Charles L., (1996), “Consumer-to-consumer relationships: Satisfaction with other<br />
consumers' public behavior” Journal of Consumer Affairs; Vol. 30 Issue 1, p146-69<br />
Martin, Charles L., Pranter, Charles A., (1989), Compatibility Management: Customer-To-<br />
Customer Relationships In Service Environments” Journal of Services Marketing; Vol. 3 Issue 3,<br />
p5-15<br />
301
McGrath, Mary Ann, Otnes, Cele, (1995), “Unacquainted influencers: When strangers interact in<br />
the retail setting” Journal of Business Research; Vol. 32 Issue 3, p261-272<br />
Mehrabian, A., & Russell, J.A. (1974). An approach to environmental psychology. M.I.T. Press,<br />
Cambridge, MA.<br />
Parker, Cathy, Ward, Philippa, (2000),”An analysis of role adoptions and scripts during customerto-customer<br />
encounters” European Journal of Marketing; Vol. 34 Issue 3/4, p341-458<br />
Peterson R. A. and M . Sauber (1983) "A Mood Scale for Survey Research" in Murphy P et al.<br />
(eds) American Marketing Association Educators Proceedings (409-414) Chicago: AMA.<br />
Schwartz, S. H., Lilach Sagiv (1995), Identifying Culture-Specifics in Content and Structures of<br />
Values,” Journal of Cross-Cultural Psychology, V 26 (January) 92-116<br />
Schwartz, S.H. (1992). Universals in the Construct and Structure of Values: Theoretical Advances<br />
and Empirical Tests in 20 Countries. In M.P. Zanna (Ed.). Advances in Experimental Social<br />
Psychology. CA: Academic Press<br />
Swinyard, William R.(1993), “The effects of mood, involvement, and quality of store experience<br />
on shopping intentions”Journal of Consumer Research; Sep93, Vol. 20 Issue 2, p271-280<br />
Weyant, J. M. (1978). Effects of mood states, costs, and benefits on helping. Journal of<br />
Personality and Social Psychology, 36, 1169-1176.<br />
White, R.W. (1959). Motivation reconsidered: the concept of competence. Psychological Review,<br />
66, 297-333.<br />
Zaichowsky, J. L.,(1985), “Measuring the Involvement Construct” Journal of Consumer Research,<br />
12, 341-352<br />
302
Table…1<br />
Estimated Marginal Means<br />
Factor Factor Level Marginal Means Range<br />
Bad 3.70<br />
Mood Good 2.63 1.07<br />
No 3.78<br />
Prior Expectations Yes 2.58 1.20<br />
No 3.38<br />
Control Over Activities Yes 2.97 0.41<br />
No 3.80<br />
Control Over Outcome Yes 2.55 1.25<br />
Conservative 3.43<br />
Personal Value System Open to change 2.95 0.48<br />
High 3.46<br />
Involvement Low 2.90 0.56<br />
303
Table…2<br />
Tests of Between-Subjects Effects<br />
Dependent Variable: Incompatibility Reaction<br />
Type III Sum Mean<br />
η<br />
Factor<br />
of Squares Df Square F Sig.<br />
2 (Eta<br />
Squared)<br />
Corrected Model 422.787(a) 13 32.522 83.840 .000 0.893<br />
Intercept 3238.513 1 3238.513 8348.651 .000 0.954<br />
Control over activities 13.612 1 1.612 35.092 .000 0.081<br />
Control over outcome 125.000 1 125.000 322.241 .000 0.546<br />
Expectations 115.200 1 115.200 296.977 .000 0.526<br />
Personal Value System 21.012 1 21.12 54.169 .000 0.119<br />
Mood 86.112 1 86.112 221.992 .000 0.457<br />
Involvement 25.313 1 25.313 65.254 .000 0.140<br />
Personal Value System *<br />
Mood<br />
1.012 1 1.012 2.610 .107 0.002<br />
Mood * Involvement .012 1 .012 .032 .858 0.000<br />
Expectations * Mood 1.250 1 1.250 3.222 .074 0.002<br />
Control over activities *<br />
Mood<br />
6.612 1 6.612 17.047 .000 0.031<br />
Expectations *Involvement 11.250 1 11.250 29.002 .000 0.068<br />
Control over outcome *<br />
Involvement<br />
16.200 1 16.200 41,762 .000 0.103<br />
Control over activities *<br />
Expectations<br />
,.00 1 .200 .516 .473 0.002<br />
Error 118.700 306 .388<br />
Total 3780.000 320<br />
Corrected Total 541.488 319<br />
R 2 =0.921 (Adjusted R 2 =0 .893)<br />
Table…3<br />
Signal/Noise Ratio Results<br />
Outer Array<br />
1 2 2 1<br />
1 2 1 2<br />
Inner Array 1 1 2 2 Mean SD S/N Ratio<br />
1 1 1 4.95 2.70 3.15 4.05 3.71 0.99 -11.5<br />
1 2 2 3.80 2.40 1.95 2.60 2.68 0.79 -8.8<br />
2 1 2 3.70 3.10 2.70 1.85 2.83 0.77 -9.5<br />
2 2 1 5.90 3.25 2.80 2.90 3.71 1.47 -12.0<br />
304
Run<br />
Control<br />
Over<br />
Activities<br />
Figure…1<br />
6 2<br />
Design Matrix for 2 −<br />
iv Experiment<br />
Control<br />
Over<br />
Outcome<br />
Expectations<br />
Personal<br />
Value System<br />
Mood Involvement<br />
1 Low Low No Conservative bad Low<br />
2 High Low No Conservative Good Low<br />
3 Low High No Conservative Good High<br />
4 High High No Conservative bad High<br />
5 Low Low Yes Conservative Good High<br />
6 High Low Yes Conservative bad High<br />
7 Low High Yes Conservative bad Low<br />
8 High High Yes Conservative Good Low<br />
9 Low Low No Progressive bad High<br />
10 High Low No Progressive Good High<br />
11 Low High No Progressive Good Low<br />
12 High High No Progressive bad Low<br />
13 Low Low Yes Progressive Good Low<br />
14 High Low Yes Progressive bad Low<br />
15 Low High Yes Progressive bad High<br />
16 High High Yes Progressive Good High<br />
High, Yes, Good, Progressive = + in design Matrix<br />
Low, No, Bad, Conservative= - in design Matrix<br />
305
Figure…2 (a)<br />
Combination of L4 Taguchi Arrays<br />
Outer Array<br />
1 2 2 1<br />
1 2 1 2<br />
Inner Array 1 1 2 2<br />
1 1 1<br />
1 2 2<br />
2 1 2<br />
2 2 1<br />
Figure…2 (b)<br />
Re-arrangement of L4 Taguchi Arrays into Design Profiles<br />
Ru<br />
n<br />
Control Over<br />
Activities<br />
Control Over<br />
Outcome<br />
Expectation<br />
s<br />
Personal Value<br />
System<br />
Mood Involvement<br />
1<br />
No No No Conservative Bad Low<br />
2<br />
No No No Conservative Good High<br />
3<br />
No No No Progressive Bad High<br />
4 No No No Progressive Good Low<br />
5 No Yes Yes Conservative Bad Low<br />
6 No Yes Yes Conservative Good High<br />
7 No Yes Yes Progressive Bad High<br />
8 No Yes Yes Progressive Good Low<br />
9 Yes No Yes Conservative Bad Low<br />
10 Yes No Yes Conservative Good High<br />
11 Yes No Yes Progressive Bad High<br />
12 Yes No Yes Progressive Good Low<br />
13 Yes Yes No Conservative Bad Low<br />
14 Yes Yes No Conservative Good High<br />
15 Yes Yes No Progressive Bad High<br />
16 Yes Yes No Progressive Good Low<br />
High, Yes, Good, Progressive = + in design Matrix<br />
Low, No, Bad, Conservative= - in design Matrix<br />
306
307