JPMorgan Investment Funds
JPMorgan Investment Funds
JPMorgan Investment Funds

Create successful ePaper yourself
Turn your PDF publications into a flip-book with our unique Google optimized e-Paper software.
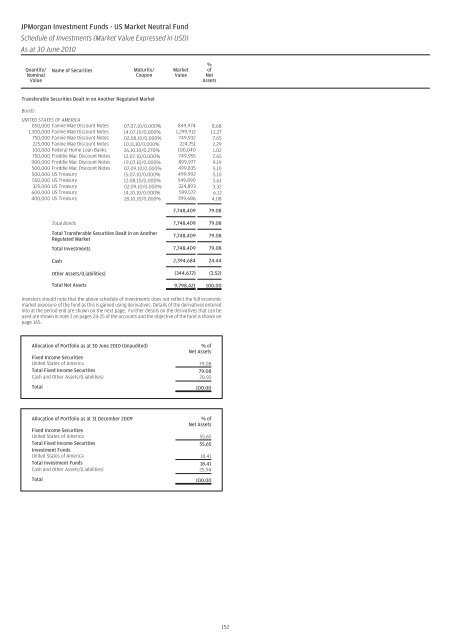
<strong>JPMorgan</strong> <strong>Investment</strong> <strong>Funds</strong> - US Market Neutral Fund<br />
Schedule of <strong>Investment</strong>s (Market Value Expressed in USD)<br />
As at 30 June 2010<br />
Quantity/<br />
Nominal<br />
Value<br />
Name of Securities<br />
Maturity/<br />
Coupon<br />
Market<br />
Value<br />
% of<br />
Net<br />
Assets<br />
Transferable Securities Dealt in on Another Regulated Market<br />
Bonds<br />
UNITED STATES OF AMERICA<br />
850,000 Fannie Mae Discount Notes 07.07.10/0.000% 849,974 8.68<br />
1,300,000 Fannie Mae Discount Notes 14.07.10/0.000% 1,299,912 13.27<br />
750,000 Fannie Mae Discount Notes 02.08.10/0.000% 749,932 7.65<br />
225,000 Fannie Mae Discount Notes 10.11.10/0.000% 224,751 2.29<br />
100,000 Federal Home Loan Banks 26.10.10/0.270% 100,040 1.02<br />
750,000 Freddie Mac Discount Notes 12.07.10/0.000% 749,955 7.65<br />
900,000 Freddie Mac Discount Notes 19.07.10/0.000% 899,977 9.19<br />
500,000 Freddie Mac Discount Notes 07.09.10/0.000% 499,835 5.10<br />
500,000 US Treasury 15.07.10/0.000% 499,992 5.10<br />
550,000 US Treasury 12.08.10/0.000% 549,890 5.61<br />
325,000 US Treasury 02.09.10/0.000% 324,893 3.32<br />
600,000 US Treasury 14.10.10/0.000% 599,572 6.12<br />
400,000 US Treasury 28.10.10/0.000% 399,686 4.08<br />
7,748,409 79.08<br />
Total Bonds 7,748,409 79.08<br />
Total Transferable Securities Dealt in on Another<br />
Regulated Market<br />
7,748,409 79.08<br />
Total <strong>Investment</strong>s 7,748,409 79.08<br />
Cash 2,394,684 24.44<br />
Other Assets/(Liabilities) (344,672) (3.52)<br />
Total Net Assets 9,798,421 100.00<br />
Investors should note that the above schedule of investments does not reflect the full economic<br />
market exposure of the fund as this is gained using derivatives. Details of the derivatives entered<br />
into at the period end are shown on the next page. Further details on the derivatives that can be<br />
used are shown in note 2 on pages 24-25 of the accounts and the objective of the fund is shown on<br />
page 165.<br />
Allocation of Portfolio as at 30 June 2010 (Unaudited)<br />
Fixed Income Securities<br />
% of<br />
Net Assets<br />
United States of America 79.08<br />
Total Fixed Income Securities 79.08<br />
Cash and Other Assets/(Liabilities) 20.92<br />
Total 100.00<br />
Allocation of Portfolio as at 31 December 2009<br />
Fixed Income Securities<br />
% of<br />
Net Assets<br />
United States of America 55.65<br />
Total Fixed Income Securities<br />
<strong>Investment</strong> <strong>Funds</strong><br />
55.65<br />
United States of America 18.41<br />
Total <strong>Investment</strong> <strong>Funds</strong> 18.41<br />
Cash and Other Assets/(Liabilities) 25.94<br />
Total 100.00<br />
152<br />
Quantity/<br />
Nominal<br />
Value<br />
Name of Securities<br />
Maturity/<br />
Coupon<br />
Market<br />
Value<br />
% of<br />
Net<br />
Assets


![Prospectus Simplifié daté de [Mars] 2005](https://img.yumpu.com/18875582/1/190x245/prospectus-simplifie-date-de-mars-2005.jpg?quality=85)