Methoden voor de berekening van de emissies door mobiele ... - CBS
Methoden voor de berekening van de emissies door mobiele ... - CBS
Methoden voor de berekening van de emissies door mobiele ... - CBS

You also want an ePaper? Increase the reach of your titles
YUMPU automatically turns print PDFs into web optimized ePapers that Google loves.
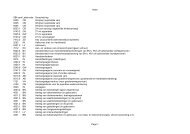
Table A provi<strong>de</strong>s an overview of the different emission sources that are taken into account in each of<br />
the three categorizations.<br />
Table A<br />
Emission sources for each type of reporting<br />
Actual IPCC NEC<br />
emissions 1) emissions 2) emissions 3)<br />
1. ROAD TRANSPORT<br />
2. INLAND NAVIGATION<br />
x x x<br />
Goods, international x x<br />
Goods, domestic x x x<br />
Passenger vessels and ferries x x x<br />
Recreational traffic<br />
3. FISHERIES<br />
x x<br />
Dutch fishing cutters -diesel x x x<br />
Dutch <strong>de</strong>ep sea trawlers -diesel x<br />
Foreign fishing cutters -diesel x<br />
Deep sea trawlers (fuel oil)<br />
4. MARITIME SHIPPING<br />
x<br />
In harbour x<br />
On the national continental shelf<br />
5. RAIL TRANSPORT<br />
x<br />
Passengers x x x<br />
Goods<br />
6. CIVIL AVIATION<br />
x x x<br />
National, AVGAS x x x<br />
National, kerosene x x x<br />
International, kerosene<br />
7. MOBILE MACHINERY<br />
x x<br />
Agriculture x x x<br />
Construction x x x<br />
Other<br />
8. MILITARY ACTIVITIES<br />
x x x<br />
Ships x<br />
Aircraft<br />
1)<br />
All substances.<br />
2)<br />
CO2, N2O and CH4.<br />
3)<br />
NMVOC, SO2, NOx, NH3 and PM10<br />
x<br />
Shares and trends in emissions from mobile sources<br />
Table B shows the emission totals for mobile sources in the Netherlands in 2010 as reported by the<br />
Task Force on Transportation (including non-road mobile machinery, fisheries and military activities)<br />
for all three emission categorizations. For each substance and emission categorization, the table also<br />
shows the share of transport in the total emissions in the Netherlands. The table shows that the actual<br />
emissions on Dutch territory are for the most part higher than the IPCC and NEC emissions, the<br />
difference being explained by the differences in methodologies used and differences in the source<br />
categories that are taken into account. The table also shows that mobile sources are responsible for a<br />
significant share of total CO2, NOx, NMVOC and PM10 emissions in the Netherlands.<br />
The trends in the emissions of greenhouse gases and air polluting substances from mobile sources<br />
between 1990 and 2010 are shown in figures A and B respectively. Figure A shows that CO2 and N2O<br />
emissions from mobile sources have increased by over 20% (CO2) and 40% (N2O) respectively since<br />
1990, although in recent years emissions have <strong>de</strong>creased. Emissions of CH4 have <strong>de</strong>creased<br />
throughout the time series. The same holds for the emissions of NOx, PM10 and NMVOC, as is shown<br />
in figure B. Emissions of SO2 increased slightly in earlier years of the time series but have <strong>de</strong>creased<br />
significantly since.<br />
The trends in emissions of greenhouse gases and air polluting substances are <strong>de</strong>scribed in more<br />
<strong>de</strong>tail in the National Inventory Report and the Informative Inventory Report respectively.<br />
Emission data can also be found in the Statline database of Statistics Netherlands (theme: Nature and<br />
Environment).<br />
11