- Page 1 and 2: MATERIALS TESTING AND RESEARCH SOLU
- Page 3 and 4: When accuracy and reliability in me
- Page 5 and 6: AGILENT TECHNOLOGIES APPLICATIONS F
- Page 7 and 8: Figure 1. Agilent Cary 630 FTIR spe
- Page 9 and 10: The calibration samples were measur
- Page 11 and 12: Author Frank Higgins Agilent Techno
- Page 13 and 14: Figure 1. The overlaid aliphatic be
- Page 15 and 16: Author John Seelenbinder Agilent Te
- Page 17 and 18: Figure 3. Sample is lightly pressed
- Page 19 and 20: Author Dr. Mustafa Kansiz Agilent T
- Page 21 and 22: microscopy provides for a factor of
- Page 23: Standard ATR IR Image No Pressure (
- Page 27 and 28: Experimental Instrumentation To per
- Page 29 and 30: Authors Jonah Kirkwood † and Must
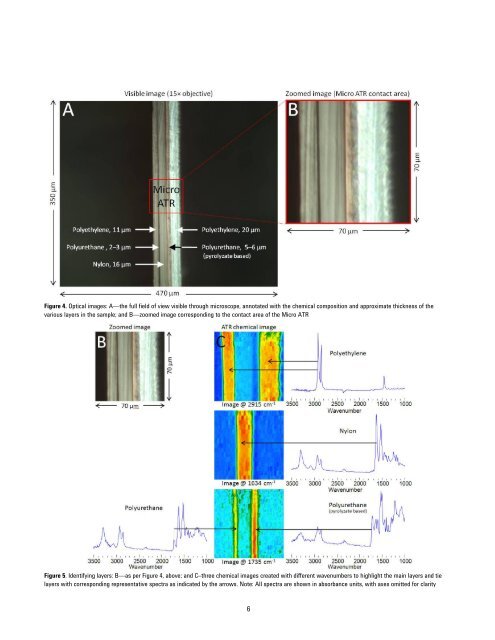
- Page 31 and 32: Spectra were collected from each lo
- Page 33 and 34: Infrared mapping allows for multipl
- Page 35 and 36: The spectra in Figure 2 are visuall
- Page 37 and 38: Conclusion Agilent‟s Cary 610 FTI
- Page 39 and 40: Authors Dr. Wayne Collins*, John Se
- Page 41 and 42: The calibration curve obtained for
- Page 43 and 44: Conclusion Select ‘Peak Ratio’
- Page 45 and 46: Summary This method describes a pro
- Page 47 and 48: Method configuration To determine t
- Page 49 and 50: Authors Dr. Wayne Collins*, John Se
- Page 51 and 52: The calibration curve for the deter
- Page 53 and 54: Figure 6. The MicroLab PC FTIR soft
- Page 55 and 56: Summary An analytically representat
- Page 57 and 58: Figure 3. The Irganox 1010 peak are
- Page 59 and 60: Authors Dr. Wayne Collins*, John Se
- Page 61 and 62: The calibration curve and equation
- Page 63 and 64: Select ‘Peak Ratio’ - from the
- Page 65 and 66: Summary An analytically representat
- Page 67 and 68: Figure 3. The GMS peak height absor
- Page 69 and 70: Advanced Atomic Force Microscopy: E
- Page 71 and 72: signal) image indicating the overwh
- Page 73 and 74: A dependence of surface potential o
- Page 75 and 76:
A B C Figure 6A-C. The topography (
- Page 77 and 78:
A B Figure 10A-C. The topography (A
- Page 79 and 80:
KFM with AM-FM operation in the int
- Page 81 and 82:
ibbons is only slightly different f
- Page 83 and 84:
References 1. G. Binnig, C.F. Quate
- Page 85 and 86:
Figure 1. AFM topographic image of
- Page 87 and 88:
100nm 100nm 350nm 100nm Figure 3. A
- Page 89 and 90:
to perfect hexagonal patterns, whic
- Page 91 and 92:
Single-pass KFM studies have been k
- Page 93 and 94:
images due to the difference of the
- Page 95 and 96:
0.5 V) of the nanowires. Additional
- Page 97 and 98:
appeared in the topography image. T
- Page 99 and 100:
of PSS component. TEM studies of mo
- Page 101 and 102:
Atomic Force Microscopy Studies in
- Page 103 and 104:
on graphite and MoS2 are shown in F
- Page 105 and 106:
A B C D Scan size: 5 µm. Scan size
- Page 107 and 108:
images of PEDOT:PSS blend, (PEDOT -
- Page 109 and 110:
Young’s Modulus of Dielectric ‘
- Page 111 and 112:
Figure 3. Young’s modulus as a fu
- Page 113 and 114:
Nanoindentation, Scratch, and Eleva
- Page 115 and 116:
The samples listed as “D” sampl
- Page 117 and 118:
Figure 6. Elastic modulus results f
- Page 119 and 120:
Figure 11. Elastic modulus results
- Page 121 and 122:
Sample B Figure 16. Scratch curves
- Page 123 and 124:
Conclusions Nanoindentation and scr
- Page 125 and 126:
measurement technique has been expl
- Page 127 and 128:
References 1. J.L. Hay, “Using In
- Page 129 and 130:
Theory The complex shear modulus (G
- Page 131 and 132:
References 1. Jain, S.K., Bhattacha
- Page 133 and 134:
LCCC relies on carrying out isocrat
- Page 135 and 136:
log Mp 5 4.6 4.2 3.8 0.5 15% Water
- Page 137 and 138:
Authors Wei Luan and Chunxiao Wang
- Page 139 and 140:
Table 1. Chemical Information of An
- Page 141 and 142:
Injection Volume Influence of Real
- Page 143 and 144:
translator into three modes on diff
- Page 145 and 146:
To identify the matrix influence on
- Page 147 and 148:
Authors Chun-Xiao Wang and Wei Luan
- Page 149 and 150:
Table 1. Polymer Additives in ASTM
- Page 151 and 152:
1 2 3 4 5 1 Tinuvin P 2 BHT 3 BHEB
- Page 153 and 154:
1 Tinuvin P 2 BHT 3 BHEB 4 Isonox 1
- Page 155 and 156:
Authors Edgar Naegele Agilent Techn
- Page 157 and 158:
Results and discussion To meet the
- Page 159 and 160:
Authors Melissa Dunkle, Gerd Vanhoe
- Page 161 and 162:
Experimental The analyses were perf
- Page 163 and 164:
Repeatability of the SFC/MS analysi
- Page 165 and 166:
Conclusion The combination of the A
- Page 167 and 168:
Introduction Phthalates form a grou
- Page 169 and 170:
The analytical method was applied t
- Page 171 and 172:
Introduction Bisphenol A (BPA) is a
- Page 173 and 174:
Preparation of standards BPA and BP
- Page 175 and 176:
Limit of Detection (LOD) and Limit
- Page 177 and 178:
Sample analysis The content of BPA
- Page 179 and 180:
The calibration for BPA and BPF, wh
- Page 181 and 182:
Author Stephen Ball Agilent Technol
- Page 183 and 184:
Results and discussion By operating
- Page 185 and 186:
Introduction The wavelength of UV r
- Page 187 and 188:
LC parameters Premixed solutions of
- Page 189 and 190:
Linearity A linearity study was per
- Page 191 and 192:
References 1. Dr. James H. Gibson,
- Page 193 and 194:
Instrumentation Columns: 2 x PLgel
- Page 195 and 196:
Authors Greg Saunders and Ben MacCr
- Page 197 and 198:
Authors Greg Saunders, Ben MacCreat
- Page 199 and 200:
Authors Greg Saunders, Ben MacCreat
- Page 201 and 202:
Authors Greg Saunders, Ben MacCreat
- Page 203 and 204:
Authors Greg Saunders, Ben MacCreat
- Page 205 and 206:
Author Greg Saunders Agilent Techno
- Page 207 and 208:
Figure 5. Universal calibration cur
- Page 209 and 210:
Methods and Materials Conditions Co
- Page 211 and 212:
Materials and Methods A column set
- Page 213 and 214:
Authors Greg Saunders, Ben MacCreat
- Page 215 and 216:
Authors Greg Saunders, Ben MacCreat