Educating out of Poverty? A Synthesis Report on Ghana, India ... - DfID
Educating out of Poverty? A Synthesis Report on Ghana, India ... - DfID
Educating out of Poverty? A Synthesis Report on Ghana, India ... - DfID

Create successful ePaper yourself
Turn your PDF publications into a flip-book with our unique Google optimized e-Paper software.
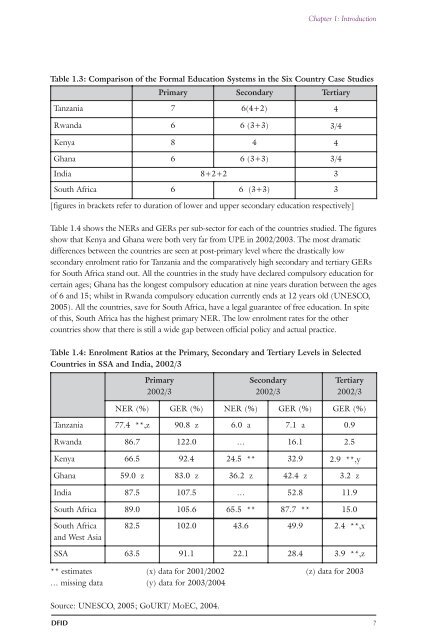
Table 1.3: Comparis<strong>on</strong> <str<strong>on</strong>g>of</str<strong>on</strong>g> the Formal Educati<strong>on</strong> Systems in the Six Country Case Studies<br />
Primary Sec<strong>on</strong>dary Tertiary<br />
Tanzania 7 6(4+2) 4<br />
Rwanda 6 6 (3+3) 3/4<br />
[figures in brackets refer to durati<strong>on</strong> <str<strong>on</strong>g>of</str<strong>on</strong>g> lower and upper sec<strong>on</strong>dary educati<strong>on</strong> respectively]<br />
Table 1.4 shows the NERs and GERs per sub-sector for each <str<strong>on</strong>g>of</str<strong>on</strong>g> the countries studied. The figures<br />
show that Kenya and <strong>Ghana</strong> were both very far from UPE in 2002/2003. The most dramatic<br />
differences between the countries are seen at post-primary level where the drastically low<br />
sec<strong>on</strong>dary enrolment ratio for Tanzania and the comparatively high sec<strong>on</strong>dary and tertiary GERs<br />
for S<str<strong>on</strong>g>out</str<strong>on</strong>g>h Africa stand <str<strong>on</strong>g>out</str<strong>on</strong>g>. All the countries in the study have declared compulsory educati<strong>on</strong> for<br />
certain ages; <strong>Ghana</strong> has the l<strong>on</strong>gest compulsory educati<strong>on</strong> at nine years durati<strong>on</strong> between the ages<br />
<str<strong>on</strong>g>of</str<strong>on</strong>g> 6 and 15; whilst in Rwanda compulsory educati<strong>on</strong> currently ends at 12 years old (UNESCO,<br />
2005). All the countries, save for S<str<strong>on</strong>g>out</str<strong>on</strong>g>h Africa, have a legal guarantee <str<strong>on</strong>g>of</str<strong>on</strong>g> free educati<strong>on</strong>. In spite<br />
<str<strong>on</strong>g>of</str<strong>on</strong>g> this, S<str<strong>on</strong>g>out</str<strong>on</strong>g>h Africa has the highest primary NER. The low enrolment rates for the other<br />
countries show that there is still a wide gap between <str<strong>on</strong>g>of</str<strong>on</strong>g>ficial policy and actual practice.<br />
Table 1.4: Enrolment Ratios at the Primary, Sec<strong>on</strong>dary and Tertiary Levels in Selected<br />
Countries in SSA and <strong>India</strong>, 2002/3<br />
** estimates (x) data for 2001/2002 (z) data for 2003<br />
… missing data (y) data for 2003/2004<br />
Source: UNESCO, 2005; GoURT/ MoEC, 2004.<br />
Chapter 1: Introducti<strong>on</strong><br />
Kenya 8 4 4<br />
<strong>Ghana</strong> 6 6 (3+3) 3/4<br />
<strong>India</strong> 8+2+2 3<br />
S<str<strong>on</strong>g>out</str<strong>on</strong>g>h Africa 6 6 (3+3) 3<br />
Primary<br />
2002/3<br />
Sec<strong>on</strong>dary<br />
2002/3<br />
Tertiary<br />
2002/3<br />
NER (%) GER (%) NER (%) GER (%) GER (%)<br />
Tanzania 77.4 **,z 90.8 z 6.0 a 7.1 a 0.9<br />
Rwanda 86.7 122.0 … 16.1 2.5<br />
Kenya 66.5 92.4 24.5 ** 32.9 2.9 **,y<br />
<strong>Ghana</strong> 59.0 z 83.0 z 36.2 z 42.4 z 3.2 z<br />
<strong>India</strong> 87.5 107.5 … 52.8 11.9<br />
S<str<strong>on</strong>g>out</str<strong>on</strong>g>h Africa 89.0 105.6 65.5 ** 87.7 ** 15.0<br />
S<str<strong>on</strong>g>out</str<strong>on</strong>g>h Africa<br />
and West Asia<br />
82.5 102.0 43.6 49.9 2.4 **,x<br />
SSA 63.5 91.1 22.1 28.4 3.9 **,z<br />
DFID 7