Educating out of Poverty? A Synthesis Report on Ghana, India ... - DfID
Educating out of Poverty? A Synthesis Report on Ghana, India ... - DfID
Educating out of Poverty? A Synthesis Report on Ghana, India ... - DfID

Create successful ePaper yourself
Turn your PDF publications into a flip-book with our unique Google optimized e-Paper software.
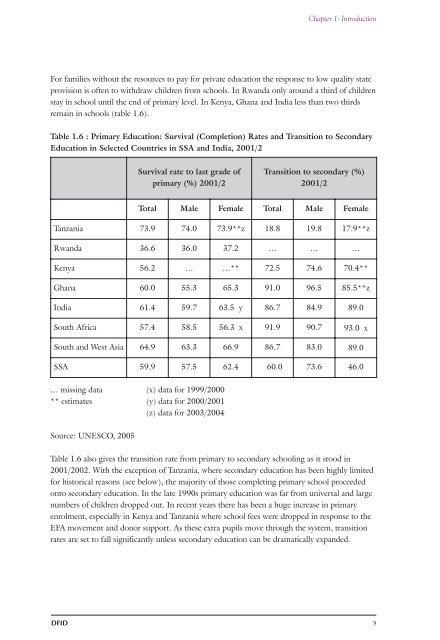
For families with<str<strong>on</strong>g>out</str<strong>on</strong>g> the resources to pay for private educati<strong>on</strong> the resp<strong>on</strong>se to low quality state<br />
provisi<strong>on</strong> is <str<strong>on</strong>g>of</str<strong>on</strong>g>ten to withdraw children from schools. In Rwanda <strong>on</strong>ly around a third <str<strong>on</strong>g>of</str<strong>on</strong>g> children<br />
stay in school until the end <str<strong>on</strong>g>of</str<strong>on</strong>g> primary level. In Kenya, <strong>Ghana</strong> and <strong>India</strong> less than two thirds<br />
remain in schools (table 1.6).<br />
Table 1.6 : Primary Educati<strong>on</strong>: Survival (Completi<strong>on</strong>) Rates and Transiti<strong>on</strong> to Sec<strong>on</strong>dary<br />
Educati<strong>on</strong> in Selected Countries in SSA and <strong>India</strong>, 2001/2<br />
… missing data (x) data for 1999/2000<br />
** estimates (y) data for 2000/2001<br />
(z) data for 2003/2004<br />
Source: UNESCO, 2005<br />
Survival rate to last grade <str<strong>on</strong>g>of</str<strong>on</strong>g><br />
primary (%) 2001/2<br />
Chapter 1: Introducti<strong>on</strong><br />
Transiti<strong>on</strong> to sec<strong>on</strong>dary (%)<br />
2001/2<br />
Total Male Female Total Male Female<br />
Tanzania 73.9 74.0 73.9**z 18.8 19.8 17.9**z<br />
Rwanda 36.6 36.0 37.2 … … …<br />
Kenya 56.2 … …** 72.5 74.6 70.4**<br />
<strong>Ghana</strong> 60.0 55.3 65.3 91.0 96.5 85.5**z<br />
<strong>India</strong> 61.4 59.7 63.5 y 86.7 84.9 89.0<br />
S<str<strong>on</strong>g>out</str<strong>on</strong>g>h Africa 57.4 58.5 56.3 x 91.9 90.7 93.0 x<br />
S<str<strong>on</strong>g>out</str<strong>on</strong>g>h and West Asia 64.9 63.3 66.9 86.7 83.0 89.0<br />
SSA 59.9 57.5 62.4 60.0 73.6 46.0<br />
Table 1.6 also gives the transiti<strong>on</strong> rate from primary to sec<strong>on</strong>dary schooling as it stood in<br />
2001/2002. With the excepti<strong>on</strong> <str<strong>on</strong>g>of</str<strong>on</strong>g> Tanzania, where sec<strong>on</strong>dary educati<strong>on</strong> has been highly limited<br />
for historical reas<strong>on</strong>s (see below), the majority <str<strong>on</strong>g>of</str<strong>on</strong>g> those completing primary school proceeded<br />
<strong>on</strong>to sec<strong>on</strong>dary educati<strong>on</strong>. In the late 1990s primary educati<strong>on</strong> was far from universal and large<br />
numbers <str<strong>on</strong>g>of</str<strong>on</strong>g> children dropped <str<strong>on</strong>g>out</str<strong>on</strong>g>. In recent years there has been a huge increase in primary<br />
enrolment, especially in Kenya and Tanzania where school fees were dropped in resp<strong>on</strong>se to the<br />
EFA movement and d<strong>on</strong>or support. As these extra pupils move through the system, transiti<strong>on</strong><br />
rates are set to fall significantly unless sec<strong>on</strong>dary educati<strong>on</strong> can be dramatically expanded.<br />
DFID 9