Making regression tables simplified
Making regression tables simplified
Making regression tables simplified

You also want an ePaper? Increase the reach of your titles
YUMPU automatically turns print PDFs into web optimized ePapers that Google loves.
Jann 7<br />
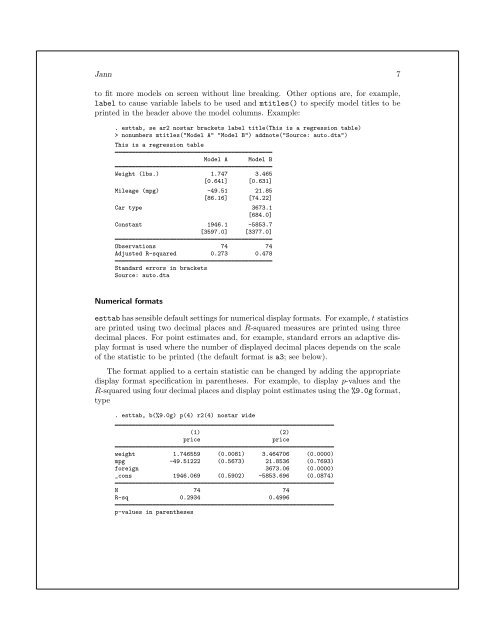
to fit more models on screen without line breaking. Other options are, for example,<br />
label to cause variable labels to be used and mtitles() to specify model titles to be<br />
printed in the header above the model columns. Example:<br />
. esttab, se ar2 nostar brackets label title(This is a <strong>regression</strong> table)<br />
> nonumbers mtitles("Model A" "Model B") addnote("Source: auto.dta")<br />
This is a <strong>regression</strong> table<br />
Model A Model B<br />
Weight (lbs.) 1.747 3.465<br />
[0.641] [0.631]<br />
Mileage (mpg) -49.51 21.85<br />
[86.16] [74.22]<br />
Car type 3673.1<br />
[684.0]<br />
Constant 1946.1 -5853.7<br />
[3597.0] [3377.0]<br />
Observations 74 74<br />
Adjusted R-squared 0.273 0.478<br />
Standard errors in brackets<br />
Source: auto.dta<br />
Numerical formats<br />
esttab has sensible default settings for numerical display formats. For example, t statistics<br />
are printed using two decimal places and R-squared measures are printed using three<br />
decimal places. For point estimates and, for example, standard errors an adaptive display<br />
format is used where the number of displayed decimal places depends on the scale<br />
of the statistic to be printed (the default format is a3; see below).<br />
The format applied to a certain statistic can be changed by adding the appropriate<br />
display format specification in parentheses. For example, to display p-values and the<br />
R-squared using four decimal places and display point estimates using the %9.0g format,<br />
type<br />
. esttab, b(%9.0g) p(4) r2(4) nostar wide<br />
(1) (2)<br />
price price<br />
weight 1.746559 (0.0081) 3.464706 (0.0000)<br />
mpg -49.51222 (0.5673) 21.8536 (0.7693)<br />
foreign 3673.06 (0.0000)<br />
_cons 1946.069 (0.5902) -5853.696 (0.0874)<br />
N 74 74<br />
R-sq 0.2934 0.4996<br />
p-values in parentheses