Making regression tables simplified
Making regression tables simplified
Making regression tables simplified

Create successful ePaper yourself
Turn your PDF publications into a flip-book with our unique Google optimized e-Paper software.
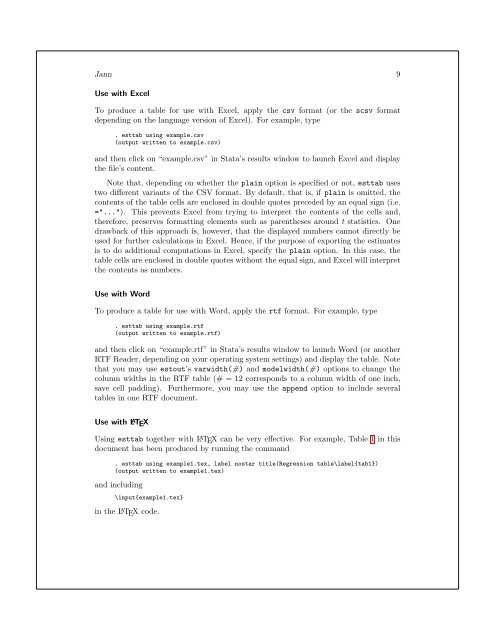
Jann 9<br />
Use with Excel<br />
To produce a table for use with Excel, apply the csv format (or the scsv format<br />
depending on the language version of Excel). For example, type<br />
. esttab using example.csv<br />
(output written to example.csv)<br />
and then click on “example.csv” in Stata’s results window to launch Excel and display<br />
the file’s content.<br />
Note that, depending on whether the plain option is specified or not, esttab uses<br />
two different variants of the CSV format. By default, that is, if plain is omitted, the<br />
contents of the table cells are enclosed in double quotes preceded by an equal sign (i.e.<br />
="..."). This prevents Excel from trying to interpret the contents of the cells and,<br />
therefore, preserves formatting elements such as parentheses around t statistics. One<br />
drawback of this approach is, however, that the displayed numbers cannot directly be<br />
used for further calculations in Excel. Hence, if the purpose of exporting the estimates<br />
is to do additional computations in Excel, specify the plain option. In this case, the<br />
table cells are enclosed in double quotes without the equal sign, and Excel will interpret<br />
the contents as numbers.<br />
Use with Word<br />
To produce a table for use with Word, apply the rtf format. For example, type<br />
. esttab using example.rtf<br />
(output written to example.rtf)<br />
and then click on “example.rtf” in Stata’s results window to launch Word (or another<br />
RTF Reader, depending on your operating system settings) and display the table. Note<br />
that you may use estout’s varwidth(#) and modelwidth(#) options to change the<br />
column widths in the RTF table (# = 12 corresponds to a column width of one inch,<br />
save cell padding). Furthermore, you may use the append option to include several<br />
<strong>tables</strong> in one RTF document.<br />
Use with L ATEX<br />
Using esttab together with L ATEX can be very effective. For example, Table 1 in this<br />
document has been produced by running the command<br />
. esttab using example1.tex, label nostar title(Regression table\label{tab1})<br />
(output written to example1.tex)<br />
and including<br />
\input{example1.tex}<br />
in the L ATEX code.