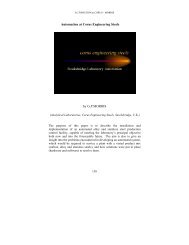
the effect of binder pitch quinoline insolubles content - Coke Oven ...
the effect of binder pitch quinoline insolubles content - Coke Oven ...
the effect of binder pitch quinoline insolubles content - Coke Oven ...

You also want an ePaper? Increase the reach of your titles
YUMPU automatically turns print PDFs into web optimized ePapers that Google loves.
COKE OVEN MANAGERS’ YEAR BOOK<br />
THE EFFECT OF BINDER PITCH QUINOLINE<br />
INSOLUBLES CONTENT ON ALUMINUM ANODE<br />
PHYSICAL PROPERTIES<br />
Robert H. Wombles<br />
Koppers Inc. – Pittsburgh, PA, USA<br />
womblesRH@koppers.com<br />
Barry Sadler<br />
Net Carbon Consulting Pty Ltd – Melbourne, Australia<br />
barry.sadler@bigpond.com.au<br />
This paper was presented to <strong>the</strong> 8 th Australasian Aluminium<br />
Smelting Technology Conference and <strong>the</strong> centre for Electrochemical<br />
and Minerals Processing, University <strong>of</strong> New South Wales.<br />
The Conference was held on 3 – 8 October 2004 at <strong>the</strong> Rydges<br />
Capricorn Resort in Yeppoon, Queensland. We thank <strong>the</strong> authors<br />
and <strong>the</strong> Conference for being able to republish it here.<br />
R H Wombles is Vice President Technology, Koppers, Harmaville<br />
Center, Pitt Way, Pittsburg, USA.<br />
Barry Sadler is Consultant with Net Carbon Consulting Pty Ltd.,<br />
Melbourne, Australia.<br />
Introduction<br />
The first coal chemical recovery ovens were installed in <strong>the</strong> United<br />
States in 1893. By 1915, by-product ovens accounted for 97 % <strong>of</strong><br />
<strong>the</strong> metallurgical coke produced in <strong>the</strong> United States. These byproduct<br />
ovens produced coal tar as one <strong>of</strong> <strong>the</strong> major by-products. An<br />
industry developed around distillation <strong>of</strong> coal tar to produce various<br />
products. One <strong>of</strong> <strong>the</strong> major products produced is coal tar <strong>pitch</strong>.<br />
Since that time, coal tar <strong>pitch</strong> has become <strong>the</strong> <strong>binder</strong> <strong>of</strong> choice for <strong>the</strong><br />
aluminum, commercial carbon, and graphite industries.<br />
119
BINDER PITCH QI CONTENT – ALUMINIUM ANODE<br />
Coal tar <strong>pitch</strong> contains small particles that are insoluble in <strong>the</strong> strong<br />
solvent <strong>quinoline</strong> (hence <strong>the</strong> name Quinoline Insolubles or QI).<br />
These high carbon <strong>content</strong> particles are formed during <strong>the</strong> coking<br />
process by <strong>the</strong> polymerization <strong>of</strong> coal volatiles during <strong>the</strong> high<br />
temperature coking <strong>of</strong> coal in metallurgical coke ovens. QI<br />
formation will be discussed in a later section <strong>of</strong> this paper. During<br />
<strong>the</strong> distillation <strong>of</strong> coal tar almost 100 % <strong>of</strong> <strong>the</strong> QI in <strong>the</strong> tar is<br />
incorporated into <strong>the</strong> coal tar <strong>pitch</strong> product. Over <strong>the</strong> years <strong>the</strong><br />
importance or lack <strong>of</strong> importance <strong>of</strong> QI on <strong>the</strong> quality <strong>of</strong> coal tar<br />
<strong>pitch</strong> for use as a <strong>binder</strong> has been reported in <strong>the</strong> literature. No clear<br />
conclusion regarding <strong>the</strong> importance <strong>of</strong> QI in determining <strong>the</strong> quality<br />
<strong>of</strong> coal tar <strong>pitch</strong> as a <strong>binder</strong> can be drawn from <strong>the</strong>se reports. The<br />
remainder <strong>of</strong> this paper will examine <strong>the</strong> importance <strong>of</strong> QI for coal<br />
tar <strong>pitch</strong> as a <strong>binder</strong>.<br />
Production <strong>of</strong> Coal Tar<br />
Coal tar is produced in a coke oven. <strong>Coke</strong> ovens are built in a series<br />
called a battery. Figure 1 shows a coke oven battery<br />
The coking process involves filling each coke oven with coal,<br />
closing <strong>the</strong> oven after it has been filled, and heating <strong>the</strong> oven to a<br />
temperature <strong>of</strong> approximately 1100°C. A schematic <strong>of</strong> <strong>the</strong> coke<br />
oven process is given in Figure 2.<br />
120
COKE OVEN MANAGERS’ YEAR BOOK<br />
Figure 1. <strong>Coke</strong> <strong>Oven</strong> Battery<br />
Figure 2 – Schematic <strong>of</strong> <strong>Coke</strong> <strong>Oven</strong> Process<br />
121
BINDER PITCH QI CONTENT – ALUMINIUM ANODE<br />
122
COKE OVEN MANAGERS’ YEAR BOOK<br />
As <strong>the</strong> coal is heated, it begins to devolatilize. The volatile products<br />
consist <strong>of</strong> liquid and gaseous products. The gaseous products are<br />
usually utilized as fuel for <strong>the</strong> coke ovens or an associated blast<br />
furnace. The liquid products are condensed and sent to a vessel<br />
called <strong>the</strong> decanter. In <strong>the</strong> decanter <strong>the</strong> large solid particles entrained<br />
in <strong>the</strong> volatiles in <strong>the</strong> coke oven settle to <strong>the</strong> bottom <strong>of</strong> <strong>the</strong> vessel.<br />
The tar is decanted from <strong>the</strong> solids and collected for fur<strong>the</strong>r<br />
processing. As <strong>the</strong> name implies, a coke oven is operated to produce<br />
metallurgical coke for use in a blast furnace. The solid and liquid<br />
products produced are by-products and are not <strong>the</strong> desired products.<br />
Figure 3 gives a material balance for a typical coke oven operation.<br />
As Figure 3 indicates <strong>the</strong> coke oven yields approximately 70 weight<br />
% solid products and 30 weight % gas and liquid products. The<br />
yield <strong>of</strong> coal tar is approximately 5 weight % <strong>of</strong> <strong>the</strong> coal feed. One<br />
component <strong>of</strong> <strong>the</strong> coal tar is <strong>the</strong> QI. The next section will discuss <strong>the</strong><br />
types <strong>of</strong> QI present in coal tar and coal tar <strong>pitch</strong>.<br />
Quinoline Insolubles In Coal Tar<br />
One <strong>of</strong> <strong>the</strong> most discussed components <strong>of</strong> coal tar and coal tar <strong>pitch</strong><br />
is <strong>the</strong> component called QI. The QI <strong>content</strong> <strong>of</strong> coal tar or coal tar<br />
<strong>pitch</strong> is determined by a test method designated as ASTM D 2318.<br />
The test is performed by digesting coal in hot <strong>quinoline</strong> for twenty<br />
minutes followed by filtration <strong>of</strong> <strong>the</strong> hot <strong>quinoline</strong>. The <strong>insolubles</strong><br />
are dried and weighed and <strong>the</strong> QI <strong>content</strong> reported as weight %.<br />
There are two major types <strong>of</strong> QI present in coal tar or coal tar <strong>pitch</strong><br />
as listed in Table 1.<br />
123
BINDER PITCH QI CONTENT – ALUMINIUM ANODE<br />
Table 1 – Types <strong>of</strong> QI<br />
<strong>Coke</strong> <strong>Oven</strong> Derived Thermal Treatment <strong>of</strong> Tar/Pitch<br />
Normal: Mesophase:<br />
~1 µm 4+ µm (ASTM)<br />
Cracking <strong>of</strong> coal volatiles C/H ~2<br />
C/H 3.5 – 5.5 Mesogens:<br />
Carry-Over:
COKE OVEN MANAGERS’ YEAR BOOK<br />
Figure 4 – Scanning Electron Microscope Photo Of Normal QI.<br />
QI present in coal tar or coal tar <strong>pitch</strong> as a result <strong>of</strong> <strong>the</strong>rmal treatment<br />
is called mesophase. The mesophase <strong>content</strong> <strong>of</strong> coal tar or coal tar<br />
<strong>pitch</strong> is determined by a test method designated as ASTM D 4616.<br />
The method involves optical microscopic examination <strong>of</strong> a sample <strong>of</strong><br />
polished <strong>pitch</strong> under cross-polarized light. The mesophase appears<br />
as multicolored spheres. The ASTM method defines mesophase as<br />
any sphere with a size <strong>of</strong> greater than 4 microns. Mesophase has a<br />
much lower carbon to hydrogen ratio than normal QI. Figure 5 gives<br />
a picture <strong>of</strong> mesophase present in coal tar <strong>pitch</strong>.<br />
125
BINDER PITCH QI CONTENT – ALUMINIUM ANODE<br />
Figure 5 – Photograph <strong>of</strong> Mesophase<br />
Modern distillation practices limit <strong>the</strong> amount <strong>of</strong> mesophase formed<br />
in coal tar <strong>pitch</strong>. The remainder <strong>of</strong> this paper will concentrate on <strong>the</strong><br />
<strong>effect</strong> <strong>of</strong> coke oven derived QI on <strong>the</strong> quality <strong>of</strong> a <strong>binder</strong> <strong>pitch</strong>. The<br />
<strong>effect</strong> <strong>of</strong> <strong>the</strong> presence <strong>of</strong> mesophase on <strong>the</strong> <strong>binder</strong> characteristics <strong>of</strong> a<br />
coal tar <strong>pitch</strong> has been <strong>the</strong> subject <strong>of</strong> many publications.<br />
126
COKE OVEN MANAGERS’ YEAR BOOK<br />
As has been discussed, coke oven derived QI is ei<strong>the</strong>r <strong>the</strong> result <strong>of</strong><br />
<strong>the</strong> cracking <strong>of</strong> coal volatiles in <strong>the</strong> coke oven or entrainment <strong>of</strong><br />
larger solids in <strong>the</strong> coal derived volatiles as <strong>the</strong>y are formed. The<br />
large majority <strong>of</strong> <strong>the</strong> coke oven derived QI is normal QI formed by<br />
cracking coal volatiles in <strong>the</strong> coke oven. With <strong>the</strong> large variation <strong>of</strong><br />
<strong>the</strong> QI <strong>content</strong> in coal tar previously discussed, one can assume that<br />
<strong>the</strong> operation <strong>of</strong> <strong>the</strong> coke oven has an <strong>effect</strong> on <strong>the</strong> amount <strong>of</strong> normal<br />
QI in coal tar. The following paragraphs discuss <strong>the</strong> factors which<br />
control <strong>the</strong> amount <strong>of</strong> normal QI formed in <strong>the</strong> coke oven.<br />
Formation <strong>of</strong> Normal QI<br />
A coke oven is operated by heating coal to a temperature <strong>of</strong><br />
approximately 1100°C. As <strong>the</strong> coal is heated, it begins to emit<br />
volatiles. A result <strong>of</strong> <strong>the</strong> loss <strong>of</strong> <strong>the</strong> volatiles is <strong>the</strong> shrinking <strong>of</strong> <strong>the</strong><br />
coal in <strong>the</strong> coke oven. This shrinkage forms a headspace in <strong>the</strong> coke<br />
oven called <strong>the</strong> “tunnel head”. The “tunnel head” acts as a reactor<br />
for <strong>the</strong> formation <strong>of</strong> normal QI. Figure 6 gives a picture <strong>of</strong> a coke<br />
oven “tunnel head”.<br />
Figure 6 gives a picture <strong>of</strong> a coke oven<br />
127
BINDER PITCH QI CONTENT – ALUMINIUM ANODE<br />
The <strong>effect</strong> <strong>of</strong> conditions in <strong>the</strong> “tunnel head” on <strong>the</strong> amount <strong>of</strong><br />
normal QI formed is shown in Figure 7.<br />
16<br />
14<br />
12<br />
10<br />
Effect <strong>of</strong> Tunnel-Head Temperature<br />
on Tar QI Content<br />
8<br />
6<br />
8.0<br />
7.5<br />
7.0<br />
6.5<br />
6.0<br />
5.5<br />
870 900 925 955 980 1010 1035<br />
Tunnel-Head Temp., °C<br />
Effect <strong>of</strong> Coal Bulk Density<br />
on Tar QI<br />
640 655 670 690 705 720 735 750<br />
Bulk Density (Dry, Cone) Kg/m 3<br />
Figure 7 – Tunnel Head Effect on QI Formation<br />
As Figure 7 indicates, <strong>the</strong>re are two major factors which affect <strong>the</strong><br />
amount <strong>of</strong> normal QI which is formed in <strong>the</strong> coke oven. These<br />
factors are <strong>the</strong> temperature in <strong>the</strong> “tunnel head” and <strong>the</strong> bulk density<br />
<strong>of</strong> <strong>the</strong> coal packed in <strong>the</strong> coke oven. The affect <strong>of</strong> temperature is<br />
easy to explain, but <strong>the</strong> affect <strong>of</strong> <strong>the</strong> bulk density <strong>of</strong> <strong>the</strong> coal is not as<br />
128
COKE OVEN MANAGERS’ YEAR BOOK<br />
obvious. As mentioned previously, <strong>the</strong> formation <strong>of</strong> QI is a result <strong>of</strong><br />
<strong>the</strong>rmal cracking and polymerization <strong>of</strong> <strong>the</strong> coal volatiles in <strong>the</strong><br />
“tunnel head”. Therefore, it follows that an increase in temperature<br />
in <strong>the</strong> “tunnel head” would increase cracking and polymerization<br />
resulting in an increase in <strong>the</strong> amount <strong>of</strong> QI formed. The bulk<br />
density <strong>of</strong> <strong>the</strong> coal in <strong>the</strong> coke oven is inversely related to <strong>the</strong> size <strong>of</strong><br />
<strong>the</strong> “tunnel head”. Therefore, as <strong>the</strong> bulk density <strong>of</strong> <strong>the</strong> coal in <strong>the</strong><br />
coke oven decreases <strong>the</strong> size <strong>of</strong> <strong>the</strong> “tunnel head” increases. As <strong>the</strong><br />
size <strong>of</strong> <strong>the</strong> “tunnel head” increases, <strong>the</strong> residence time <strong>of</strong> <strong>the</strong> coal<br />
volatiles in <strong>the</strong> “tunnel head” increases.<br />
Increased residence time results in increased coal volatiles cracking<br />
and polymerization giving an increase in QI formation.<br />
Production <strong>of</strong> Coal Tar Pitch<br />
Coal tar <strong>pitch</strong> is produced by distilling coal tar. The distillation can<br />
be performed in ei<strong>the</strong>r a batch or continuous mode. Modern coal tar<br />
distillation is performed using continuous vacuum distillation, which<br />
reduces <strong>the</strong> <strong>the</strong>rmal exposure <strong>of</strong> <strong>pitch</strong> reducing <strong>the</strong> chances <strong>of</strong><br />
mesophase formation. A schematic <strong>of</strong> <strong>the</strong> coal tar distillation<br />
process is given in Figure 8.<br />
Coal tar distillation produces three major distillation products<br />
1) chemical oil,<br />
2) distillate,<br />
3) <strong>pitch</strong><br />
. Figure 9 summarizes <strong>the</strong> yields <strong>of</strong> <strong>the</strong>se distillation products from<br />
distillation <strong>of</strong> a typical coal tar.<br />
129
BINDER PITCH QI CONTENT – ALUMINIUM ANODE<br />
Figure 8 – Coal Tar Distillation Process<br />
20%<br />
%<br />
50%<br />
Figure 9 – Coal Tar Distillation Fractions<br />
130<br />
Chemical Oil<br />
Distillates<br />
Pitch
COKE OVEN MANAGERS’ YEAR BOOK<br />
As Figure 9 indicates, <strong>the</strong> yield <strong>of</strong> coal tar <strong>pitch</strong> from a typical coal<br />
tar is approximately 50 wt. %. Since <strong>the</strong> QI in <strong>the</strong> tar is not volatile<br />
and will not distill, almost 100 % <strong>of</strong> <strong>the</strong> QI in <strong>the</strong> tar remains in <strong>the</strong><br />
<strong>pitch</strong> product. With <strong>the</strong> yield <strong>of</strong> <strong>pitch</strong> being 50 wt. % <strong>of</strong> <strong>the</strong> tar, a<br />
good rule <strong>of</strong> thumb is that <strong>the</strong> <strong>pitch</strong> QI <strong>content</strong> is double that <strong>of</strong> <strong>the</strong><br />
coal tar QI <strong>content</strong>.<br />
Effect Of Pitch QI Content On Binder Quality<br />
The question that has been asked for many years is “What is <strong>the</strong><br />
<strong>effect</strong> <strong>of</strong> <strong>pitch</strong> QI <strong>content</strong> on <strong>the</strong> <strong>binder</strong> quality <strong>of</strong> <strong>the</strong> <strong>pitch</strong>?” This<br />
question has been discussed many times in publications with no<br />
definitive answer given. This study addressed <strong>the</strong> question by<br />
conducting a literature survey and performing a laboratory scale<br />
anode study. The results <strong>of</strong> <strong>the</strong>se are discussed in <strong>the</strong> remainder <strong>of</strong><br />
this paper.<br />
Literature Survey<br />
Green anodes consist <strong>of</strong> calcined coke and recycled anode butt filler<br />
particles coated with <strong>binder</strong> <strong>pitch</strong>, with <strong>the</strong> <strong>binder</strong> in this coating<br />
penetrating porosity in <strong>the</strong> filler down to a size <strong>of</strong> about 5µm and<br />
largely filling <strong>the</strong> interstices between <strong>the</strong> filler particles. During <strong>the</strong><br />
anode baking process <strong>the</strong> <strong>pitch</strong> is carbonised to <strong>binder</strong> coke. This<br />
transformation has several stages [1]:<br />
Anode temperature ( o C) Pitch transformation<br />
Thermal expansion with <strong>the</strong><br />
0 - 200<br />
release <strong>of</strong> stresses induced<br />
during forming and cooling<br />
Redistribution <strong>of</strong> <strong>pitch</strong> into voids<br />
by <strong>pitch</strong> expansion leading to<br />
150 - 350<br />
fur<strong>the</strong>r <strong>pitch</strong> impregnation <strong>of</strong> <strong>the</strong><br />
filler aggregate<br />
350 - 450 Release <strong>of</strong> light <strong>pitch</strong> volatiles<br />
131
BINDER PITCH QI CONTENT – ALUMINIUM ANODE<br />
450 – 600<br />
600 - 900<br />
900 - 1200<br />
132<br />
Coking – Formation and growth<br />
<strong>of</strong> mesophase leading to <strong>the</strong><br />
transition from a plastic to a<br />
solid <strong>binder</strong> matrix. The <strong>binder</strong><br />
coke forms “bridges” between<br />
<strong>the</strong> filler particles. Release <strong>of</strong> <strong>the</strong><br />
major amount <strong>of</strong> non-coking<br />
volatiles.<br />
Post coking – Release <strong>of</strong> heavy<br />
cracked volatiles, methane, and<br />
hydrogen. Annealing <strong>of</strong> tensions<br />
in <strong>the</strong> coked structure<br />
Crystalline re-orientation and<br />
growth <strong>of</strong> <strong>the</strong> <strong>binder</strong> carbon and<br />
possibly <strong>the</strong> lowest calcined<br />
filler coke.<br />
The formation and growth <strong>of</strong> mesophase in <strong>the</strong> <strong>binder</strong> <strong>pitch</strong> has a<br />
strong influence on anode properties [2]. If mesophase can grow and<br />
coalesce unhindered, <strong>the</strong> resulting <strong>binder</strong> coke will be well ordered<br />
with an anisotropic “flow” optical texture when examined under a<br />
microscope using cross-polarised light. Anisotropic <strong>binder</strong> cokes<br />
tend to reduce <strong>the</strong> electrical resistivity and reactivity <strong>of</strong> <strong>the</strong> anode;<br />
however <strong>the</strong> anode strength can also be reduced due to cleavage<br />
between <strong>the</strong> layers in <strong>the</strong> structure [2]. Disruption <strong>of</strong> mesophase<br />
development results in a more disordered or isotropic coke structure<br />
that imparts greater strength to <strong>the</strong> anode. The influence <strong>of</strong> normal<br />
QI on this carbonization process, and hence anode properties,<br />
has been studied extensively. A feature <strong>of</strong> <strong>the</strong>se studies, however is<br />
wide disagreement on what <strong>the</strong> <strong>effect</strong> is <strong>of</strong> varying amounts <strong>of</strong><br />
normal QI on <strong>binder</strong> <strong>pitch</strong> performance.<br />
A review <strong>of</strong> <strong>the</strong> literature shows that <strong>the</strong> following have been<br />
attributed to <strong>the</strong> presence <strong>of</strong> normal QI in <strong>pitch</strong>:<br />
Wetting <strong>of</strong> <strong>the</strong> filler particles: There is disagreement as to whe<strong>the</strong>r<br />
normal QI improves <strong>the</strong> coating <strong>of</strong> petroleum coke particles by <strong>pitch</strong><br />
[3,4], makes it worse [5,6] or has no influence [7].
COKE OVEN MANAGERS’ YEAR BOOK<br />
Controls <strong>the</strong> penetration <strong>of</strong> <strong>pitch</strong> into coke porosity by forming a<br />
filter cake at <strong>the</strong> pore entrance. [2,3,8,9]. This filter cake <strong>of</strong> normal<br />
QI carbonizes to a tough, strong carbon imparting strength to <strong>the</strong><br />
coke/<strong>pitch</strong> interface.<br />
Provides a pathway for <strong>the</strong> release <strong>of</strong> volatiles from <strong>the</strong> <strong>binder</strong><br />
during baking [3,4].<br />
Increases <strong>the</strong> coking value <strong>of</strong> <strong>pitch</strong> due to its own high coking value<br />
[3]<br />
There is general agreement that <strong>the</strong> presence <strong>of</strong> normal QI increases<br />
<strong>the</strong> amount <strong>of</strong> disorder (isotropy) in <strong>the</strong> <strong>binder</strong> coke<br />
[2,3,5,8,10,11,12,13]; however how this isotropy is achieved is not<br />
agreed:<br />
One view is that normal QI influences <strong>the</strong> chemistry <strong>of</strong> <strong>the</strong><br />
carbonization process by acting as a site for mesophase nucleation<br />
[3,14], <strong>the</strong>reby increasing <strong>the</strong> coking value <strong>of</strong> <strong>pitch</strong> beyond <strong>the</strong><br />
contribution <strong>of</strong> its own coking value; or by acting as a cross linking<br />
agent to reduce <strong>the</strong> size <strong>of</strong> <strong>the</strong> <strong>binder</strong> coke optical texture [11,13]. It<br />
has also been reported that normal QI slows <strong>the</strong> carbonization<br />
process up to temperatures <strong>of</strong> 850 – 900 o C [15].<br />
The alternative viewpoint suggests that <strong>the</strong> influence <strong>of</strong> normal QI<br />
on <strong>the</strong> carbonization process is only physical, i.e. <strong>the</strong> normal QI acts<br />
as additional aggregate particles [2,5,12,16,17,18] that are physically<br />
absorbed onto <strong>the</strong> surface <strong>of</strong> <strong>the</strong> growing mesophase, inhibiting <strong>the</strong>ir<br />
ability to grow by coalescence [2,3,10,12]. This results in pockets <strong>of</strong><br />
high normal QI and isotropic carbon in a more anisotropic <strong>binder</strong><br />
matrix.<br />
Greater levels <strong>of</strong> normal QI, increase <strong>the</strong> anode optimum <strong>pitch</strong><br />
requirement [5,14,19,20,21]. This is due to <strong>the</strong> normal QI particles<br />
being wet by, and hence <strong>effect</strong>ively consuming, liquid <strong>pitch</strong> and by<br />
<strong>the</strong>se particles taking up volume in <strong>the</strong> <strong>binder</strong> that could o<strong>the</strong>rwise<br />
be occupied by liquid <strong>pitch</strong>. The reported increase in optimum <strong>pitch</strong><br />
requirements is about 0.1% for each additional 1% <strong>of</strong> normal QI in<br />
<strong>the</strong> <strong>binder</strong> [5].<br />
133
BINDER PITCH QI CONTENT – ALUMINIUM ANODE<br />
Increasing <strong>the</strong> amount <strong>of</strong> normal QI in <strong>pitch</strong> has been found to have<br />
<strong>the</strong> following <strong>effect</strong>s on anode properties:<br />
Baked density – increase [6,16,17,23], decrease [14], or not strongly<br />
influenced [20,24]<br />
Strength - increase [2,6,8,13,16, 17,21,23,25], or little change<br />
[14,19]<br />
Electrical resistivity – increase [2,8,17], decrease [6], or little change<br />
[19,20,21]<br />
Air Permeability – decrease [6] or little change [19]<br />
Coefficient <strong>of</strong> <strong>the</strong>rmal expansion – increase [22]<br />
Reactivity – increase [2,8,15,17,25,26], little change [19,21,23,27]<br />
Sodium sensitivity – decreases [25]<br />
Anode consumption – little change [20,21,23,27]<br />
While <strong>the</strong>re is a lot <strong>of</strong> variation in <strong>the</strong>se reported anode property<br />
results, it is worth noting that in virtually all <strong>of</strong> <strong>the</strong> studies reviewed<br />
(covering normal QI levels from 1 – 20%) <strong>the</strong> measured anode<br />
properties were in <strong>the</strong> typical ranges for each test. Several studies<br />
showed clear evidence or included <strong>the</strong> comment that low (e.g.
COKE OVEN MANAGERS’ YEAR BOOK<br />
Table 2 – Physical Properties <strong>of</strong> Pitches in Anode Study<br />
Property<br />
S<strong>of</strong>tening<br />
Point, °C<br />
Quinoline<br />
Insolubles,<br />
wt.%<br />
Toluene<br />
Insolubles,<br />
wt.%<br />
Beta<br />
Resins,<br />
wt.%<br />
Coking<br />
Value,<br />
wt.%<br />
Density,<br />
g/cc<br />
3.8% 5.6% 10.1% 16.1% 20.0% 24.3%<br />
QI QI QI QI QI QI<br />
112 110 112 111 107 107<br />
3.8 5.6 10.1 16.1 20.0 24.3<br />
20.3 22.1 25.6 29.5 33.5 37.4<br />
16.4 16.5 15.5 13.1 13.5 13.1<br />
53.8 51.9 56.2 57.5 59.7 60.5<br />
1.30 1.25 1.33 1.34 1.35 1.36<br />
Sized coke received from a United States smelter was mixed using<br />
<strong>the</strong> following standard anode coke formation:<br />
Coarse 31.5 %<br />
Intermediate 14.6 %<br />
Fines 37.0 %<br />
Butts 16.9 %<br />
A series <strong>of</strong> cylindrical laboratory size anodes (10.2 cm in diameter<br />
and 15.2 cm in height) was prepared using each <strong>of</strong> <strong>the</strong> six <strong>pitch</strong>es.<br />
The details <strong>of</strong> <strong>the</strong> anode mixing, molding, and baking protocol are<br />
given in Table 3.<br />
135
BINDER PITCH QI CONTENT – ALUMINIUM ANODE<br />
Table 3 – Anode Production Protocol<br />
Mixing and Molding Conditions<br />
Materials Not Preheated<br />
Mixing Time 19-25 Minutes<br />
Mixing Temperature 159-163°C<br />
Molding Temperature 149-153°C<br />
Vibrating Time 65 Seconds<br />
Baking Protocol:<br />
0-600°C 10°C/hr<br />
600-1170°C 25°C/hr<br />
1170°C 14 hr hold<br />
Center Retort Temperature 1100-1120°C<br />
After baking, <strong>the</strong> anodes were cored and <strong>the</strong> cores were tested for ten<br />
typical anode properties. Plots <strong>of</strong> <strong>the</strong> results <strong>of</strong> <strong>the</strong> testing are given<br />
in Figures 10-19. As <strong>the</strong> plots indicate, <strong>the</strong> anode properties are<br />
quite consistent considering <strong>the</strong> wide range <strong>of</strong> QI <strong>content</strong> <strong>pitch</strong>es.<br />
136
g/cc<br />
Vol. %<br />
COKE OVEN MANAGERS’ YEAR BOOK<br />
Green Apparent Density<br />
1.680<br />
1.660<br />
1.640<br />
1.620<br />
1.600<br />
1.580<br />
1.560<br />
1.540<br />
1.520<br />
13 14 15 16 17 18 19<br />
% Pitch<br />
5.6% QI Pitch 10.1% QI Pitch 24.3% QI Pitch 20.0% QI Pitch<br />
16.1% QI Pitch 3.9% QI Pitch<br />
Figure 10. Green Apparent Density<br />
Shrinkage<br />
2.50<br />
2.00<br />
1.50<br />
1.00<br />
0.50<br />
0.00<br />
-0.50<br />
-1.00<br />
-1.50<br />
-2.00<br />
13 14 15 16 17 18 19<br />
% Pitch<br />
5.6% QI Pitch 10.1% QI Pitch 16.1% QI Pitch<br />
20.0% QI Pitch 24.3% QI Pitch 3.9% QI Pitch<br />
Figure 11. Shrinkage<br />
137
g/cc<br />
nPm<br />
1.600<br />
1.580<br />
1.560<br />
1.540<br />
1.520<br />
1.500<br />
BINDER PITCH QI CONTENT – ALUMINIUM ANODE<br />
Core Baked Apparent Density<br />
1.480<br />
13 14 15 16<br />
% Pitch<br />
17 18 19<br />
5.6% QI Pitch 10.1% QI Pitch 16.1% QI Pitch 20.0% QI Pitch<br />
24.3% QI Pitch 3.9% QI Pitch<br />
2.50<br />
2.00<br />
1.50<br />
1.00<br />
0.50<br />
Figure 12. Core Baked Apparent Density<br />
Air Permeability<br />
0.00<br />
13 14 15 16<br />
% Pitch<br />
17 18 19<br />
5.6% QI Pitch 10.1% QI Pitch 16.1% QI Pitch 20.0% QI Pitch<br />
24.3% QI Pitch 3.9% QI Pitch<br />
Figure 13. Air Permeability<br />
138
% Residue<br />
% Residue<br />
COKE OVEN MANAGERS’ YEAR BOOK<br />
Air Reactivity<br />
85.00<br />
80.00<br />
75.00<br />
70.00<br />
65.00<br />
60.00<br />
55.00<br />
50.00<br />
45.00<br />
40.00<br />
13 14 15 16 17 18 19<br />
% Pitch<br />
5.6% QI Pitch 10.1% QI Pitch 16.1% QI Pitch 20.0% QI Pitch<br />
24.3% QI Pitch 3.9% QI Pitch<br />
96<br />
94<br />
92<br />
90<br />
88<br />
86<br />
Figure 14. Air Reactivity<br />
CO2 Reactivity<br />
84<br />
13 14 15 16<br />
% Pitch<br />
17 18 19<br />
5.6% QI Pitch 10.1% QI Pitch 24.3% QI Pitch 20.0% QI Pitch<br />
16.1% QI Pitch 3.9% QI Pitch<br />
Figure 15. CO2 Reactivity<br />
139
µ - Ohms / m<br />
W / m-K<br />
BINDER PITCH QI CONTENT – ALUMINIUM ANODE<br />
Electrical Resistivity<br />
120.0<br />
110.0<br />
100.0<br />
90.0<br />
80.0<br />
70.0<br />
60.0<br />
50.0<br />
40.0<br />
13 14 15 16 17 18 19<br />
% Pitch<br />
5.6% QI Pitch 10.1% QI Pitch 16.1% QI Pitch 20.0% QI Pitch<br />
24.3% QI Pitch 3.9% QI Pitch<br />
Figure 16. Electrical Resistivity<br />
Thermal Conductivity<br />
3.10<br />
2.90<br />
2.70<br />
2.50<br />
2.30<br />
2.10<br />
1.90<br />
1.70<br />
1.50<br />
13 14 15 16 17 18 19<br />
% Pitch<br />
3.9% QI Pitch 5.6% QI Pitch 10.1% QI Pitch 16.1% QI Pitch<br />
20.0% QI Pitch 24.3% QI Pitch 3.9% QI Pitch<br />
Figure 17. Thermal Conductivity<br />
140
Avg. Alpha * 10 -6 (@300° C)<br />
Mpa<br />
4.700<br />
4.500<br />
4.300<br />
4.100<br />
3.900<br />
3.700<br />
COKE OVEN MANAGERS’ YEAR BOOK<br />
Coefficient <strong>of</strong> Thermal Expansion<br />
3.500<br />
13 14 15 16<br />
% Pitch<br />
17 18 19<br />
5.6% QI Pitch 10.1% QI Pitch 16.1% QI Pitch 20.0% QI Pitch<br />
24.3% QI Pitch 3.9% QI Pitch<br />
Figure 18. Coefficient <strong>of</strong> Thermal Expansion<br />
Flexural Strength<br />
14.00<br />
12.00<br />
10.00<br />
8.00<br />
6.00<br />
4.00<br />
2.00<br />
0.00<br />
13 14 15 16 17 18 19<br />
% Pitch<br />
5.6% QI Pitch 10.1% QI Pitch 16.1% QI Pitch 20.0% QI Pitch<br />
24.3% QI Pitch 3.9% QI Pitch<br />
Figure 19. Flexural Strength<br />
141
BINDER PITCH QI CONTENT – ALUMINIUM ANODE<br />
Table 4 gives <strong>the</strong> same ten anodes properties at optimum baked<br />
anode density. Again a comparison <strong>of</strong> <strong>the</strong> ten anode properties<br />
indicates quite consistent properties.<br />
Green<br />
Apparent<br />
Density<br />
Table 4. Optimized Anode Properties<br />
Pitch<br />
Level<br />
QI<br />
3.9<br />
wt.%<br />
142<br />
QI<br />
5.6<br />
wt.%<br />
QI<br />
10.1<br />
wt.%<br />
QI<br />
16.1<br />
wt.%<br />
QI<br />
20.0<br />
wt.%<br />
QI<br />
24.3<br />
wt.%<br />
15 16 16 17 18 18<br />
g/cc 1.614 1.630 1.621 1.641 1.646 1.633<br />
Shrinkage Vol. % 0.65 -0.24 1.27 0.68 0.84 1.11<br />
Baked<br />
Apparent<br />
Density<br />
Air<br />
Permeability<br />
Air<br />
Reactivity<br />
CO2<br />
Reactivity<br />
Electrical<br />
Resistivity<br />
Thermal<br />
Conductivity<br />
Coefficient<br />
<strong>of</strong> Thermal<br />
Expansion<br />
Flexural<br />
Strength<br />
g/cc 1.544 1.551 1.569 1.569 1.580 1.581<br />
nPm 0.45 0.54 0.32 0.73 0.30 0.25<br />
%<br />
Residue<br />
%<br />
Residue<br />
µ<br />
Ohms/m<br />
68.09 64.50 74.25 76.80 74.00 81.50<br />
88.96 84.80 92.22 94.10 94.20 92.80<br />
61.9 64.7 58.2 60.1 58.1 60.9<br />
W/mK 2.64 2.52 2.85 2.72 2.77 2.75<br />
*10^-6<br />
@300°C<br />
3.759 4.297 4.469 4.443 4.564 4.404<br />
MPa 6.08 5.31 6.87 6.49 7.70 5.92
Conclusions<br />
COKE OVEN MANAGERS’ YEAR BOOK<br />
Despite all <strong>of</strong> <strong>the</strong> contradictions in <strong>the</strong> literature studied, we can<br />
draw some conclusions:<br />
Good quality anode carbon requires a balanced optical texture in <strong>the</strong><br />
<strong>binder</strong> coke bridges that bond filler particles toge<strong>the</strong>r – it should be<br />
sufficiently isotropic (i.e. disordered) to give <strong>the</strong> anode <strong>the</strong> required<br />
mechanical properties, most notably sufficient strength; but with<br />
enough anisotropy (order) to give acceptable levels <strong>of</strong> reactivity and<br />
electrical conductivity.<br />
Quite fortuitously, <strong>the</strong> presence <strong>of</strong> normal QI in <strong>pitch</strong> delivers such a<br />
heterogeneous structure. Normal QI physically inhibits <strong>the</strong><br />
coalescence <strong>of</strong> mesophase by absorbing on to <strong>the</strong>ir surface during<br />
anode baking. As <strong>the</strong> mesophase grows, <strong>the</strong>y push <strong>the</strong> normal QI<br />
into pockets – <strong>the</strong>se pockets <strong>of</strong> isotropy in <strong>the</strong> baked anode impart<br />
<strong>the</strong> necessary strength to <strong>the</strong> <strong>binder</strong> coke bridges. The remaining<br />
matrix <strong>of</strong> <strong>binder</strong> coke, which is still relatively anisotropic, gives <strong>the</strong><br />
<strong>binder</strong> coke bridges <strong>the</strong> desired reactivity and electrical resistivity<br />
properties.<br />
Since anodes made from 0% normal QI <strong>pitch</strong> have been found to<br />
have unacceptable anode properties [28], it is reasonable to assume<br />
that <strong>the</strong>re will be a minimum normal QI level, below which <strong>the</strong><br />
concentration <strong>of</strong> normal QI will be too low to deliver this desirable<br />
heterogeneous anode structure.<br />
The results <strong>of</strong> <strong>the</strong> studies reviewed suggest that this minimum<br />
normal QI level is less than 2% and may be as low as 1%. This needs<br />
to be confirmed experimentally.<br />
In several <strong>of</strong> <strong>the</strong> studies, reducing normal QI levels from >10% to<br />
BINDER PITCH QI CONTENT – ALUMINIUM ANODE<br />
Although a number <strong>of</strong> different “ideal” ranges are given in <strong>the</strong><br />
literature for normal QI levels [4,13,14,21,28], however most <strong>of</strong><br />
<strong>the</strong>se are based on historical results. As normal QI levels have come<br />
down, so has <strong>the</strong> bottom limit <strong>of</strong> <strong>the</strong> ideal ranges – when put to <strong>the</strong><br />
test, <strong>the</strong> lower normal QI <strong>pitch</strong>es have performed acceptably.<br />
The situation is well described in [4]: “The importance <strong>of</strong> normal QI<br />
in <strong>binder</strong> <strong>pitch</strong> is well established. However, <strong>the</strong>re is some<br />
disagreement as to <strong>the</strong> optimal <strong>content</strong>” and “……..<strong>the</strong> amount <strong>of</strong><br />
normal QI must be consistent”<br />
The anode study conducted did not reveal anything that would<br />
contradict <strong>the</strong> concept that acceptable anodes can be produced with<br />
<strong>pitch</strong>es with as little as 3.9 wt. % normal QI. The lower Baked<br />
Apparent Density at lower normal QI levels warrants fur<strong>the</strong>r<br />
attention as <strong>the</strong>re is potential to improve this through modification <strong>of</strong><br />
<strong>the</strong> anode formulation process [5].<br />
References<br />
1 T. Foosnaes & T Naterstad, Carbon: basics and principles, In<br />
Introduction to Aluminium Electrolysis, 2 nd Ed. (Aluminium<br />
Verlag, Dusseldorf, 1993), 87 – 134.<br />
2 H. Marsh, Carbon anodes for Aluminium – Manufacture,<br />
Structure and Properties, Proc. CIM Annual Conference <strong>of</strong><br />
Metallurgists, 1986, 63 – 86.<br />
3 R. Gray & K. Krupinski, Pitch Production, In Introduction to<br />
carbon technologies (Alicante: Universidad,1997), 329 – 424<br />
4 K. Krupinski & J. Windfelder, Effects <strong>of</strong> tar Quinoline<br />
Insolubles on manufactured carbon performance, Proc.<br />
Ironmaking Conference, 1992, 487 – 492.<br />
5 K. Hulse, Anode Manufacture – raw materials, formulation and<br />
processing parameters, PhD Thesis Univ. <strong>of</strong> Auckland, New<br />
Zealand, (R&D Carbon Ltd, Sierre, Switzerland), 2000.<br />
6 W. Roder, The future <strong>of</strong> coal tar <strong>pitch</strong> and alternative <strong>pitch</strong>es for<br />
carbon electrodes, CIM Light Metals 1998, 1998 171 – 182.<br />
7 A. Mirchi, G. Savard, J-P, Tremblay, & M. Simard, Alcan<br />
characterization <strong>of</strong> <strong>pitch</strong> performance for <strong>pitch</strong> <strong>binder</strong> evaluation<br />
144
COKE OVEN MANAGERS’ YEAR BOOK<br />
and process changes in an aluminium smelter, Light Metals<br />
2002, 2002, 525 – 534.<br />
8 C. Latham & H. Marsh, Anodes for aluminium production, Proc<br />
Carbon 86, 4 th Int. Carbon Conf., Baden Baden, 1986, 802 –<br />
803.<br />
9 C. Latham & H. Marsh, Structure and porosity in anodes for<br />
aluminium production, Proc 17 th Biennial Conf. on Carbon, Ext<br />
Abs, 1985, 462 – 463.<br />
10 K. Kuo, H. Marsh & D. Broughton, Influence <strong>of</strong> primary QI and<br />
particulate matter on <strong>pitch</strong> carbonizations, Fuel, Vol. 66,<br />
November,1987, 1544 – 1551.<br />
11 S. Jones & E. Bart, Binder for <strong>the</strong> ideal anode carbon, Light<br />
Metals 1990, 1990, 611 – 628.<br />
12 K. Kuo, H. Marsh, D. Broughton & I Edwards, Primary and<br />
secondary QI materials in <strong>pitch</strong>, Lecture notes, NCRL,<br />
University <strong>of</strong> Newcastle upon Tyne, UK.<br />
13 S. Jones & E. Bart, The role <strong>of</strong> primary Quinoline Insolubles in<br />
<strong>pitch</strong>-coke bond formation in anode carbon, Light Metals 1990,<br />
1990, 609 – 613.<br />
14 A. Alsher, R. Wildforster & J. Sharp, Performance <strong>of</strong> <strong>binder</strong><br />
<strong>pitch</strong>es with decreased QI-<strong>content</strong> in anode making – Formation,<br />
nature, properties and substitution <strong>of</strong> Quinoline Insolubles, Light<br />
Metals 1990, 1990, 583 – 590.<br />
15 N. Turner, Tracking <strong>the</strong> behaviour <strong>of</strong> <strong>pitch</strong> at elevated<br />
temperature, Light Metals 1995, 1995, 573 – 581.<br />
16 J. Saint Romain, P. Lagassie, R. Bertau & B. Souffrey, QI in<br />
coal tar <strong>pitch</strong>es – Part 1: Investigation <strong>of</strong> coke oven parameters<br />
acting on tar characteristics, Light Metals 1990, 1990, 591 –<br />
596.<br />
17 W. Boenigk, A. Nieh<strong>of</strong>f & R. Wildforster, Influence <strong>of</strong> QI<br />
<strong>content</strong> on <strong>binder</strong> <strong>pitch</strong> performance, Light Metals 1991, 1991,<br />
615 – 620.<br />
18 N. Turner, The influence <strong>of</strong> <strong>pitch</strong> QI particle type and size on<br />
anode quality – The volatiles emitted from bench scale anodes<br />
during baking, Light Metals 1992, 1992, 571 – 580.<br />
19 Tar industry services, A study <strong>of</strong> <strong>the</strong> rheological performance <strong>of</strong><br />
<strong>binder</strong> <strong>pitch</strong>es derived from modern coke-oven by-product tars,<br />
European Commission Technical Coal Research Contract No.<br />
7720-EC/840, 1992.<br />
145
BINDER PITCH QI CONTENT – ALUMINIUM ANODE<br />
20 L. Lavigne, Effect <strong>of</strong> Quinoline Insolubles (QI) in coal tar <strong>pitch</strong><br />
on laboratory test anodes, Light metals processing and<br />
applications, 1999, 143 – 148.<br />
21 P. Rhedey, Laboratory evaluation <strong>of</strong> a low Quinoline Insolubles<br />
coal-tar <strong>pitch</strong> as anode <strong>binder</strong>, Light Metals 1990, 1990, 605 –<br />
608.<br />
22 H. Tillmans, Carbonisation <strong>of</strong> <strong>pitch</strong>, Fuel, Vol. 64, Sept., 1985,<br />
1197 – 1203.<br />
23 N. Turner, The influence <strong>of</strong> <strong>pitch</strong> QI <strong>content</strong> and type on<br />
Aluminium smelting anode properties, IOP Publishing, 1988,<br />
470 – 472.<br />
24 D. Belitskus & W. Hill, Properties <strong>of</strong> bench scale anodes<br />
produced using <strong>binder</strong> <strong>pitch</strong>es varying in primary and secondary<br />
QI <strong>content</strong>s, Light Metals 1990, 1990, 577 – 582.<br />
25 M. Smith, R. Perruchoud & W. Fischer, Evaluating <strong>pitch</strong><br />
behaviour in prebaked anodes by analysis <strong>of</strong> <strong>the</strong> <strong>binder</strong> matrix,<br />
Aluminium, 68, Jan., 1992, 326 – 329.<br />
26 J. Patrick, The influence <strong>of</strong> <strong>pitch</strong> quality on anode carbon<br />
gasification, European Commission Technical Coal Research<br />
Contract No. 7220-EC/851, 1998.<br />
27 N. Steward & P. Halley, The <strong>effect</strong> <strong>of</strong> <strong>pitch</strong> type and QI <strong>content</strong><br />
on <strong>the</strong> processing and performance <strong>of</strong> carbon anodes – <strong>the</strong><br />
conversion <strong>of</strong> a smelter to a medium QI, vacuum distilled <strong>pitch</strong><br />
source, Light Metals 1994, 1994, 517 – 524.<br />
28 N. Turner, Improvements in anode <strong>binder</strong> <strong>pitch</strong>es by advances in<br />
raw materials handling, manufacturing and transportation, Light<br />
Metals 1990, 1990, 629 – 638.<br />
146