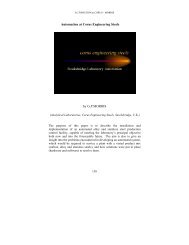
the effect of binder pitch quinoline insolubles content - Coke Oven ...
the effect of binder pitch quinoline insolubles content - Coke Oven ...
the effect of binder pitch quinoline insolubles content - Coke Oven ...

Create successful ePaper yourself
Turn your PDF publications into a flip-book with our unique Google optimized e-Paper software.
COKE OVEN MANAGERS’ YEAR BOOK<br />
THE EFFECT OF BINDER PITCH QUINOLINE<br />
INSOLUBLES CONTENT ON ALUMINUM ANODE<br />
PHYSICAL PROPERTIES<br />
Robert H. Wombles<br />
Koppers Inc. – Pittsburgh, PA, USA<br />
womblesRH@koppers.com<br />
Barry Sadler<br />
Net Carbon Consulting Pty Ltd – Melbourne, Australia<br />
barry.sadler@bigpond.com.au<br />
This paper was presented to <strong>the</strong> 8 th Australasian Aluminium<br />
Smelting Technology Conference and <strong>the</strong> centre for Electrochemical<br />
and Minerals Processing, University <strong>of</strong> New South Wales.<br />
The Conference was held on 3 – 8 October 2004 at <strong>the</strong> Rydges<br />
Capricorn Resort in Yeppoon, Queensland. We thank <strong>the</strong> authors<br />
and <strong>the</strong> Conference for being able to republish it here.<br />
R H Wombles is Vice President Technology, Koppers, Harmaville<br />
Center, Pitt Way, Pittsburg, USA.<br />
Barry Sadler is Consultant with Net Carbon Consulting Pty Ltd.,<br />
Melbourne, Australia.<br />
Introduction<br />
The first coal chemical recovery ovens were installed in <strong>the</strong> United<br />
States in 1893. By 1915, by-product ovens accounted for 97 % <strong>of</strong><br />
<strong>the</strong> metallurgical coke produced in <strong>the</strong> United States. These byproduct<br />
ovens produced coal tar as one <strong>of</strong> <strong>the</strong> major by-products. An<br />
industry developed around distillation <strong>of</strong> coal tar to produce various<br />
products. One <strong>of</strong> <strong>the</strong> major products produced is coal tar <strong>pitch</strong>.<br />
Since that time, coal tar <strong>pitch</strong> has become <strong>the</strong> <strong>binder</strong> <strong>of</strong> choice for <strong>the</strong><br />
aluminum, commercial carbon, and graphite industries.<br />
119
BINDER PITCH QI CONTENT – ALUMINIUM ANODE<br />
Coal tar <strong>pitch</strong> contains small particles that are insoluble in <strong>the</strong> strong<br />
solvent <strong>quinoline</strong> (hence <strong>the</strong> name Quinoline Insolubles or QI).<br />
These high carbon <strong>content</strong> particles are formed during <strong>the</strong> coking<br />
process by <strong>the</strong> polymerization <strong>of</strong> coal volatiles during <strong>the</strong> high<br />
temperature coking <strong>of</strong> coal in metallurgical coke ovens. QI<br />
formation will be discussed in a later section <strong>of</strong> this paper. During<br />
<strong>the</strong> distillation <strong>of</strong> coal tar almost 100 % <strong>of</strong> <strong>the</strong> QI in <strong>the</strong> tar is<br />
incorporated into <strong>the</strong> coal tar <strong>pitch</strong> product. Over <strong>the</strong> years <strong>the</strong><br />
importance or lack <strong>of</strong> importance <strong>of</strong> QI on <strong>the</strong> quality <strong>of</strong> coal tar<br />
<strong>pitch</strong> for use as a <strong>binder</strong> has been reported in <strong>the</strong> literature. No clear<br />
conclusion regarding <strong>the</strong> importance <strong>of</strong> QI in determining <strong>the</strong> quality<br />
<strong>of</strong> coal tar <strong>pitch</strong> as a <strong>binder</strong> can be drawn from <strong>the</strong>se reports. The<br />
remainder <strong>of</strong> this paper will examine <strong>the</strong> importance <strong>of</strong> QI for coal<br />
tar <strong>pitch</strong> as a <strong>binder</strong>.<br />
Production <strong>of</strong> Coal Tar<br />
Coal tar is produced in a coke oven. <strong>Coke</strong> ovens are built in a series<br />
called a battery. Figure 1 shows a coke oven battery<br />
The coking process involves filling each coke oven with coal,<br />
closing <strong>the</strong> oven after it has been filled, and heating <strong>the</strong> oven to a<br />
temperature <strong>of</strong> approximately 1100°C. A schematic <strong>of</strong> <strong>the</strong> coke<br />
oven process is given in Figure 2.<br />
120
COKE OVEN MANAGERS’ YEAR BOOK<br />
Figure 1. <strong>Coke</strong> <strong>Oven</strong> Battery<br />
Figure 2 – Schematic <strong>of</strong> <strong>Coke</strong> <strong>Oven</strong> Process<br />
121
BINDER PITCH QI CONTENT – ALUMINIUM ANODE<br />
122
COKE OVEN MANAGERS’ YEAR BOOK<br />
As <strong>the</strong> coal is heated, it begins to devolatilize. The volatile products<br />
consist <strong>of</strong> liquid and gaseous products. The gaseous products are<br />
usually utilized as fuel for <strong>the</strong> coke ovens or an associated blast<br />
furnace. The liquid products are condensed and sent to a vessel<br />
called <strong>the</strong> decanter. In <strong>the</strong> decanter <strong>the</strong> large solid particles entrained<br />
in <strong>the</strong> volatiles in <strong>the</strong> coke oven settle to <strong>the</strong> bottom <strong>of</strong> <strong>the</strong> vessel.<br />
The tar is decanted from <strong>the</strong> solids and collected for fur<strong>the</strong>r<br />
processing. As <strong>the</strong> name implies, a coke oven is operated to produce<br />
metallurgical coke for use in a blast furnace. The solid and liquid<br />
products produced are by-products and are not <strong>the</strong> desired products.<br />
Figure 3 gives a material balance for a typical coke oven operation.<br />
As Figure 3 indicates <strong>the</strong> coke oven yields approximately 70 weight<br />
% solid products and 30 weight % gas and liquid products. The<br />
yield <strong>of</strong> coal tar is approximately 5 weight % <strong>of</strong> <strong>the</strong> coal feed. One<br />
component <strong>of</strong> <strong>the</strong> coal tar is <strong>the</strong> QI. The next section will discuss <strong>the</strong><br />
types <strong>of</strong> QI present in coal tar and coal tar <strong>pitch</strong>.<br />
Quinoline Insolubles In Coal Tar<br />
One <strong>of</strong> <strong>the</strong> most discussed components <strong>of</strong> coal tar and coal tar <strong>pitch</strong><br />
is <strong>the</strong> component called QI. The QI <strong>content</strong> <strong>of</strong> coal tar or coal tar<br />
<strong>pitch</strong> is determined by a test method designated as ASTM D 2318.<br />
The test is performed by digesting coal in hot <strong>quinoline</strong> for twenty<br />
minutes followed by filtration <strong>of</strong> <strong>the</strong> hot <strong>quinoline</strong>. The <strong>insolubles</strong><br />
are dried and weighed and <strong>the</strong> QI <strong>content</strong> reported as weight %.<br />
There are two major types <strong>of</strong> QI present in coal tar or coal tar <strong>pitch</strong><br />
as listed in Table 1.<br />
123
BINDER PITCH QI CONTENT – ALUMINIUM ANODE<br />
Table 1 – Types <strong>of</strong> QI<br />
<strong>Coke</strong> <strong>Oven</strong> Derived Thermal Treatment <strong>of</strong> Tar/Pitch<br />
Normal: Mesophase:<br />
~1 µm 4+ µm (ASTM)<br />
Cracking <strong>of</strong> coal volatiles C/H ~2<br />
C/H 3.5 – 5.5 Mesogens:<br />
Carry-Over:
COKE OVEN MANAGERS’ YEAR BOOK<br />
Figure 4 – Scanning Electron Microscope Photo Of Normal QI.<br />
QI present in coal tar or coal tar <strong>pitch</strong> as a result <strong>of</strong> <strong>the</strong>rmal treatment<br />
is called mesophase. The mesophase <strong>content</strong> <strong>of</strong> coal tar or coal tar<br />
<strong>pitch</strong> is determined by a test method designated as ASTM D 4616.<br />
The method involves optical microscopic examination <strong>of</strong> a sample <strong>of</strong><br />
polished <strong>pitch</strong> under cross-polarized light. The mesophase appears<br />
as multicolored spheres. The ASTM method defines mesophase as<br />
any sphere with a size <strong>of</strong> greater than 4 microns. Mesophase has a<br />
much lower carbon to hydrogen ratio than normal QI. Figure 5 gives<br />
a picture <strong>of</strong> mesophase present in coal tar <strong>pitch</strong>.<br />
125
BINDER PITCH QI CONTENT – ALUMINIUM ANODE<br />
Figure 5 – Photograph <strong>of</strong> Mesophase<br />
Modern distillation practices limit <strong>the</strong> amount <strong>of</strong> mesophase formed<br />
in coal tar <strong>pitch</strong>. The remainder <strong>of</strong> this paper will concentrate on <strong>the</strong><br />
<strong>effect</strong> <strong>of</strong> coke oven derived QI on <strong>the</strong> quality <strong>of</strong> a <strong>binder</strong> <strong>pitch</strong>. The<br />
<strong>effect</strong> <strong>of</strong> <strong>the</strong> presence <strong>of</strong> mesophase on <strong>the</strong> <strong>binder</strong> characteristics <strong>of</strong> a<br />
coal tar <strong>pitch</strong> has been <strong>the</strong> subject <strong>of</strong> many publications.<br />
126
COKE OVEN MANAGERS’ YEAR BOOK<br />
As has been discussed, coke oven derived QI is ei<strong>the</strong>r <strong>the</strong> result <strong>of</strong><br />
<strong>the</strong> cracking <strong>of</strong> coal volatiles in <strong>the</strong> coke oven or entrainment <strong>of</strong><br />
larger solids in <strong>the</strong> coal derived volatiles as <strong>the</strong>y are formed. The<br />
large majority <strong>of</strong> <strong>the</strong> coke oven derived QI is normal QI formed by<br />
cracking coal volatiles in <strong>the</strong> coke oven. With <strong>the</strong> large variation <strong>of</strong><br />
<strong>the</strong> QI <strong>content</strong> in coal tar previously discussed, one can assume that<br />
<strong>the</strong> operation <strong>of</strong> <strong>the</strong> coke oven has an <strong>effect</strong> on <strong>the</strong> amount <strong>of</strong> normal<br />
QI in coal tar. The following paragraphs discuss <strong>the</strong> factors which<br />
control <strong>the</strong> amount <strong>of</strong> normal QI formed in <strong>the</strong> coke oven.<br />
Formation <strong>of</strong> Normal QI<br />
A coke oven is operated by heating coal to a temperature <strong>of</strong><br />
approximately 1100°C. As <strong>the</strong> coal is heated, it begins to emit<br />
volatiles. A result <strong>of</strong> <strong>the</strong> loss <strong>of</strong> <strong>the</strong> volatiles is <strong>the</strong> shrinking <strong>of</strong> <strong>the</strong><br />
coal in <strong>the</strong> coke oven. This shrinkage forms a headspace in <strong>the</strong> coke<br />
oven called <strong>the</strong> “tunnel head”. The “tunnel head” acts as a reactor<br />
for <strong>the</strong> formation <strong>of</strong> normal QI. Figure 6 gives a picture <strong>of</strong> a coke<br />
oven “tunnel head”.<br />
Figure 6 gives a picture <strong>of</strong> a coke oven<br />
127
BINDER PITCH QI CONTENT – ALUMINIUM ANODE<br />
The <strong>effect</strong> <strong>of</strong> conditions in <strong>the</strong> “tunnel head” on <strong>the</strong> amount <strong>of</strong><br />
normal QI formed is shown in Figure 7.<br />
16<br />
14<br />
12<br />
10<br />
Effect <strong>of</strong> Tunnel-Head Temperature<br />
on Tar QI Content<br />
8<br />
6<br />
8.0<br />
7.5<br />
7.0<br />
6.5<br />
6.0<br />
5.5<br />
870 900 925 955 980 1010 1035<br />
Tunnel-Head Temp., °C<br />
Effect <strong>of</strong> Coal Bulk Density<br />
on Tar QI<br />
640 655 670 690 705 720 735 750<br />
Bulk Density (Dry, Cone) Kg/m 3<br />
Figure 7 – Tunnel Head Effect on QI Formation<br />
As Figure 7 indicates, <strong>the</strong>re are two major factors which affect <strong>the</strong><br />
amount <strong>of</strong> normal QI which is formed in <strong>the</strong> coke oven. These<br />
factors are <strong>the</strong> temperature in <strong>the</strong> “tunnel head” and <strong>the</strong> bulk density<br />
<strong>of</strong> <strong>the</strong> coal packed in <strong>the</strong> coke oven. The affect <strong>of</strong> temperature is<br />
easy to explain, but <strong>the</strong> affect <strong>of</strong> <strong>the</strong> bulk density <strong>of</strong> <strong>the</strong> coal is not as<br />
128
COKE OVEN MANAGERS’ YEAR BOOK<br />
obvious. As mentioned previously, <strong>the</strong> formation <strong>of</strong> QI is a result <strong>of</strong><br />
<strong>the</strong>rmal cracking and polymerization <strong>of</strong> <strong>the</strong> coal volatiles in <strong>the</strong><br />
“tunnel head”. Therefore, it follows that an increase in temperature<br />
in <strong>the</strong> “tunnel head” would increase cracking and polymerization<br />
resulting in an increase in <strong>the</strong> amount <strong>of</strong> QI formed. The bulk<br />
density <strong>of</strong> <strong>the</strong> coal in <strong>the</strong> coke oven is inversely related to <strong>the</strong> size <strong>of</strong><br />
<strong>the</strong> “tunnel head”. Therefore, as <strong>the</strong> bulk density <strong>of</strong> <strong>the</strong> coal in <strong>the</strong><br />
coke oven decreases <strong>the</strong> size <strong>of</strong> <strong>the</strong> “tunnel head” increases. As <strong>the</strong><br />
size <strong>of</strong> <strong>the</strong> “tunnel head” increases, <strong>the</strong> residence time <strong>of</strong> <strong>the</strong> coal<br />
volatiles in <strong>the</strong> “tunnel head” increases.<br />
Increased residence time results in increased coal volatiles cracking<br />
and polymerization giving an increase in QI formation.<br />
Production <strong>of</strong> Coal Tar Pitch<br />
Coal tar <strong>pitch</strong> is produced by distilling coal tar. The distillation can<br />
be performed in ei<strong>the</strong>r a batch or continuous mode. Modern coal tar<br />
distillation is performed using continuous vacuum distillation, which<br />
reduces <strong>the</strong> <strong>the</strong>rmal exposure <strong>of</strong> <strong>pitch</strong> reducing <strong>the</strong> chances <strong>of</strong><br />
mesophase formation. A schematic <strong>of</strong> <strong>the</strong> coal tar distillation<br />
process is given in Figure 8.<br />
Coal tar distillation produces three major distillation products<br />
1) chemical oil,<br />
2) distillate,<br />
3) <strong>pitch</strong><br />
. Figure 9 summarizes <strong>the</strong> yields <strong>of</strong> <strong>the</strong>se distillation products from<br />
distillation <strong>of</strong> a typical coal tar.<br />
129
BINDER PITCH QI CONTENT – ALUMINIUM ANODE<br />
Figure 8 – Coal Tar Distillation Process<br />
20%<br />
%<br />
50%<br />
Figure 9 – Coal Tar Distillation Fractions<br />
130<br />
Chemical Oil<br />
Distillates<br />
Pitch
COKE OVEN MANAGERS’ YEAR BOOK<br />
As Figure 9 indicates, <strong>the</strong> yield <strong>of</strong> coal tar <strong>pitch</strong> from a typical coal<br />
tar is approximately 50 wt. %. Since <strong>the</strong> QI in <strong>the</strong> tar is not volatile<br />
and will not distill, almost 100 % <strong>of</strong> <strong>the</strong> QI in <strong>the</strong> tar remains in <strong>the</strong><br />
<strong>pitch</strong> product. With <strong>the</strong> yield <strong>of</strong> <strong>pitch</strong> being 50 wt. % <strong>of</strong> <strong>the</strong> tar, a<br />
good rule <strong>of</strong> thumb is that <strong>the</strong> <strong>pitch</strong> QI <strong>content</strong> is double that <strong>of</strong> <strong>the</strong><br />
coal tar QI <strong>content</strong>.<br />
Effect Of Pitch QI Content On Binder Quality<br />
The question that has been asked for many years is “What is <strong>the</strong><br />
<strong>effect</strong> <strong>of</strong> <strong>pitch</strong> QI <strong>content</strong> on <strong>the</strong> <strong>binder</strong> quality <strong>of</strong> <strong>the</strong> <strong>pitch</strong>?” This<br />
question has been discussed many times in publications with no<br />
definitive answer given. This study addressed <strong>the</strong> question by<br />
conducting a literature survey and performing a laboratory scale<br />
anode study. The results <strong>of</strong> <strong>the</strong>se are discussed in <strong>the</strong> remainder <strong>of</strong><br />
this paper.<br />
Literature Survey<br />
Green anodes consist <strong>of</strong> calcined coke and recycled anode butt filler<br />
particles coated with <strong>binder</strong> <strong>pitch</strong>, with <strong>the</strong> <strong>binder</strong> in this coating<br />
penetrating porosity in <strong>the</strong> filler down to a size <strong>of</strong> about 5µm and<br />
largely filling <strong>the</strong> interstices between <strong>the</strong> filler particles. During <strong>the</strong><br />
anode baking process <strong>the</strong> <strong>pitch</strong> is carbonised to <strong>binder</strong> coke. This<br />
transformation has several stages [1]:<br />
Anode temperature ( o C) Pitch transformation<br />
Thermal expansion with <strong>the</strong><br />
0 - 200<br />
release <strong>of</strong> stresses induced<br />
during forming and cooling<br />
Redistribution <strong>of</strong> <strong>pitch</strong> into voids<br />
by <strong>pitch</strong> expansion leading to<br />
150 - 350<br />
fur<strong>the</strong>r <strong>pitch</strong> impregnation <strong>of</strong> <strong>the</strong><br />
filler aggregate<br />
350 - 450 Release <strong>of</strong> light <strong>pitch</strong> volatiles<br />
131
BINDER PITCH QI CONTENT – ALUMINIUM ANODE<br />
450 – 600<br />
600 - 900<br />
900 - 1200<br />
132<br />
Coking – Formation and growth<br />
<strong>of</strong> mesophase leading to <strong>the</strong><br />
transition from a plastic to a<br />
solid <strong>binder</strong> matrix. The <strong>binder</strong><br />
coke forms “bridges” between<br />
<strong>the</strong> filler particles. Release <strong>of</strong> <strong>the</strong><br />
major amount <strong>of</strong> non-coking<br />
volatiles.<br />
Post coking – Release <strong>of</strong> heavy<br />
cracked volatiles, methane, and<br />
hydrogen. Annealing <strong>of</strong> tensions<br />
in <strong>the</strong> coked structure<br />
Crystalline re-orientation and<br />
growth <strong>of</strong> <strong>the</strong> <strong>binder</strong> carbon and<br />
possibly <strong>the</strong> lowest calcined<br />
filler coke.<br />
The formation and growth <strong>of</strong> mesophase in <strong>the</strong> <strong>binder</strong> <strong>pitch</strong> has a<br />
strong influence on anode properties [2]. If mesophase can grow and<br />
coalesce unhindered, <strong>the</strong> resulting <strong>binder</strong> coke will be well ordered<br />
with an anisotropic “flow” optical texture when examined under a<br />
microscope using cross-polarised light. Anisotropic <strong>binder</strong> cokes<br />
tend to reduce <strong>the</strong> electrical resistivity and reactivity <strong>of</strong> <strong>the</strong> anode;<br />
however <strong>the</strong> anode strength can also be reduced due to cleavage<br />
between <strong>the</strong> layers in <strong>the</strong> structure [2]. Disruption <strong>of</strong> mesophase<br />
development results in a more disordered or isotropic coke structure<br />
that imparts greater strength to <strong>the</strong> anode. The influence <strong>of</strong> normal<br />
QI on this carbonization process, and hence anode properties,<br />
has been studied extensively. A feature <strong>of</strong> <strong>the</strong>se studies, however is<br />
wide disagreement on what <strong>the</strong> <strong>effect</strong> is <strong>of</strong> varying amounts <strong>of</strong><br />
normal QI on <strong>binder</strong> <strong>pitch</strong> performance.<br />
A review <strong>of</strong> <strong>the</strong> literature shows that <strong>the</strong> following have been<br />
attributed to <strong>the</strong> presence <strong>of</strong> normal QI in <strong>pitch</strong>:<br />
Wetting <strong>of</strong> <strong>the</strong> filler particles: There is disagreement as to whe<strong>the</strong>r<br />
normal QI improves <strong>the</strong> coating <strong>of</strong> petroleum coke particles by <strong>pitch</strong><br />
[3,4], makes it worse [5,6] or has no influence [7].
COKE OVEN MANAGERS’ YEAR BOOK<br />
Controls <strong>the</strong> penetration <strong>of</strong> <strong>pitch</strong> into coke porosity by forming a<br />
filter cake at <strong>the</strong> pore entrance. [2,3,8,9]. This filter cake <strong>of</strong> normal<br />
QI carbonizes to a tough, strong carbon imparting strength to <strong>the</strong><br />
coke/<strong>pitch</strong> interface.<br />
Provides a pathway for <strong>the</strong> release <strong>of</strong> volatiles from <strong>the</strong> <strong>binder</strong><br />
during baking [3,4].<br />
Increases <strong>the</strong> coking value <strong>of</strong> <strong>pitch</strong> due to its own high coking value<br />
[3]<br />
There is general agreement that <strong>the</strong> presence <strong>of</strong> normal QI increases<br />
<strong>the</strong> amount <strong>of</strong> disorder (isotropy) in <strong>the</strong> <strong>binder</strong> coke<br />
[2,3,5,8,10,11,12,13]; however how this isotropy is achieved is not<br />
agreed:<br />
One view is that normal QI influences <strong>the</strong> chemistry <strong>of</strong> <strong>the</strong><br />
carbonization process by acting as a site for mesophase nucleation<br />
[3,14], <strong>the</strong>reby increasing <strong>the</strong> coking value <strong>of</strong> <strong>pitch</strong> beyond <strong>the</strong><br />
contribution <strong>of</strong> its own coking value; or by acting as a cross linking<br />
agent to reduce <strong>the</strong> size <strong>of</strong> <strong>the</strong> <strong>binder</strong> coke optical texture [11,13]. It<br />
has also been reported that normal QI slows <strong>the</strong> carbonization<br />
process up to temperatures <strong>of</strong> 850 – 900 o C [15].<br />
The alternative viewpoint suggests that <strong>the</strong> influence <strong>of</strong> normal QI<br />
on <strong>the</strong> carbonization process is only physical, i.e. <strong>the</strong> normal QI acts<br />
as additional aggregate particles [2,5,12,16,17,18] that are physically<br />
absorbed onto <strong>the</strong> surface <strong>of</strong> <strong>the</strong> growing mesophase, inhibiting <strong>the</strong>ir<br />
ability to grow by coalescence [2,3,10,12]. This results in pockets <strong>of</strong><br />
high normal QI and isotropic carbon in a more anisotropic <strong>binder</strong><br />
matrix.<br />
Greater levels <strong>of</strong> normal QI, increase <strong>the</strong> anode optimum <strong>pitch</strong><br />
requirement [5,14,19,20,21]. This is due to <strong>the</strong> normal QI particles<br />
being wet by, and hence <strong>effect</strong>ively consuming, liquid <strong>pitch</strong> and by<br />
<strong>the</strong>se particles taking up volume in <strong>the</strong> <strong>binder</strong> that could o<strong>the</strong>rwise<br />
be occupied by liquid <strong>pitch</strong>. The reported increase in optimum <strong>pitch</strong><br />
requirements is about 0.1% for each additional 1% <strong>of</strong> normal QI in<br />
<strong>the</strong> <strong>binder</strong> [5].<br />
133
BINDER PITCH QI CONTENT – ALUMINIUM ANODE<br />
Increasing <strong>the</strong> amount <strong>of</strong> normal QI in <strong>pitch</strong> has been found to have<br />
<strong>the</strong> following <strong>effect</strong>s on anode properties:<br />
Baked density – increase [6,16,17,23], decrease [14], or not strongly<br />
influenced [20,24]<br />
Strength - increase [2,6,8,13,16, 17,21,23,25], or little change<br />
[14,19]<br />
Electrical resistivity – increase [2,8,17], decrease [6], or little change<br />
[19,20,21]<br />
Air Permeability – decrease [6] or little change [19]<br />
Coefficient <strong>of</strong> <strong>the</strong>rmal expansion – increase [22]<br />
Reactivity – increase [2,8,15,17,25,26], little change [19,21,23,27]<br />
Sodium sensitivity – decreases [25]<br />
Anode consumption – little change [20,21,23,27]<br />
While <strong>the</strong>re is a lot <strong>of</strong> variation in <strong>the</strong>se reported anode property<br />
results, it is worth noting that in virtually all <strong>of</strong> <strong>the</strong> studies reviewed<br />
(covering normal QI levels from 1 – 20%) <strong>the</strong> measured anode<br />
properties were in <strong>the</strong> typical ranges for each test. Several studies<br />
showed clear evidence or included <strong>the</strong> comment that low (e.g.
COKE OVEN MANAGERS’ YEAR BOOK<br />
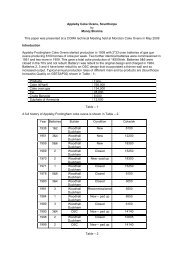
Table 2 – Physical Properties <strong>of</strong> Pitches in Anode Study<br />
Property<br />
S<strong>of</strong>tening<br />
Point, °C<br />
Quinoline<br />
Insolubles,<br />
wt.%<br />
Toluene<br />
Insolubles,<br />
wt.%<br />
Beta<br />
Resins,<br />
wt.%<br />
Coking<br />
Value,<br />
wt.%<br />
Density,<br />
g/cc<br />
3.8% 5.6% 10.1% 16.1% 20.0% 24.3%<br />
QI QI QI QI QI QI<br />
112 110 112 111 107 107<br />
3.8 5.6 10.1 16.1 20.0 24.3<br />
20.3 22.1 25.6 29.5 33.5 37.4<br />
16.4 16.5 15.5 13.1 13.5 13.1<br />
53.8 51.9 56.2 57.5 59.7 60.5<br />
1.30 1.25 1.33 1.34 1.35 1.36<br />
Sized coke received from a United States smelter was mixed using<br />
<strong>the</strong> following standard anode coke formation:<br />
Coarse 31.5 %<br />
Intermediate 14.6 %<br />
Fines 37.0 %<br />
Butts 16.9 %<br />
A series <strong>of</strong> cylindrical laboratory size anodes (10.2 cm in diameter<br />
and 15.2 cm in height) was prepared using each <strong>of</strong> <strong>the</strong> six <strong>pitch</strong>es.<br />
The details <strong>of</strong> <strong>the</strong> anode mixing, molding, and baking protocol are<br />
given in Table 3.<br />
135
BINDER PITCH QI CONTENT – ALUMINIUM ANODE<br />
Table 3 – Anode Production Protocol<br />
Mixing and Molding Conditions<br />
Materials Not Preheated<br />
Mixing Time 19-25 Minutes<br />
Mixing Temperature 159-163°C<br />
Molding Temperature 149-153°C<br />
Vibrating Time 65 Seconds<br />
Baking Protocol:<br />
0-600°C 10°C/hr<br />
600-1170°C 25°C/hr<br />
1170°C 14 hr hold<br />
Center Retort Temperature 1100-1120°C<br />
After baking, <strong>the</strong> anodes were cored and <strong>the</strong> cores were tested for ten<br />
typical anode properties. Plots <strong>of</strong> <strong>the</strong> results <strong>of</strong> <strong>the</strong> testing are given<br />
in Figures 10-19. As <strong>the</strong> plots indicate, <strong>the</strong> anode properties are<br />
quite consistent considering <strong>the</strong> wide range <strong>of</strong> QI <strong>content</strong> <strong>pitch</strong>es.<br />
136
g/cc<br />
Vol. %<br />
COKE OVEN MANAGERS’ YEAR BOOK<br />
Green Apparent Density<br />
1.680<br />
1.660<br />
1.640<br />
1.620<br />
1.600<br />
1.580<br />
1.560<br />
1.540<br />
1.520<br />
13 14 15 16 17 18 19<br />
% Pitch<br />
5.6% QI Pitch 10.1% QI Pitch 24.3% QI Pitch 20.0% QI Pitch<br />
16.1% QI Pitch 3.9% QI Pitch<br />
Figure 10. Green Apparent Density<br />
Shrinkage<br />
2.50<br />
2.00<br />
1.50<br />
1.00<br />
0.50<br />
0.00<br />
-0.50<br />
-1.00<br />
-1.50<br />
-2.00<br />
13 14 15 16 17 18 19<br />
% Pitch<br />
5.6% QI Pitch 10.1% QI Pitch 16.1% QI Pitch<br />
20.0% QI Pitch 24.3% QI Pitch 3.9% QI Pitch<br />
Figure 11. Shrinkage<br />
137
g/cc<br />
nPm<br />
1.600<br />
1.580<br />
1.560<br />
1.540<br />
1.520<br />
1.500<br />
BINDER PITCH QI CONTENT – ALUMINIUM ANODE<br />
Core Baked Apparent Density<br />
1.480<br />
13 14 15 16<br />
% Pitch<br />
17 18 19<br />
5.6% QI Pitch 10.1% QI Pitch 16.1% QI Pitch 20.0% QI Pitch<br />
24.3% QI Pitch 3.9% QI Pitch<br />
2.50<br />
2.00<br />
1.50<br />
1.00<br />
0.50<br />
Figure 12. Core Baked Apparent Density<br />
Air Permeability<br />
0.00<br />
13 14 15 16<br />
% Pitch<br />
17 18 19<br />
5.6% QI Pitch 10.1% QI Pitch 16.1% QI Pitch 20.0% QI Pitch<br />
24.3% QI Pitch 3.9% QI Pitch<br />
Figure 13. Air Permeability<br />
138
% Residue<br />
% Residue<br />
COKE OVEN MANAGERS’ YEAR BOOK<br />
Air Reactivity<br />
85.00<br />
80.00<br />
75.00<br />
70.00<br />
65.00<br />
60.00<br />
55.00<br />
50.00<br />
45.00<br />
40.00<br />
13 14 15 16 17 18 19<br />
% Pitch<br />
5.6% QI Pitch 10.1% QI Pitch 16.1% QI Pitch 20.0% QI Pitch<br />
24.3% QI Pitch 3.9% QI Pitch<br />
96<br />
94<br />
92<br />
90<br />
88<br />
86<br />
Figure 14. Air Reactivity<br />
CO2 Reactivity<br />
84<br />
13 14 15 16<br />
% Pitch<br />
17 18 19<br />
5.6% QI Pitch 10.1% QI Pitch 24.3% QI Pitch 20.0% QI Pitch<br />
16.1% QI Pitch 3.9% QI Pitch<br />
Figure 15. CO2 Reactivity<br />
139
µ - Ohms / m<br />
W / m-K<br />
BINDER PITCH QI CONTENT – ALUMINIUM ANODE<br />
Electrical Resistivity<br />
120.0<br />
110.0<br />
100.0<br />
90.0<br />
80.0<br />
70.0<br />
60.0<br />
50.0<br />
40.0<br />
13 14 15 16 17 18 19<br />
% Pitch<br />
5.6% QI Pitch 10.1% QI Pitch 16.1% QI Pitch 20.0% QI Pitch<br />
24.3% QI Pitch 3.9% QI Pitch<br />
Figure 16. Electrical Resistivity<br />
Thermal Conductivity<br />
3.10<br />
2.90<br />
2.70<br />
2.50<br />
2.30<br />
2.10<br />
1.90<br />
1.70<br />
1.50<br />
13 14 15 16 17 18 19<br />
% Pitch<br />
3.9% QI Pitch 5.6% QI Pitch 10.1% QI Pitch 16.1% QI Pitch<br />
20.0% QI Pitch 24.3% QI Pitch 3.9% QI Pitch<br />
Figure 17. Thermal Conductivity<br />
140
Avg. Alpha * 10 -6 (@300° C)<br />
Mpa<br />
4.700<br />
4.500<br />
4.300<br />
4.100<br />
3.900<br />
3.700<br />
COKE OVEN MANAGERS’ YEAR BOOK<br />
Coefficient <strong>of</strong> Thermal Expansion<br />
3.500<br />
13 14 15 16<br />
% Pitch<br />
17 18 19<br />
5.6% QI Pitch 10.1% QI Pitch 16.1% QI Pitch 20.0% QI Pitch<br />
24.3% QI Pitch 3.9% QI Pitch<br />
Figure 18. Coefficient <strong>of</strong> Thermal Expansion<br />
Flexural Strength<br />
14.00<br />
12.00<br />
10.00<br />
8.00<br />
6.00<br />
4.00<br />
2.00<br />
0.00<br />
13 14 15 16 17 18 19<br />
% Pitch<br />
5.6% QI Pitch 10.1% QI Pitch 16.1% QI Pitch 20.0% QI Pitch<br />
24.3% QI Pitch 3.9% QI Pitch<br />
Figure 19. Flexural Strength<br />
141
BINDER PITCH QI CONTENT – ALUMINIUM ANODE<br />
Table 4 gives <strong>the</strong> same ten anodes properties at optimum baked<br />
anode density. Again a comparison <strong>of</strong> <strong>the</strong> ten anode properties<br />
indicates quite consistent properties.<br />
Green<br />
Apparent<br />
Density<br />
Table 4. Optimized Anode Properties<br />
Pitch<br />
Level<br />
QI<br />
3.9<br />
wt.%<br />
142<br />
QI<br />
5.6<br />
wt.%<br />
QI<br />
10.1<br />
wt.%<br />
QI<br />
16.1<br />
wt.%<br />
QI<br />
20.0<br />
wt.%<br />
QI<br />
24.3<br />
wt.%<br />
15 16 16 17 18 18<br />
g/cc 1.614 1.630 1.621 1.641 1.646 1.633<br />
Shrinkage Vol. % 0.65 -0.24 1.27 0.68 0.84 1.11<br />
Baked<br />
Apparent<br />
Density<br />
Air<br />
Permeability<br />
Air<br />
Reactivity<br />
CO2<br />
Reactivity<br />
Electrical<br />
Resistivity<br />
Thermal<br />
Conductivity<br />
Coefficient<br />
<strong>of</strong> Thermal<br />
Expansion<br />
Flexural<br />
Strength<br />
g/cc 1.544 1.551 1.569 1.569 1.580 1.581<br />
nPm 0.45 0.54 0.32 0.73 0.30 0.25<br />
%<br />
Residue<br />
%<br />
Residue<br />
µ<br />
Ohms/m<br />
68.09 64.50 74.25 76.80 74.00 81.50<br />
88.96 84.80 92.22 94.10 94.20 92.80<br />
61.9 64.7 58.2 60.1 58.1 60.9<br />
W/mK 2.64 2.52 2.85 2.72 2.77 2.75<br />
*10^-6<br />
@300°C<br />
3.759 4.297 4.469 4.443 4.564 4.404<br />
MPa 6.08 5.31 6.87 6.49 7.70 5.92
Conclusions<br />
COKE OVEN MANAGERS’ YEAR BOOK<br />
Despite all <strong>of</strong> <strong>the</strong> contradictions in <strong>the</strong> literature studied, we can<br />
draw some conclusions:<br />
Good quality anode carbon requires a balanced optical texture in <strong>the</strong><br />
<strong>binder</strong> coke bridges that bond filler particles toge<strong>the</strong>r – it should be<br />
sufficiently isotropic (i.e. disordered) to give <strong>the</strong> anode <strong>the</strong> required<br />
mechanical properties, most notably sufficient strength; but with<br />
enough anisotropy (order) to give acceptable levels <strong>of</strong> reactivity and<br />
electrical conductivity.<br />
Quite fortuitously, <strong>the</strong> presence <strong>of</strong> normal QI in <strong>pitch</strong> delivers such a<br />
heterogeneous structure. Normal QI physically inhibits <strong>the</strong><br />
coalescence <strong>of</strong> mesophase by absorbing on to <strong>the</strong>ir surface during<br />
anode baking. As <strong>the</strong> mesophase grows, <strong>the</strong>y push <strong>the</strong> normal QI<br />
into pockets – <strong>the</strong>se pockets <strong>of</strong> isotropy in <strong>the</strong> baked anode impart<br />
<strong>the</strong> necessary strength to <strong>the</strong> <strong>binder</strong> coke bridges. The remaining<br />
matrix <strong>of</strong> <strong>binder</strong> coke, which is still relatively anisotropic, gives <strong>the</strong><br />
<strong>binder</strong> coke bridges <strong>the</strong> desired reactivity and electrical resistivity<br />
properties.<br />
Since anodes made from 0% normal QI <strong>pitch</strong> have been found to<br />
have unacceptable anode properties [28], it is reasonable to assume<br />
that <strong>the</strong>re will be a minimum normal QI level, below which <strong>the</strong><br />
concentration <strong>of</strong> normal QI will be too low to deliver this desirable<br />
heterogeneous anode structure.<br />
The results <strong>of</strong> <strong>the</strong> studies reviewed suggest that this minimum<br />
normal QI level is less than 2% and may be as low as 1%. This needs<br />
to be confirmed experimentally.<br />
In several <strong>of</strong> <strong>the</strong> studies, reducing normal QI levels from >10% to<br />
BINDER PITCH QI CONTENT – ALUMINIUM ANODE<br />
Although a number <strong>of</strong> different “ideal” ranges are given in <strong>the</strong><br />
literature for normal QI levels [4,13,14,21,28], however most <strong>of</strong><br />
<strong>the</strong>se are based on historical results. As normal QI levels have come<br />
down, so has <strong>the</strong> bottom limit <strong>of</strong> <strong>the</strong> ideal ranges – when put to <strong>the</strong><br />
test, <strong>the</strong> lower normal QI <strong>pitch</strong>es have performed acceptably.<br />
The situation is well described in [4]: “The importance <strong>of</strong> normal QI<br />
in <strong>binder</strong> <strong>pitch</strong> is well established. However, <strong>the</strong>re is some<br />
disagreement as to <strong>the</strong> optimal <strong>content</strong>” and “……..<strong>the</strong> amount <strong>of</strong><br />
normal QI must be consistent”<br />
The anode study conducted did not reveal anything that would<br />
contradict <strong>the</strong> concept that acceptable anodes can be produced with<br />
<strong>pitch</strong>es with as little as 3.9 wt. % normal QI. The lower Baked<br />
Apparent Density at lower normal QI levels warrants fur<strong>the</strong>r<br />
attention as <strong>the</strong>re is potential to improve this through modification <strong>of</strong><br />
<strong>the</strong> anode formulation process [5].<br />
References<br />
1 T. Foosnaes & T Naterstad, Carbon: basics and principles, In<br />
Introduction to Aluminium Electrolysis, 2 nd Ed. (Aluminium<br />
Verlag, Dusseldorf, 1993), 87 – 134.<br />
2 H. Marsh, Carbon anodes for Aluminium – Manufacture,<br />
Structure and Properties, Proc. CIM Annual Conference <strong>of</strong><br />
Metallurgists, 1986, 63 – 86.<br />
3 R. Gray & K. Krupinski, Pitch Production, In Introduction to<br />
carbon technologies (Alicante: Universidad,1997), 329 – 424<br />
4 K. Krupinski & J. Windfelder, Effects <strong>of</strong> tar Quinoline<br />
Insolubles on manufactured carbon performance, Proc.<br />
Ironmaking Conference, 1992, 487 – 492.<br />
5 K. Hulse, Anode Manufacture – raw materials, formulation and<br />
processing parameters, PhD Thesis Univ. <strong>of</strong> Auckland, New<br />
Zealand, (R&D Carbon Ltd, Sierre, Switzerland), 2000.<br />
6 W. Roder, The future <strong>of</strong> coal tar <strong>pitch</strong> and alternative <strong>pitch</strong>es for<br />
carbon electrodes, CIM Light Metals 1998, 1998 171 – 182.<br />
7 A. Mirchi, G. Savard, J-P, Tremblay, & M. Simard, Alcan<br />
characterization <strong>of</strong> <strong>pitch</strong> performance for <strong>pitch</strong> <strong>binder</strong> evaluation<br />
144
COKE OVEN MANAGERS’ YEAR BOOK<br />
and process changes in an aluminium smelter, Light Metals<br />
2002, 2002, 525 – 534.<br />
8 C. Latham & H. Marsh, Anodes for aluminium production, Proc<br />
Carbon 86, 4 th Int. Carbon Conf., Baden Baden, 1986, 802 –<br />
803.<br />
9 C. Latham & H. Marsh, Structure and porosity in anodes for<br />
aluminium production, Proc 17 th Biennial Conf. on Carbon, Ext<br />
Abs, 1985, 462 – 463.<br />
10 K. Kuo, H. Marsh & D. Broughton, Influence <strong>of</strong> primary QI and<br />
particulate matter on <strong>pitch</strong> carbonizations, Fuel, Vol. 66,<br />
November,1987, 1544 – 1551.<br />
11 S. Jones & E. Bart, Binder for <strong>the</strong> ideal anode carbon, Light<br />
Metals 1990, 1990, 611 – 628.<br />
12 K. Kuo, H. Marsh, D. Broughton & I Edwards, Primary and<br />
secondary QI materials in <strong>pitch</strong>, Lecture notes, NCRL,<br />
University <strong>of</strong> Newcastle upon Tyne, UK.<br />
13 S. Jones & E. Bart, The role <strong>of</strong> primary Quinoline Insolubles in<br />
<strong>pitch</strong>-coke bond formation in anode carbon, Light Metals 1990,<br />
1990, 609 – 613.<br />
14 A. Alsher, R. Wildforster & J. Sharp, Performance <strong>of</strong> <strong>binder</strong><br />
<strong>pitch</strong>es with decreased QI-<strong>content</strong> in anode making – Formation,<br />
nature, properties and substitution <strong>of</strong> Quinoline Insolubles, Light<br />
Metals 1990, 1990, 583 – 590.<br />
15 N. Turner, Tracking <strong>the</strong> behaviour <strong>of</strong> <strong>pitch</strong> at elevated<br />
temperature, Light Metals 1995, 1995, 573 – 581.<br />
16 J. Saint Romain, P. Lagassie, R. Bertau & B. Souffrey, QI in<br />
coal tar <strong>pitch</strong>es – Part 1: Investigation <strong>of</strong> coke oven parameters<br />
acting on tar characteristics, Light Metals 1990, 1990, 591 –<br />
596.<br />
17 W. Boenigk, A. Nieh<strong>of</strong>f & R. Wildforster, Influence <strong>of</strong> QI<br />
<strong>content</strong> on <strong>binder</strong> <strong>pitch</strong> performance, Light Metals 1991, 1991,<br />
615 – 620.<br />
18 N. Turner, The influence <strong>of</strong> <strong>pitch</strong> QI particle type and size on<br />
anode quality – The volatiles emitted from bench scale anodes<br />
during baking, Light Metals 1992, 1992, 571 – 580.<br />
19 Tar industry services, A study <strong>of</strong> <strong>the</strong> rheological performance <strong>of</strong><br />
<strong>binder</strong> <strong>pitch</strong>es derived from modern coke-oven by-product tars,<br />
European Commission Technical Coal Research Contract No.<br />
7720-EC/840, 1992.<br />
145
BINDER PITCH QI CONTENT – ALUMINIUM ANODE<br />
20 L. Lavigne, Effect <strong>of</strong> Quinoline Insolubles (QI) in coal tar <strong>pitch</strong><br />
on laboratory test anodes, Light metals processing and<br />
applications, 1999, 143 – 148.<br />
21 P. Rhedey, Laboratory evaluation <strong>of</strong> a low Quinoline Insolubles<br />
coal-tar <strong>pitch</strong> as anode <strong>binder</strong>, Light Metals 1990, 1990, 605 –<br />
608.<br />
22 H. Tillmans, Carbonisation <strong>of</strong> <strong>pitch</strong>, Fuel, Vol. 64, Sept., 1985,<br />
1197 – 1203.<br />
23 N. Turner, The influence <strong>of</strong> <strong>pitch</strong> QI <strong>content</strong> and type on<br />
Aluminium smelting anode properties, IOP Publishing, 1988,<br />
470 – 472.<br />
24 D. Belitskus & W. Hill, Properties <strong>of</strong> bench scale anodes<br />
produced using <strong>binder</strong> <strong>pitch</strong>es varying in primary and secondary<br />
QI <strong>content</strong>s, Light Metals 1990, 1990, 577 – 582.<br />
25 M. Smith, R. Perruchoud & W. Fischer, Evaluating <strong>pitch</strong><br />
behaviour in prebaked anodes by analysis <strong>of</strong> <strong>the</strong> <strong>binder</strong> matrix,<br />
Aluminium, 68, Jan., 1992, 326 – 329.<br />
26 J. Patrick, The influence <strong>of</strong> <strong>pitch</strong> quality on anode carbon<br />
gasification, European Commission Technical Coal Research<br />
Contract No. 7220-EC/851, 1998.<br />
27 N. Steward & P. Halley, The <strong>effect</strong> <strong>of</strong> <strong>pitch</strong> type and QI <strong>content</strong><br />
on <strong>the</strong> processing and performance <strong>of</strong> carbon anodes – <strong>the</strong><br />
conversion <strong>of</strong> a smelter to a medium QI, vacuum distilled <strong>pitch</strong><br />
source, Light Metals 1994, 1994, 517 – 524.<br />
28 N. Turner, Improvements in anode <strong>binder</strong> <strong>pitch</strong>es by advances in<br />
raw materials handling, manufacturing and transportation, Light<br />
Metals 1990, 1990, 629 – 638.<br />
146