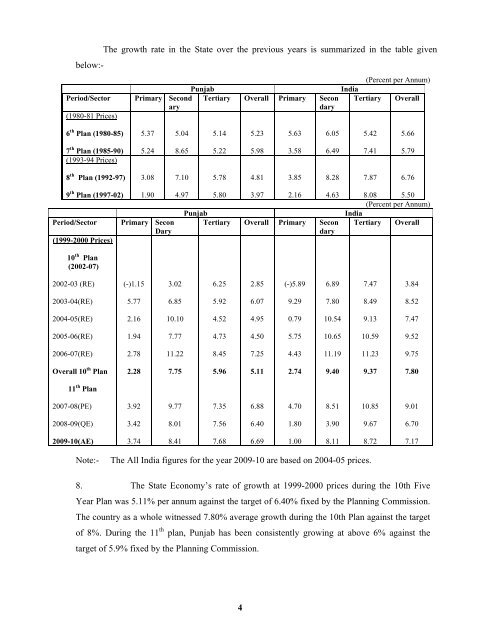
- Page 1 and 2: 1.1 INTRODUCTION 1. Punjab entered
- Page 3: mentioned schemes. Keeping in view
- Page 7 and 8: PLAN PERFORMANCE 12. The plan expen
- Page 9 and 10: 14. The Annual Plan for 2010-11 acc
- Page 11 and 12: infrastructure of seed production a
- Page 13 and 14: 26. Mahatma Gandhi National Rural E
- Page 15 and 16: and 25% State share) is under progr
- Page 17 and 18: 40. In the Annual Plan 2010-11, a s
- Page 19 and 20: oth the Eastern & the Western Freig
- Page 21 and 22: RoBs/RUBs for Rs. 360 Cr. is nearly
- Page 23 and 24: from AAI and two each from GoP and
- Page 25 and 26: o Renovation of ponds in 1000 villa
- Page 27 and 28: The State Government has also decid
- Page 29 and 30: 80. The State is yet to achieve 100
- Page 31 and 32: this mission, 2735 village panchaya
- Page 33 and 34: set up over 800 acres of land. The
- Page 35 and 36: 106. In Punjab, we are conscious of
- Page 37 and 38: The level of malnutrition amongst c
- Page 39 and 40: notified under the Biological Diver
- Page 41 and 42: scheme is being successfully implem
- Page 43 and 44: 134. To expedite payment of refund
- Page 45 and 46: 143. During the last three years, t
- Page 47 and 48: 1.2 PLAN AT A GLANCE A. 11 th Five
- Page 49 and 50: Annexure - 1.2 49 Rs. Cr Annual Pla
- Page 51 and 52: SN Item 1 Infant Mortality Ratio (2
- Page 53 and 54: oilseeds, pulses etc. so that the d
- Page 55 and 56:
2009-10, an outlay of Rs.195.00 lac
- Page 57 and 58:
support would be provided for devel
- Page 59 and 60:
(xvii) Innovative schemes: The abov
- Page 61 and 62:
2.1.23 The objective of the scheme
- Page 63 and 64:
AGR-14 Grant-in-aid to Council for
- Page 65 and 66:
hardware/peripherals & consumables
- Page 67 and 68:
(2) Increasing productivity of citr
- Page 69 and 70:
HORT-7 Catalytic Development Progra
- Page 71 and 72:
(i) Agriculture Department 2.1.65 A
- Page 73 and 74:
CS (AGR)-20 Upgradation of Soil Hea
- Page 75 and 76:
SWC-2 Scheme on Micro Irrigation (8
- Page 77 and 78:
private lands is contributed by the
- Page 79 and 80:
on Underground Pipeline System (UGP
- Page 81 and 82:
Diagnostic Labs will be established
- Page 83 and 84:
2.3.15 An outlay of Rs. 250.00 lac
- Page 85 and 86:
AH - 23 Upgradation of Vety. Instit
- Page 87 and 88:
AH - 15 Development of other livest
- Page 89 and 90:
2.3.46 An outlay of Rs.8.55 lac is
- Page 91 and 92:
CS(AH)-8 Stray cattle at Kothi Rani
- Page 93 and 94:
2.4 DAIRY DEVELOPMENT 93 Outlay -Rs
- Page 95 and 96:
Extension Centres, Bija (Ludhiana),
- Page 97 and 98:
a) Fodder Harvestors b) TMR Wagon c
- Page 99 and 100:
2.5.6 An outlay of Rs.1000.00 lac i
- Page 101 and 102:
in the field of Fisheries. The rese
- Page 103 and 104:
2.8.2 This scheme aims at taking ca
- Page 105 and 106:
Agricultural Cooperative Societies
- Page 107 and 108:
2.8.21 Under this scheme, National
- Page 109 and 110:
3. RURAL DEVELOPMENT 109 Outlay - R
- Page 111 and 112:
availability of markets. The major
- Page 113 and 114:
RDS(D)-2 Integrated Waste Land Deve
- Page 115 and 116:
outsourcing. The Substantially Unti
- Page 117 and 118:
2005-06 to 31/3/2010 an expenditure
- Page 119 and 120:
RDO-1 Training to Panches and Sarpa
- Page 121 and 122:
RDO(S)-5 Contribution to Village De
- Page 123 and 124:
100.00 lac was provided in the Annu
- Page 125 and 126:
constructed in Community Block. The
- Page 127 and 128:
8. No. of Districts 20 9. No. of Di
- Page 129 and 130:
4. NRI AFFAIRS Outlay - Rs. 500.00
- Page 131 and 132:
1999. The expenditure incurred duri
- Page 133 and 134:
IR-4 Rehabilitation of Channels of
- Page 135 and 136:
State Government. Expenditure incur
- Page 137 and 138:
The expenditure incurred during 200
- Page 139 and 140:
Rs.72.09 lac. The project is comple
- Page 141 and 142:
Manpur Head. The authorised dischar
- Page 143 and 144:
educed due to various reasons, like
- Page 145 and 146:
CAD-1 Construction of field Channel
- Page 147 and 148:
Government of India. The total cost
- Page 149 and 150:
5.1.57 Punjab being a riparian Stat
- Page 151 and 152:
FC-3 Project for flood projection w
- Page 153 and 154:
5.1.67 The project for Construction
- Page 155 and 156:
(7) Liberalizing setting up of New
- Page 157 and 158:
SN Sub-head/Scheme/ Item Units 11th
- Page 159 and 160:
upgraded its rural electrification
- Page 161 and 162:
(v) Renovation and Modernisation wo
- Page 163 and 164:
asis. For prescribing Terms of Refe
- Page 165 and 166:
capacity of 331 MW Biomass Power Pr
- Page 167 and 168:
NC-7 Mass Awareness and Publicity P
- Page 169 and 170:
as per the directions of the P.Ram
- Page 171 and 172:
Village and Small Scale Industries:
- Page 173 and 174:
will be funded /raised through earn
- Page 175 and 176:
cash not in any kind like cost of l
- Page 177 and 178:
8.1 ROAD TRANSPORT 8. TRANSPORT 177
- Page 179 and 180:
8.1.9 An outlay of Rs. 5000.00 lac
- Page 181 and 182:
8.2.6 NABARD is giving loan assista
- Page 183 and 184:
the rural areas by the year 2007. A
- Page 185 and 186:
Extension of Civil Airport Sahnewal
- Page 187 and 188:
PIDB has initiated 44 projects unde
- Page 189 and 190:
Sr. No. MAJOR PPP / BOT INFRASTRUCT
- Page 191 and 192:
Sr. No. 7 8 MAJOR PPP / BOT INFRAST
- Page 193 and 194:
Sr. No. MAJOR EPC INFRASTRUCTURE PR
- Page 195 and 196:
Sr. No. MAJOR EPC INFRASTRUCTURE PR
- Page 197 and 198:
Sr. No. 13 MAJOR EPC INFRASTRUCTURE
- Page 199 and 200:
Sr. No. 1 MAJOR EPC INFRASTRUCTURE
- Page 201 and 202:
Sr. No. 26 MAJOR EPC INFRASTRUCTURE
- Page 203 and 204:
NABI and BPU would be set up at a t
- Page 205 and 206:
SR- 1 Pushpa Gujral Science City at
- Page 207 and 208:
9.1.15 An expenditure of Rs. 5.17 l
- Page 209 and 210:
9.2 INFORMATION TECHNOLOGY 209 Outl
- Page 211 and 212:
IT-5 Capacity Building for e-Govern
- Page 213 and 214:
centre at district and sub-division
- Page 215 and 216:
EE-2 Conservation and Management of
- Page 217 and 218:
water are being made. This will ens
- Page 219 and 220:
- SoE, Punjab-2007 - covering Agric
- Page 221 and 222:
CS (EE)-III Ropar Wetland Project 2
- Page 223 and 224:
9.4.5 The objective of the scheme i
- Page 225 and 226:
selected areas using modern tools &
- Page 227 and 228:
9.4.22 Forestry Research is an esse
- Page 229 and 230:
expenditure of Rs. 25.01 lac had be
- Page 231 and 232:
10. GENERAL ECONOMIC SERVICES 10.1
- Page 233 and 234:
was strengthened. The posts already
- Page 235 and 236:
10.1.19 An outlay of Rs. 250.00 lac
- Page 237 and 238:
PM-13 Internship Progamme for Punja
- Page 239 and 240:
CSST-1 Holding of Seminars and Conf
- Page 241 and 242:
10.3.2 This project was sanctioned
- Page 243 and 244:
Attari 10.3.8 Total estimated cost
- Page 245 and 246:
central assistance) The remaining a
- Page 247 and 248:
TM-5 Incredible India - Punjab Luxu
- Page 249 and 250:
(vi) Promotional tours of travel ag
- Page 251 and 252:
TM 15 Investment in Punjab Tourism
- Page 253 and 254:
the procurement of paddy during the
- Page 255 and 256:
CS-4 One Time Grant for Strengtheni
- Page 257 and 258:
should be on participatory and dece
- Page 259 and 260:
(ii) Industries - Small Scale with
- Page 261 and 262:
(a) Any type of Civic Action Progra
- Page 263 and 264:
10.5.23 Involvement of non-Governme
- Page 265 and 266:
monitor the programme. The State/Di
- Page 267 and 268:
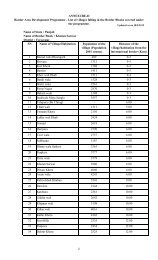
Progress under BADP during 2009-10
- Page 269 and 270:
11.1 GENERAL EDUCATION 11. SOCIAL S
- Page 271 and 272:
up in schools and all the funds mea
- Page 273 and 274:
36765.44 (Central Share Rs 22059.26
- Page 275 and 276:
11.1.17 The Education Through Satel
- Page 277 and 278:
EDE- 4 Opening of Primary Schools 1
- Page 279 and 280:
Vidyalayas. An expenditure of Rs 31
- Page 281 and 282:
Plan. An expenditure of Rs 100.00 l
- Page 283 and 284:
11.1.44 It is proposed to equip the
- Page 285 and 286:
teachers. An expenditure of Rs 456.
- Page 287 and 288:
State Funded Schemes HE-3 Establish
- Page 289 and 290:
will commence its first academic se
- Page 291 and 292:
provided in the Annual Plan 2009- 1
- Page 293 and 294:
LA-6 Introduction of basic computer
- Page 295 and 296:
implemented as a “Centrally Spons
- Page 297 and 298:
TE -4 Development of Special Trade
- Page 299 and 300:
for application of IT in teaching,
- Page 301 and 302:
incurred during 2008-09. An outlay
- Page 303 and 304:
expenditure was incurred under the
- Page 305 and 306:
to the construction/alternation/add
- Page 307 and 308:
and to motivate sports person. Memb
- Page 309 and 310:
was made in the revised estimates o
- Page 311 and 312:
AC-7 Excavation, Exploration and Pu
- Page 313 and 314:
AC-12 Construction of Archives Buil
- Page 315 and 316:
study centres in Baba Farid Univers
- Page 317 and 318:
11.5.11 Comparative current status
- Page 319 and 320:
of Rs.700.00 lac was provided for t
- Page 321 and 322:
11.5.26 For better dental care and
- Page 323 and 324:
11.5.34 The new University will be
- Page 325 and 326:
GoI(in kind). The Government of Ind
- Page 327 and 328:
second girl-child (only if the firs
- Page 329 and 330:
hospitals. State has already comple
- Page 331 and 332:
up. Ziqitza Health Care Ltd. Mumbai
- Page 333 and 334:
outlay of Rs.77.50 lac. An outlay o
- Page 335 and 336:
objective of the scheme is to launc
- Page 337 and 338:
diagnostic block wards, OPD, emerge
- Page 339 and 340:
CS-10 Rural Family Welfare Services
- Page 341 and 342:
Annual Plan 2010-11 for salary of 3
- Page 343 and 344:
11.5.120 The Ayurvedic Pharmacy and
- Page 345 and 346:
11.5.131 A new scheme AY-4 “Stren
- Page 347 and 348:
outlay of Rs.10.00 lac was provided
- Page 349 and 350:
and more dispensaries were opened a
- Page 351 and 352:
CS-43 Co-location under NRHM in CHC
- Page 353 and 354:
UWS-3(i) Prevention of Pollution of
- Page 355 and 356:
Shivpuri and backside of JCT Mill P
- Page 357 and 358:
Rs.1148.39 lac was incurred. Now es
- Page 359 and 360:
One time ACA of Rs.25.00 crore appr
- Page 361 and 362:
village & service level of 2654 PC
- Page 363 and 364:
The funding pattern of the project
- Page 365 and 366:
11.6.31 Swajaldhara was launched on
- Page 367 and 368:
an expenditure of Rs.105.00 lac was
- Page 369 and 370:
GoI has released Rs.8656.00 lac. Du
- Page 371 and 372:
search of employment opportunities.
- Page 373 and 374:
11.7.8 At Amritsar development of 3
- Page 375 and 376:
Plan. An expenditure of Rs.3420.00
- Page 377 and 378:
Chowk in Ludhiana at a cost of Rs.1
- Page 379 and 380:
for Annual Plan 2009-10 and it is p
- Page 381 and 382:
particularly belonging to the rural
- Page 383 and 384:
debate and discuss the various issu
- Page 385 and 386:
A Dedicated Social Security Fund am
- Page 387 and 388:
SC(S)-3 Grant in aid to PSCFC for w
- Page 389 and 390:
09. An outlay of Rs.100.00 lac each
- Page 391 and 392:
Rs.250.00 lac for Annual Plan 2007-
- Page 393 and 394:
11.10.25 Due to the poor economic c
- Page 395 and 396:
assistance previously as daughter o
- Page 397 and 398:
11.10.36 An outlay of Rs.250.00 lac
- Page 399 and 400:
An expenditure of Rs.126.28 lac as
- Page 401 and 402:
(1) Completed and Functional - 14 (
- Page 403 and 404:
Rs.100.00 lac each for Annual Plan
- Page 405 and 406:
once, irrespective of the number of
- Page 407 and 408:
11. 11 SOCIAL SECURITY AND WELFARE
- Page 409 and 410:
expenditure of Rs.0.60 lac, Rs.1.20
- Page 411 and 412:
Pension and Social Security Welfare
- Page 413 and 414:
covered. 50% of the premium i.e. Rs
- Page 415 and 416:
SW(S)-9 Setting up of 3 Beggary Hom
- Page 417 and 418:
(iv) Indira Gandhi National Disable
- Page 419 and 420:
11.12.7 This is a centrally sponsor
- Page 421 and 422:
SWW (S)-2 Empowerment of Women-Mahi
- Page 423 and 424:
11.12.18 The objective of the schem
- Page 425 and 426:
unmarried women above the age of 30
- Page 427 and 428:
are covered. Government of India ha
- Page 429 and 430:
SN Sub-head/Name of the Scheme 429
- Page 431 and 432:
SN Labour Courts Jurisdiction area
- Page 433 and 434:
o Honing the already possessed skil
- Page 435 and 436:
o Construction Skill Development Ce
- Page 437 and 438:
New Scheme EG-3 Maharaja Ranjit Sin
- Page 439 and 440:
On Going Schemes Centrally Sponsore
- Page 441 and 442:
lac was provided in the 11 th Five
- Page 443 and 444:
State Funded Schemes On-Going schem
- Page 445 and 446:
Special Assistance Programmes. Thes
- Page 447 and 448:
Balachaur, Nurpur Bedi & Majri are
- Page 449 and 450:
Mukatsar, Hoshiarpur and Roop Nagar
- Page 451 and 452:
DSW-9 Construction of Sainik Rest H
- Page 453 and 454:
12. GENERAL SERVICES 12.1 PRINTING
- Page 455 and 456:
Sangrur, Ludhiana, Jalandhar, Amrit
- Page 457 and 458:
ecommended by 11 th Finance Commiss
- Page 459 and 460:
Women cell / As a Referral to Distr
- Page 461 and 462:
Sponsored Scheme -Civil Defence. Un
- Page 463 and 464:
HP-2 Renovation of Punjab Bhawan, N
- Page 465 and 466:
Annual Plan 2008-09 for carrying ou
- Page 467 and 468:
State Funded Scheme RR-2 Divisional
- Page 469 and 470:
Land Records Project Management. Th
- Page 471 and 472:
Authority has been constituted unde
- Page 473 and 474:
13. EMPLOYMENT 13.1 The magnitude o
- Page 475 and 476:
o Providing training assistance to
- Page 477 and 478:
(iii)Organization of Placement Camp
- Page 479 and 480:
13.10 SGSY is a credit-cum-subsidy
- Page 481 and 482:
Act is designed to offer an incenti
- Page 483 and 484:
(Gurdaspur ) and Vlekhurd (Tarantar
- Page 485 and 486:
Annual Plan 2010-11 to cover 2000 b
- Page 487 and 488:
ate of interest i.e. 6% p.a. The te
- Page 489 and 490:
13.40 The applicant organization sh
- Page 491 and 492:
Recruitment of different category i
- Page 493 and 494:
would be upgraded to the desired le
- Page 495 and 496:
SN Bharat Nirman Programme * All th
- Page 497 and 498:
Rural Drinking Water Supply 497 Out
- Page 499 and 500:
14.7 An outlay of Rs.7034.22 lac as
- Page 501 and 502:
15. EXTERNALLY AIDED PROJECTS 501 O
- Page 503 and 504:
3. IRRIGATION MI-7 Externally Aided
- Page 505 and 506:
1.13 Notification u/s 4 for land ac
- Page 507 and 508:
& water logged area and SC populati
- Page 509 and 510:
Status of Constitution of District
- Page 511 and 512:
Functions of the District Planning
- Page 513 and 514:
(6) The meeting of the Committee sh
- Page 515 and 516:
Headquarters" w.e.f. 2010-11. Howev
- Page 517 and 518:
Under this scheme, no expenditure h
- Page 519 and 520:
Code No. Sub-Head/Name of the Schem
- Page 521 and 522:
Code No. Sub-Head/Name of the Schem
- Page 523 and 524:
agenda shall be prepared by the Joi
- Page 525 and 526:
Illustrative list of works which ca
- Page 527 and 528:
17. ROLE OF NGOS IN THE DEVELOPMENT
- Page 529:
(2) To provide the required informa