- Page 2:
Fundamentals of Biomechanics
- Page 6:
Duane Knudson Department of Kinesio
- Page 10:
VI FUNDAMENTALS OF BIOMECHANICS CHA
- Page 14:
VIII FUNDAMENTALS OF BIOMECHANICS R
- Page 18:
X FUNDAMENTALS OF BIOMECHANICS part
- Page 22:
Kinesiology is the scholarly study
- Page 26:
4 FUNDAMENTALS OF BIOMECHANICS beca
- Page 30:
6 FUNDAMENTALS OF BIOMECHANICS Figu
- Page 34:
8 FUNDAMENTALS OF BIOMECHANICS Figu
- Page 38:
10 FUNDAMENTALS OF BIOMECHANICS tat
- Page 42:
12 FUNDAMENTALS OF BIOMECHANICS App
- Page 46:
14 FUNDAMENTALS OF BIOMECHANICS The
- Page 50:
16 FUNDAMENTALS OF BIOMECHANICS sou
- Page 54:
18 FUNDAMENTALS OF BIOMECHANICS lic
- Page 58:
20 FUNDAMENTALS OF BIOMECHANICS Int
- Page 62:
22 FUNDAMENTALS OF BIOMECHANICS WEB
- Page 66:
24 FUNDAMENTALS OF BIOMECHANICS Fig
- Page 70:
26 FUNDAMENTALS OF BIOMECHANICS mat
- Page 74:
28 FUNDAMENTALS OF BIOMECHANICS say
- Page 78:
30 FUNDAMENTALS OF BIOMECHANICS cat
- Page 82:
32 FUNDAMENTALS OF BIOMECHANICS say
- Page 86:
34 FUNDAMENTALS OF BIOMECHANICS mor
- Page 90:
36 FUNDAMENTALS OF BIOMECHANICS to
- Page 94:
PARTII BIOLOGICAL/STRUCTURAL BASES
- Page 98:
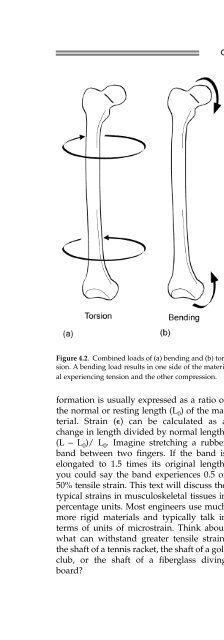
42 FUNDAMENTALS OF BIOMECHANICS Fig
- Page 102: 44 FUNDAMENTALS OF BIOMECHANICS Fig
- Page 106: 46 FUNDAMENTALS OF BIOMECHANICS jou
- Page 110: 48 FUNDAMENTALS OF BIOMECHANICS of
- Page 114: 50 FUNDAMENTALS OF BIOMECHANICS Fig
- Page 118: 52 FUNDAMENTALS OF BIOMECHANICS Act
- Page 122: 54 FUNDAMENTALS OF BIOMECHANICS Fig
- Page 126: 56 FUNDAMENTALS OF BIOMECHANICS rec
- Page 130: 58 FUNDAMENTALS OF BIOMECHANICS int
- Page 134: 60 FUNDAMENTALS OF BIOMECHANICS ed
- Page 138: 62 FUNDAMENTALS OF BIOMECHANICS Fig
- Page 142: 64 FUNDAMENTALS OF BIOMECHANICS use
- Page 146: 66 FUNDAMENTALS OF BIOMECHANICS exa
- Page 150: Many professionals interested in hu
- Page 156: 72 FUNDAMENTALS OF BIOMECHANICS Fig
- Page 160: 74 FUNDAMENTALS OF BIOMECHANICS Act
- Page 164: 76 FUNDAMENTALS OF BIOMECHANICS for
- Page 168: 78 FUNDAMENTALS OF BIOMECHANICS App
- Page 172: 80 FUNDAMENTALS OF BIOMECHANICS inc
- Page 176: 82 FUNDAMENTALS OF BIOMECHANICS Fig
- Page 180: 84 FUNDAMENTALS OF BIOMECHANICS For
- Page 184: 86 FUNDAMENTALS OF BIOMECHANICS The
- Page 188: 88 FUNDAMENTALS OF BIOMECHANICS tur
- Page 192: 90 FUNDAMENTALS OF BIOMECHANICS Fig
- Page 196: 92 FUNDAMENTALS OF BIOMECHANICS Ply
- Page 200: 94 FUNDAMENTALS OF BIOMECHANICS dev
- Page 204:
96 FUNDAMENTALS OF BIOMECHANICS Fig
- Page 208:
98 FUNDAMENTALS OF BIOMECHANICS Fig
- Page 212:
100 FUNDAMENTALS OF BIOMECHANICS In
- Page 216:
102 FUNDAMENTALS OF BIOMECHANICS fo
- Page 220:
Mechanics is the branch of physics
- Page 224:
108 FUNDAMENTALS OF BIOMECHANICS Fi
- Page 228:
110 FUNDAMENTALS OF BIOMECHANICS im
- Page 232:
112 FUNDAMENTALS OF BIOMECHANICS Fi
- Page 236:
114 FUNDAMENTALS OF BIOMECHANICS Fi
- Page 240:
116 FUNDAMENTALS OF BIOMECHANICS Fi
- Page 244:
118 FUNDAMENTALS OF BIOMECHANICS ou
- Page 248:
120 FUNDAMENTALS OF BIOMECHANICS Fi
- Page 252:
122 FUNDAMENTALS OF BIOMECHANICS Fi
- Page 256:
124 FUNDAMENTALS OF BIOMECHANICS In
- Page 260:
126 FUNDAMENTALS OF BIOMECHANICS se
- Page 264:
128 FUNDAMENTALS OF BIOMECHANICS ne
- Page 268:
130 FUNDAMENTALS OF BIOMECHANICS we
- Page 272:
132 FUNDAMENTALS OF BIOMECHANICS WE
- Page 276:
134 FUNDAMENTALS OF BIOMECHANICS Hi
- Page 280:
136 FUNDAMENTALS OF BIOMECHANICS In
- Page 284:
138 FUNDAMENTALS OF BIOMECHANICS Fi
- Page 288:
140 FUNDAMENTALS OF BIOMECHANICS Fi
- Page 292:
142 FUNDAMENTALS OF BIOMECHANICS Fi
- Page 296:
144 FUNDAMENTALS OF BIOMECHANICS Fi
- Page 300:
146 FUNDAMENTALS OF BIOMECHANICS Fi
- Page 304:
148 FUNDAMENTALS OF BIOMECHANICS us
- Page 308:
150 FUNDAMENTALS OF BIOMECHANICS ta
- Page 312:
152 FUNDAMENTALS OF BIOMECHANICS en
- Page 316:
154 FUNDAMENTALS OF BIOMECHANICS Fi
- Page 320:
156 FUNDAMENTALS OF BIOMECHANICS Fi
- Page 324:
158 FUNDAMENTALS OF BIOMECHANICS we
- Page 328:
160 FUNDAMENTALS OF BIOMECHANICS ve
- Page 332:
162 FUNDAMENTALS OF BIOMECHANICS th
- Page 336:
164 FUNDAMENTALS OF BIOMECHANICS Ap
- Page 340:
166 FUNDAMENTALS OF BIOMECHANICS (c
- Page 344:
Angular kinetics explains the cause
- Page 348:
Let's look at another example of ap
- Page 352:
Application: Muscle-Balance and Str
- Page 356:
The symbol for the moment of inerti
- Page 360:
Variations in the moment of inertia
- Page 364:
trates the net joint torques at the
- Page 368:
and 55% of the height for males and
- Page 372:
calculate the positions of the cent
- Page 376:
tal and vertical positions of the c
- Page 380:
fectively increases the base of sup
- Page 384:
Application: Inverse Dynamics of Wa
- Page 388:
SUGGESTED READING Brown, L. E. (Ed.
- Page 392:
194 FUNDAMENTALS OF BIOMECHANICS Gr
- Page 396:
196 FUNDAMENTALS OF BIOMECHANICS Fi
- Page 400:
198 FUNDAMENTALS OF BIOMECHANICS Fi
- Page 404:
200 FUNDAMENTALS OF BIOMECHANICS Fi
- Page 408:
202 FUNDAMENTALS OF BIOMECHANICS cr
- Page 412:
204 FUNDAMENTALS OF BIOMECHANICS Re
- Page 416:
206 FUNDAMENTALS OF BIOMECHANICS Mu
- Page 420:
208 FUNDAMENTALS OF BIOMECHANICS Fi
- Page 424:
210 FUNDAMENTALS OF BIOMECHANICS wh
- Page 428:
PARTIV APPLICATIONS OF BIOMECHANICS
- Page 432:
216 FUNDAMENTALS OF BIOMECHANICS sp
- Page 436:
218 FUNDAMENTALS OF BIOMECHANICS mo
- Page 440:
220 FUNDAMENTALS OF BIOMECHANICS va
- Page 444:
222 FUNDAMENTALS OF BIOMECHANICS Fi
- Page 448:
224 FUNDAMENTALS OF BIOMECHANICS Di
- Page 452:
Coaching athletics also involves te
- Page 456:
This young player shows good balanc
- Page 460:
weaknesses in some athlete's exerci
- Page 464:
QUALITATIVE ANALYSIS OF CATCHING As
- Page 468:
Dyson, G. (1986). Mechanics of athl
- Page 472:
238 FUNDAMENTALS OF BIOMECHANICS Fi
- Page 476:
240 FUNDAMENTALS OF BIOMECHANICS sw
- Page 480:
242 FUNDAMENTALS OF BIOMECHANICS on
- Page 484:
244 FUNDAMENTALS OF BIOMECHANICS ri
- Page 488:
246 FUNDAMENTALS OF BIOMECHANICS 5.
- Page 492:
248 FUNDAMENTALS OF BIOMECHANICS Fi
- Page 496:
250 FUNDAMENTALS OF BIOMECHANICS an
- Page 500:
252 FUNDAMENTALS OF BIOMECHANICS IN
- Page 504:
254 FUNDAMENTALS OF BIOMECHANICS pl
- Page 508:
Aagaard, P. (2003). Training-induce
- Page 512:
Basmajian, J. V., & Wolf, S. L. (Ed
- Page 516:
Chalmers, G. (2002). Do golgi tendo
- Page 520:
Dyson, G. (1986). Mechanics of athl
- Page 524:
ments. Journal of Applied Biomechan
- Page 528:
ing locomotor movements. Exercise a
- Page 532:
sessment. Australian Journal of Phy
- Page 536:
to strength and conditioning. Balti
- Page 540:
Journal of Science and Medicine in
- Page 544:
cur as a function of learning a tim
- Page 548:
Woo (Eds.), Multiple muscle systems
- Page 552:
Schneider, K., Zernicke, R. F., Sch
- Page 556:
cles in the acceleration phase of t
- Page 560:
absolute angle: an angle measured t
- Page 564:
compliance: the ratio of change in
- Page 568:
First Law of Thermodynamics: applic
- Page 572:
kinematic chain: a linkage of rigid
- Page 576:
parallel elastic component: a part
- Page 580:
series elastic component: a part of
- Page 584:
Wolff's Law: bones remodel accordin
- Page 588:
This appendix provides initial answ
- Page 592:
quadriceps groups to extend the kne
- Page 596:
flow of fluid, while lift acts at r
- Page 600:
Rating Principle Body part (inadequ
- Page 604:
310 FUNDAMENTALS OF BIOMECHANICS Ba
- Page 608:
312 FUNDAMENTALS OF BIOMECHANICS F
- Page 612:
314 FUNDAMENTALS OF BIOMECHANICS Ki
- Page 616:
316 FUNDAMENTALS OF BIOMECHANICS Oc
- Page 620:
318 FUNDAMENTALS OF BIOMECHANICS St
- Page 624:
This section of the book provides a
- Page 628:
LAB ACTIVITY 1 NAME _______________
- Page 632:
LAB ACTIVITY 2 NAME _______________
- Page 636:
LAB ACTIVITY 3 NAME _______________
- Page 640:
LAB ACTIVITY 4 NAME _______________
- Page 644:
LAB ACTIVITY 5A NAME ______________
- Page 648:
LAB ACTIVITY 5B NAME ______________
- Page 652:
LAB ACTIVITY 6A NAME ______________
- Page 656:
LAB ACTIVITY 6B NAME ______________
- Page 660:
LAB ACTIVITY 7A NAME ______________
- Page 664:
LAB ACTIVITY 7B NAME ______________
- Page 668:
LAB ACTIVITY 8 NAME _______________
- Page 672:
LAB ACTIVITY 9 NAME _______________
- Page 676:
LAB ACTIVITY 10 NAME ______________
- Page 680:
LAB ACTIVITY 11 NAME ______________
- Page 684:
LAB ACTIVITY 12 NAME ______________