Dynamics and Vulnerability of Delta Systems - loicz
Dynamics and Vulnerability of Delta Systems - loicz
Dynamics and Vulnerability of Delta Systems - loicz

Create successful ePaper yourself
Turn your PDF publications into a flip-book with our unique Google optimized e-Paper software.
2.3 Sea-Level Change<br />
For a given deltaic coast, changes in its elevation relative to sea level depends on three factors<br />
(Syvitski et al., in review): (1) Changes to the volume <strong>of</strong> the global ocean (Eustasy), as influenced<br />
by fluctuations in the storage <strong>of</strong> terrestrial water (e.g. glaciers, ice sheets, groundwater, lakes, <strong>and</strong><br />
reservoirs), <strong>and</strong> fluctuations in temperature <strong>of</strong> the ocean’s surface waters (Warrick & Oerlemans<br />
1990, Bind<strong>of</strong>f et al. 2007). Sea level is presently increasing at a rate <strong>of</strong> 1.8 to 3 mm/y under the<br />
anthropogenic influence <strong>of</strong> global warming. (2) Vertical movements <strong>of</strong> the l<strong>and</strong> surface, as influenced<br />
by hydro-isostasy related to sea level fluctuation, loading due to the weight <strong>of</strong> delta deposits,<br />
glacio-isostasy related to the growth or shrinkage <strong>of</strong> nearby ice masses, tectonics, <strong>and</strong> deepseated<br />
thermal subsidence (Syvitski 2008). Isostatic changes can cause deltas to subside at rates <strong>of</strong><br />
1-5 mm/y. (3) Changes to the sedimentary volume <strong>of</strong> the delta, through natural compaction (�3<br />
mm/y), accelerated compaction (�150 mm/y), <strong>and</strong> aggradation or sediment deposition onto the<br />
delta’s surface (�50 mm/y). Aggradation depends on both the rate sediment is delivered to a<br />
delta, <strong>and</strong> the amount <strong>of</strong> sediment retained on the delta during its transport across the delta surface.<br />
Climate<br />
Scenarios<br />
Temperature<br />
Change in °C<br />
Sea Level Rise<br />
in m<br />
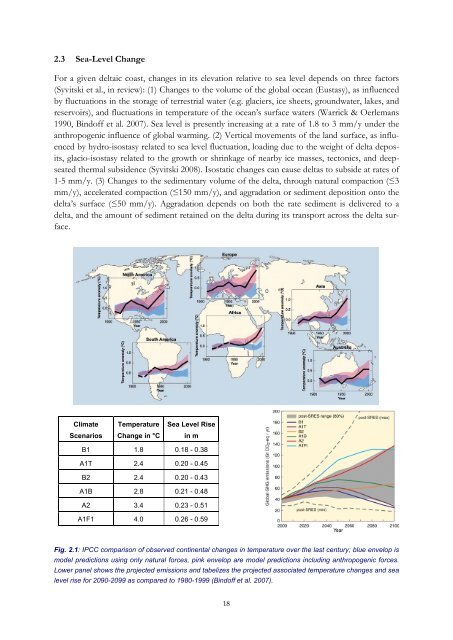
B1 1.8 0.18 - 0.38<br />
A1T 2.4 0.20 - 0.45<br />
B2 2.4 0.20 - 0.43<br />
A1B 2.8 0.21 - 0.48<br />
A2 3.4 0.23 - 0.51<br />
A1F1 4.0 0.26 - 0.59<br />
Fig. 2.1: IPCC comparison <strong>of</strong> observed continental changes in temperature over the last century; blue envelop is<br />
model predictions using only natural forces, pink envelop are model predictions including anthropogenic forces.<br />
Lower panel shows the projected emissions <strong>and</strong> tabelizes the projected associated temperature changes <strong>and</strong> sea<br />
level rise for 2090-2099 as compared to 1980-1999 (Bind<strong>of</strong>f et al. 2007).<br />
18