

UCLA Internet Report (online version) - Center for the Digital Future
UCLA Internet Report (online version) - Center for the Digital Future
UCLA Internet Report (online version) - Center for the Digital Future

You also want an ePaper? Increase the reach of your titles
YUMPU automatically turns print PDFs into web optimized ePapers that Google loves.
Percent of Respondents<br />
THE <strong>UCLA</strong> INTERNET REPORT: Surveying <strong>the</strong> <strong>Digital</strong> <strong>Future</strong> 70<br />
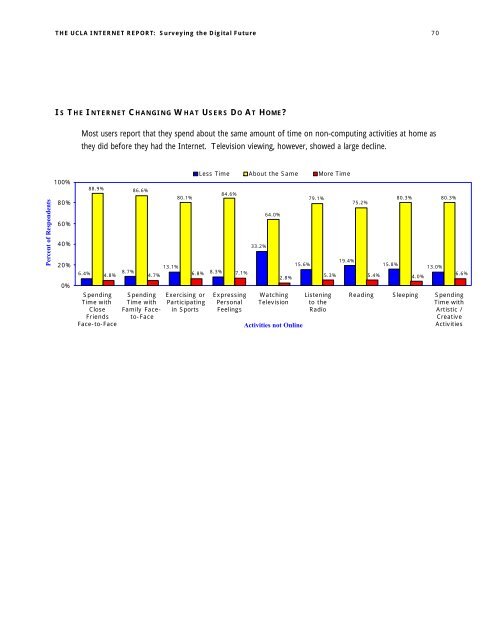
IS THE INTERNET CHANGING WHAT USERS DO AT HOME?<br />
100%<br />
80%<br />
60%<br />
40%<br />
20%<br />
0%<br />
Most users report that <strong>the</strong>y spend about <strong>the</strong> same amount of time on non-computing activities at home as<br />
<strong>the</strong>y did be<strong>for</strong>e <strong>the</strong>y had <strong>the</strong> <strong>Internet</strong>. Television viewing, however, showed a large decline.<br />
6.4%<br />
88.9% 86.6%<br />
Spending<br />
Time with<br />
Close<br />
Friends<br />
Face-to-Face<br />
80.1%<br />
13.1%<br />
4.8%<br />
8.7%<br />
4.7% 6.8% 8.3% 7.1%<br />
Spending<br />
Time with<br />
Family Faceto-Face<br />
Exercising or<br />
Participating<br />
in Sports<br />
Less Time About <strong>the</strong> Same More Time<br />
84.6%<br />
Expressing<br />
Personal<br />
Feelings<br />
33.2%<br />
64.0%<br />
2.8%<br />
Watching<br />
Television<br />
Activities not Online<br />
15.6%<br />
79.1%<br />
Listening<br />
to <strong>the</strong><br />
Radio<br />
19.4%<br />
75.2%<br />
15.8%<br />
5.3% 5.4% 4.0%<br />
80.3% 80.3%<br />
13.0%<br />
6.6%<br />
Reading Sleeping Spending<br />
Time with<br />
Artistic /<br />
Creative<br />
Activities