Research report - Rotterdam School of Management
Research report - Rotterdam School of Management
Research report - Rotterdam School of Management

Create successful ePaper yourself
Turn your PDF publications into a flip-book with our unique Google optimized e-Paper software.
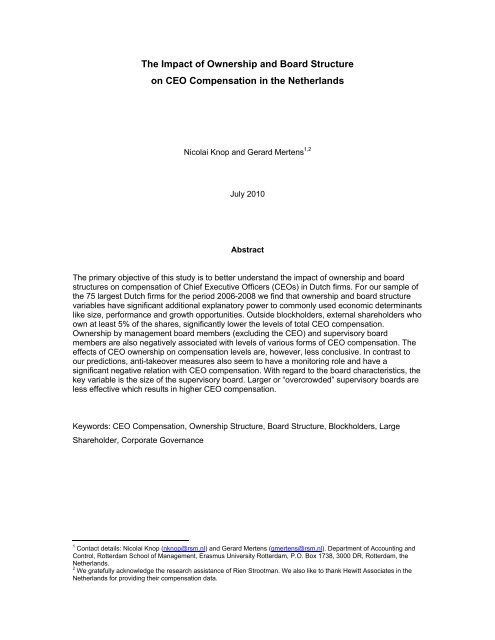
The Impact <strong>of</strong> Ownership and Board Structure<br />
on CEO Compensation in the Netherlands<br />
Nicolai Knop and Gerard Mertens 1,2<br />
July 2010<br />
Abstract<br />
The primary objective <strong>of</strong> this study is to better understand the impact <strong>of</strong> ownership and board<br />
structures on compensation <strong>of</strong> Chief Executive Officers (CEOs) in Dutch firms. For our sample <strong>of</strong><br />
the 75 largest Dutch firms for the period 2006-2008 we find that ownership and board structure<br />
variables have significant additional explanatory power to commonly used economic determinants<br />
like size, performance and growth opportunities. Outside blockholders, external shareholders who<br />
own at least 5% <strong>of</strong> the shares, significantly lower the levels <strong>of</strong> total CEO compensation.<br />
Ownership by management board members (excluding the CEO) and supervisory board<br />
members are also negatively associated with levels <strong>of</strong> various forms <strong>of</strong> CEO compensation. The<br />
effects <strong>of</strong> CEO ownership on compensation levels are, however, less conclusive. In contrast to<br />
our predictions, anti-takeover measures also seem to have a monitoring role and have a<br />
significant negative relation with CEO compensation. With regard to the board characteristics, the<br />
key variable is the size <strong>of</strong> the supervisory board. Larger or “overcrowded” supervisory boards are<br />
less effective which results in higher CEO compensation.<br />
Keywords: CEO Compensation, Ownership Structure, Board Structure, Blockholders, Large<br />
Shareholder, Corporate Governance<br />
1<br />
Contact details: Nicolai Knop (nknop@rsm.nl) and Gerard Mertens (gmertens@rsm.nl). Department <strong>of</strong> Accounting and<br />
Control, <strong>Rotterdam</strong> <strong>School</strong> <strong>of</strong> <strong>Management</strong>, Erasmus University <strong>Rotterdam</strong>, P.O. Box 1738, 3000 DR, <strong>Rotterdam</strong>, the<br />
Netherlands.<br />
2<br />
We gratefully acknowledge the research assistance <strong>of</strong> Rien Strootman. We also like to thank Hewitt Associates in the<br />
Netherlands for providing their compensation data.
1. Introduction<br />
Previous studies on the impact <strong>of</strong> corporate governance on executive compensation are focused<br />
on Anglo-Saxon countries, primarily the United States. There are relatively few studies covering<br />
Continental Europe, like for example Elson and Goldberg (2003) and Haid and Yurtoglu (2006),<br />
which both cover Germany. The relation between corporate governance and executive<br />
remuneration in the Netherlands has not been examined yet 3 . The purpose <strong>of</strong> this study is to fill<br />
this gap by examining the impact <strong>of</strong> ownership and board structures on compensation <strong>of</strong> Chief<br />
Executive Officers (CEOs) in publicly-listed firms 4 .<br />
The Netherlands, with its small open economy, are an interesting market to further investigate,<br />
because its corporate governance features and pay practices lie in between the Anglo-Saxon<br />
countries and Continental Europe. Furthermore, shareholders in the Netherlands have a binding<br />
vote on executive pay, i.e. a majority <strong>of</strong> shareholders can reject a new remuneration policy, as<br />
opposed to the (non-binding) advisory vote on pay in most Anglo-Saxon countries. Below we will<br />
address some <strong>of</strong> these issues in more detail starting with the overall corporate governance<br />
model, followed by ownership concentration, board structure, pay practices amongst Dutch firms<br />
and the pay-setting process including the binding vote for shareholders.<br />
The overall corporate governance model <strong>of</strong> the Netherlands is a mixture <strong>of</strong> the Anglo-Saxon<br />
shareholder model and the stakeholder model (Rhineland model) which prevails in Germany and<br />
other Continental Europe countries. According to the Dutch Corporate Governance Code the<br />
management board and the supervisory board have overall responsibility for weighing up the<br />
interests <strong>of</strong> stakeholders, generally with a view to ensure the continuity <strong>of</strong> the enterprise, while<br />
the company endeavours to create long-term shareholder value 5 . This dual approach is still<br />
subject to debate in the Netherlands; see for instance Maatman (2004), Boot, Mertens and<br />
Wallage (2008) and Cools and Winter (2008).<br />
The ownership structure <strong>of</strong> the Dutch firms is not as dispersed as Anglo-Saxon companies but<br />
also less concentrated then their German counterparts. In Continental Europe ownership is much<br />
more concentrated in contrast to large U.K. and U.S. firms with their dispersed ownership<br />
structures (see Becht and Mayer (2000) and La Porta et al (1998, 1999)). Becht and Mayer<br />
3 <strong>Research</strong> on executive compensation in the Netherlands has been primary focused on the pay-for-performance<br />
relationship (i.e. Cornelisse et al, 2005; Mertens et al, 2007; Duffhues and Kabir, 2008; Van Ees et al, 2007; Otten et al,<br />
2008; Kemna and Mertens, 2009). An exception is the recent study <strong>of</strong> the Netherlands Bureau for Economic Policy<br />
Analysis (CPB) that analyses the causes <strong>of</strong> the growth <strong>of</strong> top wages <strong>of</strong> 600 Dutch companies, <strong>of</strong> which 10% was publicly<br />
listed, for the years 1995-2005 (Straath<strong>of</strong> et al, 2010).<br />
4 CEO compensation is most frequently studied in previous research on executive compensation.<br />
5 The Dutch CG code defines stakeholders as follows: the groups and individuals who directly or indirectly influence (or<br />
are influenced by) the achievement <strong>of</strong> the aims <strong>of</strong> the company. In other words employees, shareholders and other<br />
providers <strong>of</strong> capital, suppliers and customers, but also government and civil society.
(2000), for instance, show that in many European countries single blockholders frequently control<br />
more than 50% <strong>of</strong> the votes, while the majority <strong>of</strong> U.K. and U.S. listed companies have no<br />
blockholder owning more than 10% respectively 6% <strong>of</strong> the shares. In addition, Becht and Mayer<br />
show large differences between Continental European counties, ranging form a “private control<br />
bias” in Germany to a modest management control bias <strong>of</strong> the Anglo-Saxon variety in the<br />
Netherlands and Spain 6 .<br />
In the Netherlands, like in Germany, a two-tier board structure is most commonly used as<br />
opposed to the one-tier board structure in Anglo-Saxon countries. Within a two-tier board system,<br />
the management board is responsible for the day-to-day business, the corporate strategy and<br />
(financial) results. The management board, chaired by the CEO, is accountable for this to the<br />
supervisory board and to the general meeting <strong>of</strong> shareholders. The role <strong>of</strong> the supervisory board,<br />
e.g. the non-executive board members, is to supervise the policies <strong>of</strong> the management board and<br />
the general affairs <strong>of</strong> the company, as well as to assist the management board by providing<br />
advice. Because <strong>of</strong> this two-tier structure there is a natural distance between executive board<br />
members and non-executive board members as opposed to the (Anglo-Saxon) one-tier model.<br />
In a one-tier board all directors (both executive directors as well as non-executive directors) form<br />
one board and take combined decisions. Furthermore, in a two-tier board structure there is a<br />
clear split between the CEO and the chairman <strong>of</strong> the supervisory board, while in a one-tier board<br />
the CEO can also be the chairman which has been common practice amongst many US<br />
corporations 7 .<br />
Executive compensation practices within Dutch firms tend to follow UK pay practices rather than<br />
French or German pay practices 8 . Bryan et al (2006) compares the structure <strong>of</strong> executive<br />
compensation <strong>of</strong> US firms with 256 firms <strong>of</strong> 36 non-U.S. countries for the period 1996-2004. They<br />
show that the average ratio <strong>of</strong> equity-based compensation to total compensation <strong>of</strong> Dutch<br />
companies (0.395) is closer to the ratios <strong>of</strong> the England (0.366) and the United States (.534), then<br />
to France (0.176) and Germany (0.063). More recent studies <strong>of</strong> Van Ees et al (2007) and Hewitt<br />
(2009) showed a strong convergence between the European countries, although variable pay<br />
packages <strong>of</strong> German CEOs show a strong bias towards annual bonuses as opposed to long term<br />
6 Becht and Mayer (2000) document that voting blocks <strong>of</strong> Austrian and German companies are typically clustered around<br />
the 25%, 50% and 75% voting level which correspond to significant voting levels in both countries (blocking minority,<br />
majority and super-majority voting). Haid and Yurtoglu (2006) also use these voting thresholds as dummy variables in<br />
their regression models.<br />
7 In the sample <strong>of</strong> Core et al (1999) about 75% <strong>of</strong> the firms had a CEO who was also the board chair. Agrawal and Nasser<br />
(2009) showed that this percentage is about 64% for a more recent sample period (1998-2006). In addition Agrawal and<br />
Nasser (2009) found that in about 30% <strong>of</strong> the firms the CEO also serves on the board’s nomination or corporate<br />
governance committee.<br />
8 Possible explanations are amongst others: a) the cross-listings <strong>of</strong> major firms like Reed Elsevier, Royal Dutch Shell and<br />
Unilever, and b) that the U.K., in general, serves as a guide for the Netherlands on many corporate governance topics.<br />
The British Combined Code that includes best practice provisions with regard to executive remuneration, for instance,<br />
greatly influenced the first edition <strong>of</strong> Dutch Corporate Governance code, e.g. the Tabaksblat Code.
(equity based) incentives. Focusing on the most frequently used performance measures within<br />
long-term incentive plans, Van Ees et al (2007) and Mertens and Knop (2008) found that the<br />
majority <strong>of</strong> large Dutch and U.K. firms use relative total shareholder return as performance<br />
measure within long-term incentive plans, while relative total shareholder return is less common<br />
in France and Germany 9 . So not only the pay mix but also incentive design differs between<br />
European countries 10 .<br />
One <strong>of</strong> the most distinct corporate governance features - regarding executive compensation - <strong>of</strong><br />
the Netherlands constitutes shareholders’ right to vote on executive remuneration plans, i.e. the<br />
so called “Say-on-Pay” 11 . As <strong>of</strong> 2004 Dutch companies should submit their new remuneration<br />
policy for the next financial year and subsequent years (or major changes to the existing policy) to<br />
the annual general meeting <strong>of</strong> shareholders for ex-ante approval, which is the final stage in the<br />
pay-setting process (see exhibit 1). The shareholders <strong>of</strong> Dutch companies have a binding vote,<br />
which implies that the new (or changed) policy cannot be implemented in case a majority <strong>of</strong> the<br />
shareholders vote against. This is in contrast with the advisory vote in the UK. Since 2002,<br />
shareholders <strong>of</strong> UK public companies have an advisory vote on the director’s remuneration <strong>report</strong><br />
which covers the pay policy for the next year(s) and prior year’s compensation for each director.<br />
This advisory vote is however non-binding, so U.K. companies can disregard the opinion <strong>of</strong><br />
shareholders 12 . In the U.S the House <strong>of</strong> Representatives approved the “The Wall Street Reform<br />
and Consumer Protection Act <strong>of</strong> 2009’’ in December 2009 which includes an advisory vote on pay<br />
practices including executive compensation and golden parachutes. Germany had no “Say-on-<br />
Pay” during the period 2006-2008. Shareholders could only vote on the pool <strong>of</strong> capital reserved<br />
for share-based compensation plans, not the plans themselves. However, with the adoption <strong>of</strong><br />
new legislation, the “Gesetz zur Angemessenheit von Vorstandsvergütungen“ (VorstAG), on<br />
August 2009, shareholders are now eligible to have an advisory vote on the remuneration <strong>report</strong><br />
<strong>of</strong> publicly listed firms in Germany. The setting in France is not much different from Germany<br />
before the adoption <strong>of</strong> the VorstAG, with the exception that French shareholders enjoy a binding<br />
vote over severance packages since 2007.<br />
The “Say-on-Pay” regime in the Netherlands with its binding vote has resulted in several<br />
landmark cases in the Netherlands. In 2008, Royal Philips Electronics, was the first Dutch<br />
9<br />
Total shareholder return (dividends reinvested) <strong>of</strong> a company compared to an industry peer group or a general market<br />
index like for example the FTSE 100.<br />
10<br />
Ferrarini et al (2003) conclude: “European executive pay cannot, however, be regarded in a monolithic fashion given the<br />
current sharp differences in corporate governance as well as diverging cultural attitudes towards wealth and pay<br />
transparency”.<br />
11<br />
See the ISS/RiskMetrics <strong>report</strong>s <strong>of</strong> 2007 “What International Markets Say on Pay – An Investor Perspective” and 2008<br />
“A Pan-European Perspective on Executive Remuneration”.<br />
12<br />
Royal Dutch Shell plc is a UK company, but headquartered in the Netherlands and a heavy weight in the Dutch large<br />
cap index (the AEX), faced a majority <strong>of</strong> shareholders that voted against its remuneration <strong>report</strong> during the 2009 AGM.<br />
However, because <strong>of</strong> its UK legal status this was only an advisory vote and Royal Dutch Shell maintained its incentive<br />
plan and proposed bonus payments.
company ever where a majority <strong>of</strong> shareholders opposed the new long-term incentive plan (LTIP).<br />
This veto was followed by VastNed Retail, a real estate investment company that faced a<br />
takeover bid by IEF Capital, where shareholders opposed the award <strong>of</strong> retention bonuses to<br />
executive board members. In addition, Corporate Express, facing strong shareholder opposition,<br />
withdrew its remuneration proposal at the beginning <strong>of</strong> its 2008 annual meeting <strong>of</strong> shareholders.<br />
Similar developments took place in 2009. Again VastNed Retail faced a majority vote against an<br />
ad hoc bonus proposal. In addition, a number <strong>of</strong> major Dutch large caps, like Royal DSM,<br />
Heineken and Randstad, also facing shareholder and public revolt, removed their remuneration<br />
policy from the AGM agenda.<br />
Although the number <strong>of</strong> cases, in which the majority <strong>of</strong> shareholders voted against the<br />
remuneration policy <strong>of</strong> Dutch companies, is still limited, the threat <strong>of</strong> voting down remuneration<br />
proposals may prove be to an uncomfortable burden for most public companies and their<br />
directors.<br />
Even though the Netherlands has some distinct corporate governance features including the<br />
‘binding’ vote <strong>of</strong> shareholders on executive remuneration policies, the results <strong>of</strong> this study are<br />
remarkably similar to previous U.S. and German studies. For our sample <strong>of</strong> the 75 largest Dutch<br />
firms for the period 2006-2008 we find that ownership and board structure variables have<br />
significant additional explanatory power to commonly used economic determinants like size,<br />
performance and growth opportunities.<br />
Outside blockholders, external shareholders who own at least 5% <strong>of</strong> the shares, significantly<br />
lower the levels <strong>of</strong> total CEO compensation. Ownership by management board members<br />
(excluding the CEO) and supervisory board members are also negatively associated with levels<br />
<strong>of</strong> various forms <strong>of</strong> CEO compensation. The effects <strong>of</strong> CEO ownership on compensation levels<br />
are, however, less conclusive. In contrast to our predictions, anti-takeover measures also seem to<br />
have a monitoring role and have a significant negative relation with CEO compensation. With<br />
regard to the board characteristics, the key variable is the size <strong>of</strong> the supervisory board. Larger or<br />
“overcrowded” supervisory boards are less effective which results in higher CEO compensation.<br />
The remainder <strong>of</strong> this study is organized as follows. Section 2 provides an overview <strong>of</strong> previous<br />
studies on ownership and board structure in relation to executive pay. In this section we also<br />
introduce our main hypotheses. Section 3 discusses the dataset and models used in this study. In<br />
section 4 we present the main results <strong>of</strong> our empirical analysis. Section 5 summarizes and<br />
provides the main conclusions <strong>of</strong> our study. Section 6 presents some further directions for future<br />
research.
Exhibit 1: Pay-setting process in the Netherlands<br />
Vote on new<br />
remuneration.<br />
policy or major<br />
changes to<br />
existing policy<br />
during the AGM<br />
Remuneration<br />
Remuneration<br />
policy<br />
policy<br />
Propose/set rem. policy<br />
Pay level,<br />
pay mix +<br />
incentive<br />
design<br />
Shareholders<br />
Shareholders<br />
Supervisory<br />
Supervisory<br />
Board Board (SB)<br />
(SB)<br />
Remuneration<br />
Remuneration<br />
Committee<br />
Committee<br />
(sub (sub committee)<br />
committee)<br />
<strong>Management</strong><br />
<strong>Management</strong><br />
Board Board (MB)<br />
(MB)<br />
Other determinants<br />
Economic factors: size, industry, growth opportunities, performance, risk<br />
Institutional factors: law, fiscal regime, corporate governance codes<br />
Public opinion: media, politics<br />
External advisors: compensation consultants, proxy advisors<br />
Appoint individual members in<br />
AGM (max 3 terms <strong>of</strong> 4 years)<br />
Select<br />
members<br />
Negotiate<br />
Terms Terms <strong>of</strong> <strong>of</strong> emloyemloymentment<br />
+target<br />
+target<br />
setting<br />
setting<br />
Negotiate<br />
Performance<br />
review<br />
Annual<br />
Annual<br />
compensation<br />
compensation<br />
Performance
2. The relation between corporate governance and executive compensation<br />
2.1. The balance <strong>of</strong> power within the pay-setting process<br />
In the previous section we described the pay-setting process in the Netherlands and its specific<br />
features. The outcomes <strong>of</strong> executive pay-setting process in general are however widely debated.<br />
In the literature two competing theories exist that explain the determinants <strong>of</strong> executive<br />
compensation. These are (1) the efficient or optimal contracting model and (2) the managerial<br />
power model 13 .<br />
The efficient contracting model, introduced by Jensen and Meckling (1976), assumes that pay is<br />
set by an remuneration commission consisting <strong>of</strong> independent non-executive board members<br />
(vis-à-vis managers) on behalf <strong>of</strong> the shareholders. This at arm’s length bargaining process<br />
should result in a cost-effective compensation package that provides risk averse executives with<br />
incentives to increase shareholder value. Since this model had been the dominant theory in<br />
studies on executive pay, Bebchuk and Fried (2004) labeled it as the “<strong>of</strong>ficial view”.<br />
Various empirical studies provided evidence inconsistent with the efficient contracting theory.<br />
Examples are amongst others Bertrand and Mullanaithan (2000), Core et al (1999), Hambrick<br />
and Finkelstein (1995) and Yermack (1997).<br />
These inconsistent results lead into a new model, the managerial power model, heavily<br />
advocated by Bebchuk and Fried (2004) in their book Pay without performance: the unfulfilled<br />
promises <strong>of</strong> executive compensation. The managerial power model argues that agents/managers<br />
have the power to heavily influence the pay setting process resulting in rent extraction at the<br />
expense <strong>of</strong> shareholders. So where the efficient contracting theory assumes that executive<br />
compensation is used by shareholders to reduce agency costs, the managerial power theory<br />
sees inefficient executive compensation arrangements as an agency problem on itself.<br />
Bebchuk and Fried (2004) list several limitations to the at arm’s-length contracting view. We will<br />
discuss some <strong>of</strong> these limitations. First, non-executive directors or supervisory board members<br />
enjoy financial and non-financial benefits <strong>of</strong> holding board positions. Hence they have a desire to<br />
be reelected on the board. To avoid internal friction and unpleasantness, directors avoid disputes<br />
over CEO’s compensation. Second, CEOs have substantial power over the firm’s resources and<br />
their positions sometimes give them significant influence outside the firm. CEOs can use this<br />
power to benefit directors directly or indirectly ranging from directors’ compensation to donations<br />
to charity foundations that employ or are headed by a non-executive director. Third, there are<br />
13 See Otten (2007) for an extensive overview <strong>of</strong> existing theories on executive pay.
also various social and psychological factors like for instance friendship, loyalty and collegiality<br />
that encourage non-executive directors which interfere with the at arm’s-length principle.<br />
Even if directors operate with full integrity to serve shareholders’ interests, Jensen and Murphy<br />
(2004) show that the result <strong>of</strong> the pay-setting process is almost inevitably tilted towards the<br />
benefits <strong>of</strong> CEOs, because remuneration committees routinely lack time, information, expertise<br />
and negotiation skills.<br />
Besides the direct negotiations between the members <strong>of</strong> the remuneration committee and the<br />
CEO, other market forces, like the managerial labor market, market for corporate control and<br />
product markets, might influence the pay-setting process resulting into an arm’s length contract 14 .<br />
According to Bebchuk and Fried (2004), however, these market forces might impose some<br />
constraints, but are in general not sufficiently strong to dictate outcomes.<br />
Shareholder’s power to intervene might be an effective control mechanism as well. As discussed<br />
in the introduction, several Anglo-Saxon countries, like Australia and the U.K., have an advisory<br />
vote on executive pay and the Netherlands have a binding vote. Although the number <strong>of</strong> cases in<br />
which shareholders actually voted against compensation schemes is still fairly limited (ISS, 2007;<br />
Risk Metrics, 2008), there is a growing tendency towards more scrutiny by shareholders as we<br />
have seen in the Netherlands. In addition recent studies <strong>of</strong> Balachandran et al (2007) and Carter<br />
and Zamora (2008) find evidence that shareholders in UK firms have influence on (the design <strong>of</strong>)<br />
incentive schemes resulting in strengthened pay-for-performance link and less potential dilution <strong>of</strong><br />
equity-based incentives, particularly stock option grants.<br />
Whether “say-on-pay” will be the panacea for keeping executive pay close to arm’s length<br />
contracting arrangements remains to been seen. An important precondition is close collaboration<br />
among shareholders in policy making, setting (new) guidelines and having an effective dialogue,<br />
e.g. engagement, with (the boards) <strong>of</strong> companies in which they invest. Different types <strong>of</strong> investors<br />
with their individual interests and preferences might result in a rather heterogeneous shareholder<br />
base rather than a homogeneous pool speaking with one voice.<br />
To sum, the executive pay process can be regarded as a continuum which is as a result <strong>of</strong> the<br />
balance <strong>of</strong> power within a firm (Almazan et al, 2005; Sapp et al, 2007). The managerial power<br />
hypothesis lies at one extreme with the managers having almost complete power to set pay. At<br />
14 Two interesting examples <strong>of</strong> product market discipline are Dutch food-retailer Ahold and German car-parts supplier<br />
Bosch. After the appointment <strong>of</strong> Mr. Moberg as CEO <strong>of</strong> Ahold in May 2003, consumers <strong>of</strong> Ahold, dissatisfied with the paypackage<br />
<strong>of</strong> the new CEO, significantly decreased their spending in Ahold’s supermarkets. In an interview in the Financial<br />
Times <strong>of</strong> 27 January 2010, the CEO <strong>of</strong> Bosch says that the company will not do business with banks that maximize<br />
bonuses (Schäfer, 2010).
the other extreme lies the efficient contracting model in which the power to set pay is ultimately<br />
held by the shareholders. This duality is well articulated by Finkelstein and Hambrick (1995): “In<br />
management-controlled firms – were no single owner exists – results suggest an overreaching<br />
pay philosophy: maximize CEO pay, subject to demonstration <strong>of</strong> face legitimacy <strong>of</strong> that pay. In<br />
externally controlled firms – where a major (no manager) owner exists – results suggest a very<br />
different philosophy: minimize CEO pay, subject to the ability to attract/retain a satisfactory CEO”.<br />
The final balance depends on the ownership structure and the board characteristics. Exhibit 2<br />
presents both dimensions with their underlying variables along with the main three actors, the<br />
shareholders, the supervisory board and management.<br />
The remainder <strong>of</strong> this section builds further on exhibit 2. The next paragraph (2.2.) provides an<br />
overview <strong>of</strong> studies on ownership structure in relation to executive pay. We take a closer look at<br />
the impact <strong>of</strong> outside blockholders on the level <strong>of</strong> executive compensation (2.2.1), followed by<br />
supervisory board ownership in paragraph 2.2.2. and ownership by the CEO and other executives<br />
in paragraph 2.2.3. Paragraph 2.3. describes the impact <strong>of</strong> the board characteristics like board<br />
size, board independence, CEO tenure and tenure <strong>of</strong> supervisory board members. For each<br />
variable a hypothesis is formulated as well which will be examined in section 4.
Exhibit 2: The balance <strong>of</strong> power within the pay-setting process<br />
Ownership structure<br />
Outside blockholders<br />
�� Ownership concentration<br />
�� Type <strong>of</strong> blockholders<br />
�� Shareholder rights (antitakeover<br />
measures)<br />
Shareholdings <strong>of</strong> SB<br />
�� Chairman<br />
�� Other supervisory board<br />
members<br />
Shareholdings MB<br />
�� Chairman<br />
�� Other MB members<br />
3 main actors<br />
Shareholders<br />
Shareholders<br />
Remuneration Remuneration Committee<br />
Committee<br />
<strong>Management</strong><br />
<strong>Management</strong><br />
Board Board (MB)<br />
(MB)<br />
Appoint members<br />
Approve rem. policy<br />
Supervisory<br />
Supervisory<br />
Board Board (SB)<br />
(SB)<br />
Pay<br />
negotiations<br />
Board structure<br />
Supervisory board<br />
�� Board size<br />
�� Independence <strong>of</strong> SB members<br />
�� Tenure <strong>of</strong> SB members<br />
<strong>Management</strong> Board<br />
�� Tenure CEO
2.2. The impact <strong>of</strong> ownership structure on CEO compensation<br />
2.2.1. Impact <strong>of</strong> blockholders on executive compensation<br />
The separation <strong>of</strong> ownership and control, and the resulting conflict <strong>of</strong> interests between owners<br />
(principals) and manager (agents), has been the heart <strong>of</strong> the agency theory (Jensen and<br />
Meckling 1976). Shleifer and Vishny (1986) demonstrate that a large shareholder does have a<br />
strong incentive to monitor managers and can play a beneficial role in remedying agency<br />
problems and increase firm value. Cyert et al (2002) also present a theoretical agency model, but<br />
the authors focus entirely on the pay-setting process and show that CEO’s equity compensation<br />
is negatively related to the fraction <strong>of</strong> the firm held by the largest outside shareholder who poses<br />
a takeover threat to managerial control.<br />
The monitoring role <strong>of</strong> large outside shareholders, e.g. blockholder, as shown by Shleifer and<br />
Vishny (1986) and Cyert et al (2002) is also supported by empirical evidence. Since most studies<br />
covering the U.S. we start with these studies followed by an overview <strong>of</strong> non-U.S. studies. The<br />
overview below will be in chronicle order.<br />
U.S. studies<br />
Studies by Lambert et al (1993) and Core et al (1999) find a negative relation between the<br />
existence <strong>of</strong> an outside blockholder that owns at least 5 percent <strong>of</strong> the outstanding shares and<br />
the level <strong>of</strong> executive compensation. Both studies cover data for the years 1982-1984. Dyl (1989)<br />
also use data from 1982, but defines ownership as the natural logarithm <strong>of</strong> the percentage <strong>of</strong> the<br />
firm held by the ‘top five’ shareholders instead <strong>of</strong> a single dummy variable like the previous<br />
studies. He also finds a negative relation, which can be attributed to major shareholders that have<br />
a meaningful economic incentive to engage in monitoring activities which reduce agency costs.<br />
Cyert et al (2002), studying 1992-1993 data, find that the equity ownership <strong>of</strong> the largest external<br />
shareholder is strongly negatively related to the size <strong>of</strong> CEO equity compensation and total<br />
variable pay. In addition, they show that the largest shareholder does do not significantly lower<br />
the level <strong>of</strong> base salary. Benz et al (2001) show that a higher concentration <strong>of</strong> shareholders 15<br />
significantly lowers the value <strong>of</strong> granted options for S&P firms over the years 1992 to 1997.<br />
Fahlenbrach (2004) uses shareholder rights instead <strong>of</strong> ownership concentration to express the<br />
balance <strong>of</strong> power between management and shareholders. He finds over the period 1992-2001<br />
that companies with weak shareholder rights pay their CEOs significantly more total<br />
compensation 16 . Both cash compensation and equity-based compensation are higher. Becker et<br />
15 Shareholder concentration is measured by the proportion <strong>of</strong> outstanding stock an average shareholder owns.<br />
16 Fahlenbrach (2004) uses the governance index <strong>of</strong> Gompers et al (2003) to measure the balance <strong>of</strong> power between<br />
shareholders and managers. Gompers et al (2003) have build a governance index based on 24 different corporate
al (2009) examine US firms in the period 1996-2001. They show that a non-managerial individual<br />
blockholder (5%), excluding blocks held by mutual funds and other institutions, reduces total CEO<br />
pay which is consistent with theories <strong>of</strong> large shareholders as monitors <strong>of</strong> management and<br />
thereby mitigating agency costs.<br />
Other U.S. studies focus only on a specific group <strong>of</strong> blockholders: the institutional investors 17 .<br />
Hartzell and Starks (2003) find that concentration <strong>of</strong> institutional investor ownership is negatively<br />
related to the compensation <strong>of</strong> top five executives over the period 1992-1997 18 . Almazan et al<br />
(2005) investigate the same time period 1992-1997, but make a split in two types <strong>of</strong> institutional<br />
investors: potentially active (investment advisers and investment companies) and potentially<br />
passive investors (bank trust departments and insurance companies). Although they <strong>report</strong> a<br />
difference between both groups with regard to their influence on the pay-for-performance<br />
sensitivity, their main finding is that an increase in the concentration <strong>of</strong> ownership by both types <strong>of</strong><br />
institutional investors is associated with lower levels <strong>of</strong> salary and total compensation. Khan et al<br />
(2005) studying US CEO compensation over the period 1992-1999, find that the largest<br />
institutional shareholder - not necessarily owning a 5% stake - has a significant impact on CEO<br />
pay, resulting in lower pay levels <strong>of</strong> compensation. Shin (2005) finds that concentration by large<br />
institutions (top 5) is inversely correlated with the percentage <strong>of</strong> CEO compensation that is equitybased<br />
for U.S. firms over the period 1998-2002.<br />
Studies outside the U.S.<br />
Elston and Goldberg (2003) is the first comprehensive study in Germany 19 . They analyze 91<br />
companies over the 1970-1986 period and find similar results like previously mentioned U.S.<br />
studies; concentrated ownership reduces the average and total level <strong>of</strong> compensation <strong>of</strong> the<br />
entire management board. In addition they find evidence that bank influence has a negative<br />
influence on pay levels 20 . Haid and Yurtoglu (2006) build further on the Elston and Goldberg<br />
governance provisions and state takeover laws resulting in an index with a range <strong>of</strong> 0 to 24 (with 24 being the most hostile<br />
environment for shareholders).<br />
17 Further elaborating on Kahn et al (2005) there are a couple <strong>of</strong> reasons why large institutional investors are different<br />
form large individual investors. In terms <strong>of</strong> expertise, large institutional owners have stakes in many organizations, as well<br />
as experienced pr<strong>of</strong>essionals to monitor their investments, and therefore might can more effective in influencing<br />
compensation packages. In addition, large institutional owners have more power and expertise individually and collectively<br />
through proxy voting agencies like Risk Metrics/ISS <strong>of</strong> Glass Lewis or corporate governance platforms like the Association<br />
<strong>of</strong> British Insurers (ABI) and Eumedion in the Netherlands, compared to other large individual stockholders.<br />
18 Their ownership variable, concentration <strong>of</strong> institutional investor ownership (top 5 institutional ownership scaled by total<br />
institutional ownership instead <strong>of</strong> total shares outstanding), is heavily criticized by Smith and Swan (2007) as well as other<br />
methodological issues like e.g. ineffective size control (not using the natural logarithm <strong>of</strong> firm’s market capitalization).<br />
19 Earlier studies most similar to the study <strong>of</strong> Elston and Goldberg (2003), FitzRoy and Schwalbach (1990) and Schmid<br />
(1997) also showed a negative effect <strong>of</strong> ownership concentration on the compensation <strong>of</strong> managers in Germany, but<br />
faced data limitations (see Elston and Goldberg, 2003). FitzRoy and Schwalbach (1990) used annual data for 95 firms<br />
form 1969-1985 but ownership data was only available for one year, 1982, and therefore the same ownership variable<br />
was used for each company for the entire the sample period. Schmid’s (1997) sample covers only one year, 1991.<br />
20 A firm is bank influenced if the bank owns more than 25% <strong>of</strong> the shares, if total votes <strong>of</strong> banks at shareholders’<br />
meetings (including proxy votes) exceed 50% or if total votes ranges between 25% and 50% and the chairman <strong>of</strong> the<br />
supervisory board is a banker.
study; their sample covers the period from 1987 to 2003. The authors find similar results: higher<br />
ownership concentration lowers the average annual total pay (fixed plus variable) for the<br />
members <strong>of</strong> the management board 21,22 . Like Elston and Goldberg (2003), Haid and Yurtoglu<br />
(2006) also find that bank ownership substantially reduces the level <strong>of</strong> pay, but in addition they<br />
find that family ownership has a significantly positive impact. Haid and Yurtoglu (2006) also<br />
investigate the implications <strong>of</strong> deviations from the one-share-one-vote principle, e.g. cash flow<br />
rights do not equal voting rights. Their results suggest that increases in the size <strong>of</strong> German<br />
companies are associated with much higher pay levels when voting rights deviate from cash flow<br />
rights.<br />
Sapp (2007) find that Canadian firms with a controlling shareholder pay their CEOs less and the<br />
gap between their CEO and the next four best compensated executives in the firm is less. Sapp<br />
(2007) also finds that the level <strong>of</strong> variable compensation decreases for firms that are family<br />
owned or when firms have a controlling shareholder 23 .<br />
Based on the literature provided in this section we can formulate the first three hypotheses. The<br />
first hypothesis is based on amongst others Lambert et al (1993), Core et al (1999), Cyert et al<br />
(2002), Sapp (2007) and Becker (2009) which document a negative relation between large<br />
external blockholders and the level <strong>of</strong> executive pay.<br />
Hypothesis 1: outside blockholders, shareholders who own at least 5% <strong>of</strong> the shares, are<br />
associated with lower executive pay.<br />
Various studies like Hartzell and Starks (2003), Almazan et al (2005), Khan et al (2005) and Shin<br />
(2005) make a distinction between types <strong>of</strong> blockholders and focus institutional investors because<br />
<strong>of</strong> their strong monitoring capabilities. Like Almazan et al (2005) we make a split in two types <strong>of</strong><br />
institutional investors: potentially active (investment advisers and investment companies) and<br />
potentially passive investors (bank trust departments and insurance companies).<br />
Hypothesis 2: if the largest outside blockholder is a “potentially active institutional investor” it will<br />
have a significant negative impact on the compensation levels.<br />
21<br />
Haid and Yurtoglu (2006) have no information on the compensation data <strong>of</strong> individual board members, because publicly<br />
traded companies in Germany were not required to disclose executive compensation on an individual basis in the years<br />
covering their sample period.<br />
22<br />
Elston and Goldberg (2003) and Haid and Yurtoglu (2006) measure ownership concentration from one to five, where<br />
five defines the highest degree <strong>of</strong> concentration, with a single stockholder holding more than 75% <strong>of</strong> the firm’s shares. If<br />
two or three stockholders hold more than 75% <strong>of</strong> the shares and the firm does not qualify for the higher concentration<br />
level, then concentration is set at four. Concentration is set at three if a single stockholder holds more than 50% <strong>of</strong> the<br />
shares, and two, if two or three stockholders own more than 50% <strong>of</strong> the shares. Concentration is set at one for all cases in<br />
which the concentration level is lower than for category two.<br />
23<br />
A controlling shareholder is defined as the largest shareholder having either at least twice the voting rights <strong>of</strong> the next<br />
largest shareholder or at least 10% equity ownership.
The monitoring role <strong>of</strong> large external shareholders can be mitigate as shareholders’ rights are<br />
restricted. Weaker shareholder rights result in higher total compensation for CEOs and a higher<br />
annual increase in compensation (Fahlenbrach, 2004; Haid and Yortoglu, 2006).<br />
Hypothesis 3: weaker shareholder rights, e.g. deviations from the one-share-one-vote principle<br />
or anti-takeover measures, will result in higher levels <strong>of</strong> executive pay.<br />
2.2.2. Equity holding by supervisory board members<br />
Lambert et al (1993) find a negative, but insignificant, association between the percentage <strong>of</strong><br />
outstanding equity owned by external board members and the level <strong>of</strong> executive pay. Core et al<br />
(1999) also find a negative insignificant association between the percentage ownership per<br />
outside director and CEO compensation. Similar results were found by Finkelstein and Hambrick<br />
(1989).<br />
More recent studies however find a significant negative relation between equity holdings by nonexecutive<br />
board members and the level <strong>of</strong> executive pay. Cyert et al (2002) document a negative<br />
relation between stock ownership by members <strong>of</strong> the remuneration committee and the level <strong>of</strong><br />
CEO compensation. In addition, Sapp (2007) shows that board members having larger equity<br />
positions in the firm are related to lower compensation levels for the top five named executive<br />
<strong>of</strong>ficers (NEOs) 24 . Agrawal and Nasser (2009) find that CEOs <strong>of</strong> firms with an independent<br />
director who is also blockholder have (a) lower levels <strong>of</strong> cash and total compensation, and (b)<br />
lower proportions <strong>of</strong> pay via stock and options 25 .<br />
This leads us to the following hypothesis, whereby we apply the same 1% cut-<strong>of</strong>f point as Nasser<br />
and Aggrawal (2009):<br />
Hypothesis 4: supervisory board members holding at least 1% <strong>of</strong> the shares have a negative<br />
impact on CEO compensation levels.<br />
2.2.3. Ownership by CEO and other executive board members<br />
Finkelstein and Hambrick (1989) find a significant inverted U-shaped relationship between CEO<br />
holdings and salary, whereby larger CEO ownership leads to higher salaries as long as CEO<br />
ownership stays below 9%. After this point (<strong>of</strong> inflection) the reverse relation holds. Finkelstein<br />
24<br />
Sapp (2007) also document a negative coefficient for the CEO pay levels, but this relation is not significant at<br />
conventional levels.<br />
25<br />
Agrawal and Nasser (2009) define blockholders as individuals who own or control 1% or more <strong>of</strong> a firm’s outstanding<br />
equity (i.e., higher <strong>of</strong> cashflow rights or voting rights).
and Hambrick (1989) find no significant results for the bonus and total compensation (base plus<br />
bonus). Lambert et al (1993) find a significant negative relation between the percentage <strong>of</strong><br />
outstanding equity owned by the CEO and the level <strong>of</strong> compensation. In addition they find a<br />
negative, but insignificant, relation between the existence <strong>of</strong> a non-CEO internal board member<br />
who owns at least 5 percent <strong>of</strong> the outstanding shares and the level <strong>of</strong> executive compensation.<br />
Mehran (1995) finds that firms with higher managerial ownership have less equity-based<br />
compensation. These findings hold for different managerial positions: the CEO, the top<br />
executives as well as all <strong>of</strong>ficers and directors as a group 26 . Core et al (1999) also show that CEO<br />
equity ownership or the presence <strong>of</strong> another executive board member who owns at least 5% <strong>of</strong><br />
the outstanding equity significantly reduces the level <strong>of</strong> CEO compensation for different<br />
compensation definitions like base salary, total cash (base plus bonus) or total compensation<br />
(total cash plus equity-based incentives). Bryan, Hwang and Lilien (2000) find that CEO<br />
ownership is significantly negatively related to restricted stock grants. Cyert et al (2002) find,<br />
unlike the other studies mentioned here, that larger CEO ownership results in higher pay levels,<br />
either base salary, equity compensation or discretionary compensation 27 . Shin (2005) shows that<br />
equity holding by the CEO are associated with a lower equity grant as percentage <strong>of</strong> total<br />
compensation. Kahn et al (2005) find that higher levels <strong>of</strong> CEO ownership lead to a significant<br />
reduction in the level <strong>of</strong> options compensation, as well as higher ratios <strong>of</strong> salary to total<br />
compensation and lower ratios <strong>of</strong> options to total compensation. Sapp (2007) finds that the CEO’s<br />
total compensation decreases as the shareholdings <strong>of</strong> the CEO increase.<br />
Overall, we can conclude that most empirical studies find a negative relation between managerial<br />
(non-CEO) ownership and the level <strong>of</strong> compensation (see Lambert et al, 1993; Mehran, 1995 and<br />
Core et al, 1999).<br />
Hypothesis 5: shareholdings <strong>of</strong> management board <strong>of</strong> at least 1% are negatively associated with<br />
levels <strong>of</strong> CEO compensation.<br />
The findings for CEO ownership are less conclusive. Finkelstein and Hambrick (1989) document<br />
a significant inverted U-shared relation for base salary, but no find no significant results for bonus<br />
and total compensation. Cyert et al (2002) document a positive (linear) relation between CEO<br />
ownership and pay levels, while other studies (Lambert et al 1993; Core et al, 1999; Kahn, 2005;<br />
26 Mehran (2005) also finds that the results for cash compensation are the opposite <strong>of</strong> those for equity-based<br />
compensation, e.g. a positive relationship between the percentage <strong>of</strong> total compensation in cash (salary and bonus) and<br />
the percentage <strong>of</strong> shares held by managers.<br />
27 Their theoretical framework, however, shows that the effect <strong>of</strong> the CEO's ownership on his compensation is ambiguous.
Sapp, 2007) find a negative relation. Nevertheless, we also expect that higher CEO ownerships<br />
results in lower CEO compensation 28 .<br />
Hypothesis 6: there is a negative relation between a CEO owning at least 1% <strong>of</strong> the shares and<br />
the level <strong>of</strong> CEO compensation.<br />
2.3. Impact <strong>of</strong> the board structure on executive pay<br />
Board structure also plays an important role in the pay-setting process. Below we discuss various<br />
factors (see exhibit 2) that determine the strength and the independence <strong>of</strong> the Supervisory<br />
Board: board size, independent directors, tenure <strong>of</strong> the CEO, tenure <strong>of</strong> the chairman <strong>of</strong> the<br />
supervisory board and the average tenure <strong>of</strong> other supervisory board members.<br />
2.3.1. Supervisory board size<br />
Larger or “overcrowded” boards are considered to be less effective and therefore easier<br />
influenced by the CEO. Bebchuk and Fried (2004) provide several reasons. We would like to<br />
address two <strong>of</strong> them 29 . First, in larger boards individual directors may feel less responsible and<br />
may focus less on firm’s affairs and executive pay accordingly. Second, due to their size these<br />
board tend to be less cohesive and it is more difficult to gather a majority within the board to<br />
challenge the CEO or other board members on compensation matters or otherwise. Results <strong>of</strong><br />
Core et al (1999) and Sapp (2007) support this conclusion; they find that larger boards are<br />
positively related to the level <strong>of</strong> compensation. Findings <strong>of</strong> Cyert et al (2002), however, suggest<br />
that the significance <strong>of</strong> board size is an indirect effect <strong>of</strong> the strong relation between executive<br />
pay and firm size, and what matters in CEO pay is director’s ownership rather than the mere<br />
number <strong>of</strong> directors.<br />
Hypothesis 7: board size is positively associated with compensation levels.<br />
28 Besides motives regarding the balance <strong>of</strong> power, economic motives <strong>of</strong> the CEO might as well play an important role in<br />
explaining this negative relation between shareholdings <strong>of</strong> the CEO and the level <strong>of</strong> compensation. Lambert et al (1993)<br />
suggests that the corporate CEO's compensation is a benchmark for lower-level managers' compensation. Therefore, if<br />
CEO compensation is decreased, this will produce a large decrease in total organizational compensation and an increase<br />
in the equity value <strong>of</strong> the firm. This will benefit the CEO with a high equity ownership as long as the lower level <strong>of</strong><br />
compensation is more than <strong>of</strong>fset by an increase in the value <strong>of</strong> equity owned by the CEO. Another explanation is that<br />
high managerial ownership results in higher concerns for dilution and therefore less equity-based pay. In addition, if riskaverse<br />
managers hold a substantial equity stake in firm their interest are already aligned with the shareholders because<br />
their wealth varies with firm performance (Core and Guay 2005).<br />
29 The third argument <strong>of</strong> Bebchuk and Fried (2004) is that members <strong>of</strong> large boards are less likely to be constrained in<br />
their decisions by the threat <strong>of</strong> public outrage; the larger the board, the harder it is for outside observers to direct their<br />
outrage at any one member. We doubt if this argument still holds for the Netherlands (and the UK as well). After voting<br />
against the remuneration <strong>report</strong> <strong>of</strong> Royal Dutch Shell during the 2009 AGM, shareholders forced Peter Jobs, chair <strong>of</strong> the<br />
remuneration committee <strong>of</strong> Shell to step down. In addition during the 2009 AGM <strong>of</strong> Royal KPN almost a majority <strong>of</strong> the<br />
shareholders voted against the discharge <strong>of</strong> Supervisory Board members from liability after shareholders were very<br />
disappointed with changes in the executive remuneration packages which were not placed on the AGM agenda for voting.
2.3.2. Independent board members<br />
Core et al (1999) find that CEO compensation is higher when the CEO is also the board chair and<br />
when there is a greater percentage <strong>of</strong> the board that is not considered fully independent. External<br />
board members that have been appointed by the CEO, who are ‘gray’ (a director is gray if he or<br />
his employer received payments from the company in excess <strong>of</strong> his board pay), or who are<br />
interlocked (a director is interlocked if an inside <strong>of</strong>ficer <strong>of</strong> the firm serves on the board <strong>of</strong> that<br />
outside director’s company), are considered to be less independent. Benz, Kucher and Stutzer<br />
(2001) find that when managers are also member <strong>of</strong> the board <strong>of</strong> directors the value <strong>of</strong> stock<br />
options grant increases. Sapp (2007) finds that the percentage <strong>of</strong> independent directors is<br />
significantly related to a decrease in the compensation levels <strong>of</strong> the top five named executive<br />
<strong>of</strong>ficers. Sapp (2007) also finds a positive but statistically insignificant relation with CEO<br />
compensation 30 . Overall evidence suggests that an independent supervisory board members<br />
lower executive compensation.<br />
Hypothesis 8: Independent boards are negatively associated with pay levels.<br />
2.3.3. Tenure <strong>of</strong> CEO and other management board members<br />
A longer managerial tenure might be associated with more managerial power as the (historical)<br />
relation with the board <strong>of</strong> directors becomes stronger. Finkelstein and Hambrick (1995) document<br />
an inverted U-shaped relationship between total pay and CEO tenure with inflation-adjusted pay<br />
starting to decline at about 18 years <strong>of</strong> tenure. Cyert et al (2002) find a positive relation between<br />
CEO tenure and base salary, but this relation is significantly negative for equity-based<br />
compensation and discretionary compensation (e.g. annual bonuses). Fahlenbrach (2004) finds a<br />
positive effect <strong>of</strong> CEO tenure on the level <strong>of</strong> CEO compensation. For instance, CEOs with a<br />
longer tenure have substantially higher equity incentives. Despite the fact that the previous<br />
empirical evidence is somewhat mixed, we hypothesize that CEO tenure is positively related to<br />
compensation levels:<br />
Hypothesis 9: CEO tenure is positively associated with pay levels.<br />
2.3.4. Tenure <strong>of</strong> supervisory board members<br />
Sapp (2007) finds a positive relation between the tenure <strong>of</strong> directors and the level <strong>of</strong> CEO<br />
compensation. Remarkably, he does not find such strong relationship for the compensation <strong>of</strong> the<br />
top five named executive <strong>of</strong>ficers.<br />
Hypothesis 10: tenure <strong>of</strong> supervisory board members is positively associated with CEO pay.<br />
30<br />
In addition, Sapp (2007) finds that the presence <strong>of</strong> representatives <strong>of</strong> the controlling shareholder on the board is related<br />
to lower executive compensation.
3. The Empirical Model and Data Description<br />
3.1. Models<br />
The hypotheses developed in chapter 2 will be tested using ordinary least-squares (OLS)<br />
regression analysis. To be able to compare the results <strong>of</strong> this analysis with prior studies, in<br />
particular the German studies <strong>of</strong> Elston and Goldberg (2003) and Haid and Yurtoglu (2006), we<br />
will use the following general empirical specification <strong>of</strong> CEO compensation:<br />
Ln (COMP)i,t = ß0 + ß1 ln(OWN)i,t + ß2ln(BOARD)i,t + ß3ln(Control)i,t, + ei,t (1)<br />
Where COMP represents the amount <strong>of</strong> compensation (measured as fixed, variable pay and total<br />
pay), OWN for ownership structure (ownership by external blockholders, type <strong>of</strong> blockholder, antitakeover<br />
measures and ownership by board members), BOARD for board structure (supervisory<br />
board size, supervisory board independence and tenure <strong>of</strong> board members) and CONTROL for<br />
the control variables (size, growth, performance and risk). Finally, i and t denote the firm and the<br />
time subscripts. The exact model and detailed definitions <strong>of</strong> the variables are presented in Exhibit<br />
3.<br />
Following Cyert et al (2002), all variables are expressed in natural logs with the exception <strong>of</strong> 0-1<br />
dummy variables, because existing literature (see paragraph 3.3.4.) as well as our own<br />
preliminary analysis indicates that firm size is the most influential determinant <strong>of</strong> the level <strong>of</strong> CEO<br />
compensation, and that this relation is best described as log linear.<br />
3.2. Sample and data sources<br />
We collected data for the three main stock market indices in the Netherlands, the AEX-index<br />
(large caps), the AMX-index (mid caps) and the AScX-index (small caps). Each index consists <strong>of</strong><br />
25 companies and usually is adjusted annually. This study uses the index-composition <strong>of</strong> 31<br />
December 2008 (see appendix A for a list <strong>of</strong> companies per index).<br />
For each company that is included in at least one <strong>of</strong> the three indices we collect data for three<br />
years (2006-2008). Since two companies are not listed on the Amsterdam Stock Exchange in<br />
2006, our initial sample covers 223 firm-year observations. Three companies do not have a CEO<br />
in place in one the sample years. To reduce the effect <strong>of</strong> extreme observations, we exclude<br />
outliers for both dependent and independent variables, which are defined as observations more<br />
than three standard deviations from the median. The resulting sample has 200 firm-year<br />
observations.
The data is collected from various sources. Compensation data are primarily obtained from Hewitt<br />
Associates. Missing compensation data is added using information taken from the annual<br />
<strong>report</strong>s 31 .<br />
Corporate governance data, including shareholdings by members <strong>of</strong> the management board and<br />
supervisory board, are also obtained from the annual <strong>report</strong>s. Data on substantial shareholdings<br />
are collected from the public database <strong>of</strong> the Netherlands Authority Financial Markets (AFM). As<br />
soon as the holding equals or exceeds 5% <strong>of</strong> the issued capital, the shareholder must <strong>report</strong> this.<br />
Subsequently, he must notify the AFM again when the holding reaches, exceeds or falls below a<br />
threshold 32 . With the revised law for substantial holdings (Wet Melding Zeggenschap) <strong>of</strong> 1<br />
October 2006, hereafter WMZ 2006, the transparency on substantial shareholdings has improved<br />
and a new database became available starting will all notifications as per 1 November 2006 33 .<br />
Previous public databases <strong>of</strong> the AFM (WMZ 1991 and WMZ 1996) were not accurate (see also<br />
De Jong et al, 2000). Finally, the control variables size and performance are obtained from<br />
Thomson One Banker.<br />
3.3. Measurement <strong>of</strong> variables<br />
3.3.1. Compensation variables<br />
We use three forms <strong>of</strong> compensation: base salary, variable pay and the sum <strong>of</strong> both, total<br />
compensation 34 . All data are expressed in 2008 euros to correct for inflation.<br />
Variable pay consists <strong>of</strong> short-term pay (the annual bonus) and the long-term pay (i.e. stock<br />
options, performance shares, stock appreciation rights, and other long-term cash bonuses). The<br />
annual bonus <strong>of</strong> year t is the bonus that belongs to the performance <strong>of</strong> year t. We correct for any<br />
time lag differences (e.g. the bonus <strong>of</strong> 2007, which is regularly being paid in 2008, is part <strong>of</strong> the<br />
variable pay for 2007). The grant value <strong>of</strong> long-term incentives is obtained from Hewitt Associates<br />
31<br />
From the 200 firm-year observations in our final sample, 13 firm-year observations were added form the annual <strong>report</strong>s<br />
as they were not part <strong>of</strong> the Hewitt database.<br />
32<br />
This can be caused by the acquisition or disposal <strong>of</strong> shares by the shareholder or because the issued capital <strong>of</strong> the<br />
issuing institution is increased or decreased. Thresholds are: 5%, 10%, 15%, 20%, 25%, 30%, 40%, 50%, 60%, 75% and<br />
95% (more details: www.afm.nl/registers/).<br />
33<br />
With the revised law for substantial holdings (Wet Melding Zeggenschap) <strong>of</strong> 1 October 2006, hereafter WMZ 2006, the<br />
transparency <strong>of</strong> substantial shareholdings has increased. As a consequence, a new public database was created for<br />
which all shareholders had to notify their substantial stakes as <strong>of</strong> 1 November 2006.<br />
34<br />
We do not use short-term pay and long-term pay separately because out <strong>of</strong> the original sample <strong>of</strong> 223 observations, 23<br />
companies do not pay an annual bonus and about a third <strong>of</strong> the companies (75 observations) does not grant a long-term<br />
incentive in one <strong>of</strong> the sample years. By combining both variable pay components, merely 10 out <strong>of</strong> 223 companies are<br />
left with no variable pay in any <strong>of</strong> the observed years. These companies are not part <strong>of</strong> the final sample as we label them<br />
as extreme observations (more than 3 standard deviations from the median). Besides methodological issues there is also<br />
economic reason why to exclude this group; because it mainly consists <strong>of</strong> companies that are not operating on a going<br />
concern basis. Two companies (5 observations) <strong>report</strong> net losses in each sample year. Spyker Cars, Van der Moolen (the<br />
latter went bankrupt in 2009), and three financials (AEGON, ING Group and SNS Reaal) have received additional core<br />
capital from the Dutch government to increase their capital base in the midst <strong>of</strong> the credit crisis. With the additional core<br />
capital support these financials are no longer entitled to any performance-related pay in 2008. Furthermore, delegated<br />
government representatives on the Supervisory Board <strong>of</strong> these firms have special veto rights with regard to compensation<br />
and M&A transactions.
in the Netherlands. Where compensation data was not available in the Hewitt database, we<br />
collected the data from annual <strong>report</strong>s and used the fair value <strong>of</strong> the equity-based instruments as<br />
stated in the annual accounts.<br />
Since compensation variables are highly skewed, we use the natural logarithm <strong>of</strong> one plus<br />
compensation as the dependent variable (see also Agrawal and Nasser, 2009).<br />
3.3.2. Ownership structure variables<br />
Outside blockholders<br />
A blockholder is defined as an outside investor, no member <strong>of</strong> either management or supervisory<br />
board nor an anti-takeover entity, who owns at least 5% <strong>of</strong> the cash flow rights or 5% <strong>of</strong> the voting<br />
power. We also exclude friendly organizations that are directly tied to the company and its<br />
management, like the Vereniging AEGON and Stichting Beheer SNS Reaal. These bodies still<br />
hold a large number (or even the majority) <strong>of</strong> common shares after the company became publicly<br />
listed and are considered as a de facto anti-takeover defense mechanism.<br />
As mentioned before, this 5% threshold triggers mandatory public filing in the Netherlands. The<br />
same threshold applies under SEC regulation. Hence, other studies like Cyert et al (2002),<br />
Mehran (1995) and Tosi and Gomez-Mejija (1989) also use this 5% cut-<strong>of</strong>f. Following Dlugosz et<br />
al (2005) we use voting power as opposed to investment power for our database when a<br />
distinction can be made between the two. This is also in line with La Porta et al (1999), who also<br />
rely on voting rights rather than cash flow rights. Recall from exhibit 2 that our primary interest is<br />
the balance <strong>of</strong> power, e.g. who has effective control over the firm.<br />
In our regression models we incorporate the combined voting power <strong>of</strong> all outside blockholders<br />
(e.g. substantial shareholders) at year-end 35 . We therefore treat the sum <strong>of</strong> all blockholdings as a<br />
continuous variable in contrast with previous studies which have expressed the presence <strong>of</strong> a<br />
blockholder owning at least 5% <strong>of</strong> the outstanding shares by means <strong>of</strong> a dummy variable (e.g.<br />
Core et al, 1999; Bertrand and Mullainathan, 2000).<br />
In prior research considerable attention is being paid to one particular group <strong>of</strong> blockholders, i.e.<br />
the institutional investors (see also paragraph 2.2.1.). In line with Almazan et al (2005) we<br />
distinguish two types <strong>of</strong> institutional investors. The first group “passive financial institutions”<br />
contains banks and insurance companies, like AEGON and ING Group, who might have<br />
35 Some studies use a time lag with regard to ownership variables. They incorporate the ownership structure <strong>of</strong> t-1. Given<br />
that equity ownership characteristics in a country are relatively stable over a certain period <strong>of</strong> time (see also La Porta et<br />
al., 2002), we do not expect that measuring them on year-end t would yield a significant bias in our results.
potentially conflicting direct commercial interests with their investments 36 . The second group<br />
“potentially active financials institutions” consists <strong>of</strong> large global asset managers (like Fidelity and<br />
Schroders), pension funds (like APG and PGGM), and more active specialized local asset<br />
managers (like Darlin and Todlin). The dummy variable TYPE equals one if the largest outside<br />
blockholder is classified as a “potentially active financials institutions” and zero otherwise.<br />
Anti-takeover measures<br />
Potential influence by outside blockholders can be mitigated by anti-takeover measures. Dutch<br />
companies use a number <strong>of</strong> anti-takeover measures (see Becht and Mayer, 2002; Eumedion<br />
,2009). The most common anti-takeover measures are preference shares, priority shares and<br />
certificates <strong>of</strong> shares.<br />
In the Netherlands, more than 50% <strong>of</strong> the AEX, AMX and AScX companies (Eumedion, 2009)<br />
have granted a legal entity (usually a foundation) an option to acquire preference shares in the<br />
capital <strong>of</strong> the company. This legal entity, the “Foundation”, can exercise this option in situations<br />
where, in the opinion <strong>of</strong> the Directors <strong>of</strong> the Foundation, the interest <strong>of</strong> the company, the business<br />
or the interests <strong>of</strong> stakeholders are at stake. Exercise <strong>of</strong> the option to acquire the preference<br />
shares could effectively dilute the voting power <strong>of</strong> the then outstanding ordinary shares.<br />
Priority shares are shares with special control rights on for example the nomination <strong>of</strong> directors,<br />
purchase and issue <strong>of</strong> shares or decisions on co-operation and mergers <strong>of</strong> business operations.<br />
The third anti-takeover protection measure is certificates <strong>of</strong> shares. Common shares are issued to<br />
an administrative <strong>of</strong>fice, which in turn issues depository certificates to other investors after<br />
detaching voting rights. Due to changes in legislation, certificate holders are nowadays able to<br />
vote. Nevertheless, administration <strong>of</strong>fices remain influential because they are entitled to vote for<br />
the certificate holders that do not use their voting powers.<br />
If a company has one <strong>of</strong> these anti-takeover measures or has a large friendly blockholder (as<br />
described above in the definition <strong>of</strong> an outside blockholder), like AEGON and SNS Reaal, than<br />
the dummy indicator ANTI-TAKE equals one; otherwise zero.<br />
Ownership by management board members<br />
36 Almazan, Hartzell and Starks (2005) also make a distinction between 1) active institutional investors, 2) passive<br />
institutional investors, and 3) other investors, (i.e., individuals). The first group (potentially active investors) includes the<br />
types <strong>of</strong> institutions we expect have more skilled employees, are more likely to collect information, face less regulatory<br />
and legal restrictions on their investments, and have less natural potential for business relations with the corporations:<br />
investment advisers and investment companies. The second group (potentially passive investors) consists <strong>of</strong> the bank<br />
trust departments and insurance companies.
Two dummy variables are included to capture for ownership by management board members.<br />
The first dummy CEO OWN equals one if the CEO owns at least 1% <strong>of</strong> the shares outstanding.<br />
The second dummy MB OWN equals one if the other members <strong>of</strong> the <strong>Management</strong> Board (the<br />
CEO excluded) together own 1% or more <strong>of</strong> the shares outstanding on year-end <strong>of</strong> each sample<br />
year 37 .<br />
Ownership by Supervisory Board members<br />
If the supervisory board members, including the Chairman, collectively own 1% or more <strong>of</strong> the<br />
year-end shares outstanding, than the dummy SB OWN equals one, otherwise zero.<br />
3.3.3. Board structure<br />
Supervisory Board size<br />
Larger or “overcrowded” supervisory boards are considered to be less effective and therefore<br />
easier influenced by the CEO (see Bebchuk and Fried, 2004; Core et al, 1999, Sapp, 2007). If a<br />
supervisory board size is larger than median, the dummy variable SB SIZE equals one, otherwise<br />
zero.<br />
Independence <strong>of</strong> the Supervisory Board members<br />
If one <strong>of</strong> the members <strong>of</strong> the supervisory board members does not qualify as independent in<br />
accordance with best practice provisions III.2.2 <strong>of</strong> the Dutch Corporate Governance Code, than<br />
the dummy SB INDEP equals one 38 .<br />
37 Agrawal and Nasser (2009) also use a 1% threshold for board members.<br />
38 Best practice provisions III.2.2.: “A supervisory board member shall be deemed to be independent if the following<br />
criteria <strong>of</strong> dependence do not apply to him. These criteria are that the supervisory board member concerned or his wife,<br />
registered partner or other life companion, foster child or relative by blood or marriage up to the second degree as defined<br />
under Dutch law:<br />
a) has been an employee or member <strong>of</strong> the management board <strong>of</strong> the company (including associated companies as<br />
referred to in Section 5:48 <strong>of</strong> the Financial Supervision Act (Wet op het financieel toezicht / Wft) in the five years prior to<br />
the appointment;<br />
b) receives personal financial compensation from the company, or a company associated with it, other than the<br />
compensation received for the work performed as a supervisory board member and in so far as this is not in keeping with<br />
the normal course <strong>of</strong> business;<br />
c) has had an important business relationship with the company, or a company associated with it, in the year prior to the<br />
appointment. This includes the case where the supervisory board member, or the firm <strong>of</strong> which he is a shareholder,<br />
partner, associate or adviser, has acted as adviser to the company (consultant, external auditor, civil notary and lawyer)<br />
and the case where the supervisory board member is a management board member or an employee <strong>of</strong> any bank with<br />
which the company has a lasting and significant relationship;<br />
d) is a member <strong>of</strong> the management board <strong>of</strong> a company in which a member <strong>of</strong> the management board <strong>of</strong> the company<br />
which he supervises is a supervisory board member;<br />
e) holds at least ten percent <strong>of</strong> the shares in the company (including the shares held by natural persons or legal entities<br />
which cooperate with him under an express or tacit, oral or written agreement);<br />
f) is a member <strong>of</strong> the management board or supervisory board - or is a representative in some other way - <strong>of</strong> a legal entity<br />
which holds at least ten percent <strong>of</strong> the shares in the company, unless such entity is a member <strong>of</strong> the same<br />
group as the company;<br />
g) has temporarily managed the company during the previous twelve months where management board members have<br />
been absent or unable to discharge their duties”.
Board tenure<br />
Another best provision <strong>of</strong> the Dutch Corporate Governance Code (III.3.5.) stipulates that<br />
supervisory board members are appointed for a maximum term <strong>of</strong> 12 years (3 terms <strong>of</strong> 4 years).<br />
We make a split in the tenure <strong>of</strong> a supervisory board member. A tenure <strong>of</strong> more than 6 years is<br />
considered as long. If the Chairman sits on the Supervisory board longer than 6 years, the<br />
dummy CHAIR TEN equals one. If the other Supervisory Board members have an average<br />
tenure <strong>of</strong> more than 6 years, the dummy SB TEN equals one. Likewise, the dummy CEO TEN<br />
equals one if the CEO’s tenure is longer than six years.<br />
3.3.4. Control variables<br />
As control variables we use economic determinants that have been commonly used in previous<br />
studies: firm size, growth opportunities, performance and risk 39 .<br />
Size<br />
Firm size is one <strong>of</strong> the best documented determinants <strong>of</strong> executive pay (i.e. Finkelstein and<br />
Hambrick, 1989 and Tosi et al, 2000). Larger firms tend to pay their executives more. This sizepay<br />
relation is also very strong for Dutch firms (e.g. Mertens et al, 2007 and Straath<strong>of</strong>, 2010). We<br />
use the natural logarithm <strong>of</strong> annual sales as proxy for firm size.<br />
Growth opportunities<br />
In firms with more growth options it is more difficult to observe managers' actions, because the<br />
results <strong>of</strong> these actions are more likely to materialize in future years. As a result, these firms may<br />
have more severe agency problems. Studies like Smith and Watts (1992), Mehran (1995), Core<br />
et al (1999), Bryan et al (2006) document that firms with more growth opportunities have make<br />
more use <strong>of</strong> equity based incentives which might result into higher total pay levels.<br />
Like Core et al (1999) and Bryan et al (2006) we use the market-to-book ratio as a proxy for its<br />
growth opportunities. This ratio is set equal to the year-end market capitalization divided by the<br />
book value <strong>of</strong> equity.<br />
Performance<br />
Next to size, the most studied variable is performance. Standard agency models suggest that the<br />
level <strong>of</strong> pay is an increasing function <strong>of</strong> firm performance. We therefore expect that firm<br />
performance is positively related to variable pay levels and therefore total compensation as well.<br />
The relation with base salary is, however, less straightforward. Firm performance is measured by<br />
39 Another control variable that is used frequently is “leverage”, see for example Yermack (1995), Bryan et al (2000),<br />
Florackis and Ozkan (2004) and Bryan et al. (2006). Since our sample includes financials, like banks and insurance<br />
companies, leverage is not included in this study.
an accounting measure, return on equity, and a market-based measure, the annual stock market<br />
return on the common stock (e.g. Core et al, 1999 and Mertens, Knop and Strootman, 2007).<br />
Risk<br />
Firm risk is also a potentially important determinant <strong>of</strong> the level <strong>of</strong> CEO compensation. However,<br />
literature has been unable to document a robust relation between firm risk and CEO<br />
compensation. Consistent with other empirical research on compensation (e.g. Core et al, 1999;<br />
Cyert et al, 2002 and Becker, 2009), we include share price volatility as a measure <strong>of</strong> firm risk.<br />
The share price volatility is calculated as standard deviation <strong>of</strong> the share price on a weekly basis<br />
in each year and annualized afterwards 40 . Similar to Core et al (1999) we expect an ambiguous<br />
relation between firm’s risk and CEO compensation.<br />
40 Standard deviation is annualized by multiplying the weekly standard deviation <strong>of</strong> the (natural) log weekly return by √52.
Exhibit 3: Model and variable definition<br />
Ln (COMP)i,t = ß0 + ß1 ln(SALES)i,t + ß2ln(MTB)i,t + ß3ln(ROE)i,t, + ß4ln(STK RTN)i,t,+ ß5ln(PRICE<br />
VOL)i,t + ß6ln(OUT BLK)i,t, + ß7 (TYPE)i,t ß8 (ANTI-TAKE)i,t + ß9 (CEO OWN)i,t + ß10 (MB OWN)i,t +<br />
ß11 (SB OWN)i,t + ß12 (SB SIZE)i,t + ß13 (SB INDEP)i,t ß14 (CEO TEN)i,t + ß15 (CHAIR TEN)i,t + ß16<br />
(SB TEN)i,t + ei,t<br />
Variable Definition (ln denotes natural logarithm)<br />
Compensation<br />
COMP (Compensation) Year t CEO compensation, specified as either (i) base salary, (ii)<br />
variable pay, (iii) total compensation, all expressed in 2008 euros.<br />
Economic determinants (control variables)<br />
SALES (sales) LN <strong>of</strong> the sales year-end t, expressed in 2008 euros (millions).<br />
MTB (Market-to-book ratio) LN <strong>of</strong> the end <strong>of</strong> year t ratio <strong>of</strong> the market to book value <strong>of</strong> equity.<br />
ACC RET (accounting return) 1 + year t accounting stock return, adjusted for inflation. Accounting<br />
return is measured as the return on equity.<br />
STK RTN (stock return) 1 + year t common stock return, adjusted for inflation.<br />
PRICE VOL (share price volatility) LN <strong>of</strong> the annual standard deviation in year t based on weekly stock<br />
returns.<br />
Ownership structure<br />
OUT BLK (Outside blockholders) LN (1 + fraction), whereby the fraction equals the total percentage <strong>of</strong><br />
voting power <strong>of</strong> all external blockholders for firm i on year-end t.<br />
TYPE (Type <strong>of</strong> largest blockholder) The dummy variable TYPE equals one if the largest outside<br />
blockholder is classified as “potential active institutional investor”,<br />
otherwise zero.<br />
ANTI-TAKE (anti-takeover measure) Dummy indicator ANTI-TAKE equals one if the company has an antitakeover<br />
device, otherwise zero.<br />
CEO OWN (CEO ownership) 1 if the CEO own more than 1% <strong>of</strong> total shares outstanding year-end<br />
t, 0 otherwise.<br />
MB OWN (<strong>Management</strong> Board ownership) 1 if the sum <strong>of</strong> all common shares owned by members <strong>of</strong> the<br />
management board (CEO excluded) is at least equal to 1%, 0<br />
otherwise.<br />
SB OWN (Supervisory Board ownership) 1 if the sum <strong>of</strong> all common shares owned by members <strong>of</strong> the<br />
Supervisory Board (Chairman included) is at least equal to 1%, 0<br />
otherwise.<br />
Board characteristics<br />
SB SIZE (Supervisory Board Size) It the number <strong>of</strong> supervisory board members in year t exceeds 5 (the<br />
median <strong>of</strong> the sample) than the dummy equals 1, zero otherwise.<br />
SB INDEP (Supervisory Board independence) Dummy indicator equals 1 if one <strong>of</strong> the SB members is not qualified<br />
as independent in accordance to the Dutch Governance Code.<br />
CEO TEN (CEO tenure) If the CEO’s tenure exceeds 6 years, than the dummy indicator<br />
equals 1, otherwise zero.<br />
CHAIR TEN (Chairman tenure) If the tenure <strong>of</strong> the Chairman <strong>of</strong> the SB exceeds 6 years, than the<br />
SB TEN (Tenure <strong>of</strong> other supervisory board<br />
members)<br />
dummy indicator equals 1, otherwise zero.<br />
If the average <strong>of</strong> the other SB members (excl. the Chairman) exceeds<br />
6 years, than the dummy indicator equals 1, otherwise zero.
3.4. Sample characteristics<br />
Table 1 presents the summary statistics (after pooling the observations <strong>of</strong> the three survey years)<br />
for the three compensation components and the independent variables. Compensation sales<br />
have been transformed into 2008 euros using the harmonized price index <strong>of</strong> the Netherlands<br />
(HCIP) 41,42 .<br />
Compensation<br />
The CEO’s median base salary is EUR 497,578, while the average base salary equals EUR<br />
583,466. The median variable compensation equals EUR 455,604. Mean variable pay is however<br />
substantially larger, EUR 973,480, which indicates the great variance <strong>of</strong> variable pay in our<br />
sample. Median total compensation <strong>of</strong> the CEO is equal to EUR 919,190 (mean: EUR 1,556,945).<br />
Economic determinants<br />
Panel B <strong>of</strong> table 1 shows that median sales are EUR 1.6 billion. The average sales amounts to<br />
EUR 10.4 billion euros, mainly caused by large cap companies as Royal Dutch Shell and ING<br />
Group that are part <strong>of</strong> the AEX index.<br />
Median stock returns are negative following the strong global declines in the stock markets as a<br />
result <strong>of</strong> the credit crisis. This also causes a strong increase in share price volatility from about<br />
25% in 2006 to over 50% in 2008 (not <strong>report</strong>ed). Average share price volatility is 35.2%. The<br />
return on equity, however, remains positive in our sample period. Finally, the median market-tobook<br />
ratio equals 2.0.<br />
Ownership structure<br />
Outside blockholders hold on average 31.2% <strong>of</strong> the shares outstanding (median 28.0%), which<br />
illustrates that the Netherlands lies between a fully dispersed ownership structure <strong>of</strong> Anglo-Saxon<br />
countries and strong ownership concentration like in Germany with dominant single blockholders.<br />
More than half <strong>of</strong> the companies (57.5%) use one or more anti-takeover measure and 28.5%<br />
have a “potentially active institutional investor” as largest blockholder.<br />
Almost twelve percent <strong>of</strong> the CEOs in our sample own at least 1% <strong>of</strong> the shares. This figure is<br />
2.5% for other members <strong>of</strong> the management board (excluding the CEO). For eight percent <strong>of</strong> the<br />
companies in our sample, the combined supervisory board (all members including the Chairman)<br />
owns at least 1% <strong>of</strong> the shares outstanding at year-end.<br />
41 http://statline.cbs.nl/StatWeb/publication/default.aspx?DM=SLNL&PA=71099ned&D1=a&D2=a%2c!0-<br />
134%2c!142&HDR=T&STB=G1&VW=D.<br />
42 We also used this HCIP index to convert return on equity and stock return from nominal returns to real returns.
Board characteristics<br />
Forty-five percent <strong>of</strong> the companies have a supervisory board consisting <strong>of</strong> more than 5<br />
members, the latter representing the median for the sample.<br />
An interesting finding is also that thirty-eight percent <strong>of</strong> the companies have at least one<br />
supervisory board member that does not qualify as independent accordancing to the Dutch<br />
Corporate Governance Code. Note, however, that the Dutch CG Code allows one supervisory<br />
board members to be qualified as non-independent, so the 38 percent should not be interpreted<br />
as the percentage <strong>of</strong> companies that is not compliant with the Dutch Corporate Governance<br />
Code.<br />
About 26 percent <strong>of</strong> the CEOs have tenure <strong>of</strong> more than 6 years. This percentage is 42 percent<br />
for Chairman <strong>of</strong> the supervisory board and 12 percent with regard to the average tenure <strong>of</strong> the<br />
other supervisory board members (excluding the Chairman).
Table 1: Descriptive statistics pooled sample (2006-2008)<br />
Panel A: CEO Compensation (euros)<br />
Mean Median Std Dev.<br />
Base salary 583,466 497,578 330,797<br />
Variable compensation 973,480 455,604 1,231,755<br />
Total compensation 1,556,945 919,190 1,511,676<br />
Panel B: Economic determinants<br />
Sales (millions <strong>of</strong> euros) 10,423 1,605 32,348<br />
Market-to-Book (x) 2.520x 1.996x 1.821x<br />
Stock return (%) -2.270% -2.305% 39.939%<br />
Return on equity (%) 15.320% 16.891% 18.173%<br />
Stock price volatility (%) 35.232% 31.257% 15.241%<br />
Panel C: Ownership structure<br />
% <strong>of</strong> shares held by outside blockholders 31.183% 27.960% 21.558%<br />
Anti-takeover i 0.575 1.000 0.496<br />
Potentially active institutional investor as largest blockholder i<br />
0.285 0.000 0.453<br />
CEO ownership (≥1%) i<br />
0.115 0.000 0.320<br />
MB members' ownership (≥1%) i<br />
0.025 0.000 0.157<br />
SB members' ownership (≥1%) i<br />
0.080 0.000 0.272<br />
Panel D: Board characteristics<br />
<strong>Management</strong> Board size >5 i<br />
Non-independent Supervisory Board members i<br />
CEO tenure >6 years i<br />
SB's Chairman tenure >6 years i<br />
Average tenure <strong>of</strong> other members <strong>of</strong> the SB >6 years i<br />
i: indicator variable equallling 0 or 1.<br />
0.450 0.000 0.499<br />
0.380 0.000 0.487<br />
0.260 0.000 0.440<br />
0.420 0.000 0.495<br />
0.120 0.000 0.326<br />
The sample consists <strong>of</strong> 200 annual observations <strong>of</strong> 75 firms betw een 2006 and 2008. Compensation amounts and sales are expressed<br />
in 2008 euro's. Total compensation is the sum <strong>of</strong> base salary and variable pay.
4. Empirical results<br />
4.1. Correlations<br />
Table 2 presents the correlations between the variables in our model. We will discuss the main<br />
independent variables below.<br />
Economic determinants<br />
Like previous studies, firm size, in this study proxied by sales, has the strongest correlation with<br />
all compensation components, total compensation (TOT. COMP.), base salary (BASE SAL.) and<br />
variable pay (VAR.PAY). The firm’s growth opportunities, measured by the market-to-book ratio<br />
is, as expected, positively and significantly (at a 1% level) related to total compensation and<br />
variable pay, but not to base salary. We find similar results for the performance measure return<br />
on equity. Stock return has a significant positive correlation with variable pay, but not with total<br />
compensation although the coefficient is positive. Share price volatility is negatively, and<br />
significantly, related to all forms <strong>of</strong> compensation.<br />
Ownership structure<br />
The total holdings <strong>of</strong> all outside blockholders have an inverse relation (significant at the 1% level)<br />
with all compensation components as predicted by hypothesis 1. In this hypothesis we predict<br />
that outside blockholders are negatively associated with executive pay levels. Large shareholders<br />
do have an important monitoring role and appear to restrain the levels <strong>of</strong> CEO pay. The variable<br />
“TYPE” - representing passive or active institutional investors - does not show a statistically<br />
significant relation with compensation. As a result, we find no evidence for our second<br />
hypothesis. Remarkably, the variable “TYPE” does have a significantly negative relation with the<br />
market-to-book ratio (MTB) and the sum <strong>of</strong> outside blockholdings, which would imply that<br />
potentially active institutional investors are less common in firms with higher growth opportunities<br />
or in firms with higher ownership concentrations. In line with our third hypothesis, anti-takeover<br />
measures do have a positive relation with all three compensation components, however only the<br />
correlation with variable pay is significant (at the 10% level). All three insider ownership variables<br />
are inversely related to CEO compensation as predicted by our hypotheses 4, 5 and 6.<br />
Noteworthy however, is that shareholdings by management board members have the strongest<br />
inverse relation with CEO compensation; total pay, base pay and variable pay have a negative<br />
correlation with management board ownership (excluding the CEO) and are significant at the 1%<br />
level. CEO ownership is also inversely related to all forms <strong>of</strong> CEO compensation, which is in line<br />
with hypothesis 6, but only the base salary coefficient is significant at the 5% level. Shareholdings<br />
by supervisory board members show similar results. Again, only the base salary coefficient is<br />
significant at the 5% level.
Table 2: Correlations<br />
1 2 3 4 5 6 7 8 9 10 11 12 13 14 15 16 17 18 19<br />
1 TOT. COMP 1.00<br />
2 BASE SAL. ,868*** 1.00<br />
3 VAR. PAY ,936*** ,698*** 1.00<br />
4 SALES ,816*** ,793*** ,734*** 1.00<br />
5 MTB ,236*** 0.07 ,348*** 0.14* 1.00<br />
6 ACC RET ,192*** 0.08 ,238*** ,178** ,395*** 1.00<br />
7 STK RET 0.09 0.01 ,151** 0.02 ,602*** ,335*** 1.00<br />
8 PRICE VOL -0.14* -,140** -0.12* -0.13* -,350*** -,227*** -,670*** 1.00<br />
9 BLK TOT -,435*** -,439*** -,312*** -,390*** 0.11 -0.01 0.04 0.10 1.00<br />
10 ANTI-TAKE 0.10 0.09 0.13* ,238*** 0.04 0.11 0.04 -0.09 -0.01 1.00<br />
11 TYPE -0.02 0.08 -0.09 -0.12 -,177** -0.02 0.04 -0.02 -,192*** -0.11 1.00<br />
12 CEO OWN -0.08 -,161** -0.01 -,142** 0.01 -0.03 0.10 0.06 -0.07 0.02 -0.12* 1.00<br />
13 MB OWN -,237*** -,283*** -,215*** -,252*** -0.05 -0.07 0.01 0.10 -0.05 -,186*** -0.10 ,243** 1.00<br />
14 SB OWN -0.10 -,184*** -0.04 -0.10 0.09 -0.09 0.01 0.10 -0.05 -0.12 -0.10 0.01 0.07 1.00<br />
15 SB SIZE ,678*** ,602*** ,626*** ,616*** ,151** 0.09 0.09 -,141** -,224*** ,229*** -0.08 -,169** -,145** -0.01 1.00<br />
16 SB INDEP -0.06 -0.09 -0.02 0.01 0.14* 0.00 -0.01 0.03 ,246*** -0.01 -,198*** -,185*** -0.13 ,301*** 0.10 1.00<br />
17 CEO TEN -0.04 0.00 -0.03 -0.07 -0.08 0.01 -0.09 0.11 -0.11 0.00 -0.02 ,394*** -0.02 -0.01 -,192*** -,300*** 1.00<br />
18 CHAIR TEN -0.03 -0.03 -0.03 0.03 -0.12 0.02 -0.10 0.03 0.08 ,219*** -,156** 0.04 -0.14 ,197*** -0.04 ,231*** 0.10 1.00<br />
19 SB TENURE -0.12* -0.09 -0.12 -0.10 0.02 -0.04 -0.02 0.05 ,224*** 0.01 -,165** -0.04 -0.06 0.00 -0.09 0.12 0.06 ,216*** 1.00<br />
*. Correlation is significant at the 0.10 level (2-tailed)<br />
**. Correlation is significant at the 0.05 level (2-tailed)<br />
***. Correlation is significant at the 0.01 level (2-tailed)
Board characteristics<br />
The size <strong>of</strong> the supervisory board has a strongly positive relation (significant at the 1% level) with<br />
total compensation, base salary or variable pay. This corresponds with earlier research <strong>of</strong> Core et<br />
al (1999), Sapp (2007), and is in line with Bebchuk and Fried’s (2004) claim that “overcrowded”<br />
board are less effective resulting in higher CEO compensation. Supervisory board independence<br />
is not found to be significantly related to CEO pay. Remarkable, however, is that the coefficient <strong>of</strong><br />
supervisory board independence is negative, contrary to the expected positive relation between<br />
supervisory board independence and compensation levels following hypotheses 7. Tenure <strong>of</strong> the<br />
CEO and supervisory board members are in most cases, and also in contrast with our<br />
predictions, negatively related to the various forms <strong>of</strong> CEO compensation. With the exception <strong>of</strong><br />
the correlation coefficient <strong>of</strong> the tenure <strong>of</strong> supervisory board members and total pay, which is<br />
significant at the 10% level, tenure <strong>of</strong> the CEO, chairman or other supervisory board members do<br />
not appear to be important determinants for the level <strong>of</strong> CEO pay in Dutch firms.<br />
4.2. Regression results<br />
The regression <strong>of</strong> CEO compensation on its economic determinants, ownership structure, board<br />
characteristics and year controls are presented in table 3. The first column contains the results for<br />
total compensation, whereas base salary and variable pay are <strong>report</strong>ed in second and third<br />
column. The coefficients for the year indicators are not <strong>report</strong>ed in the tables because they are<br />
not <strong>of</strong> direct interest to this study and also because our sample only covers three years.<br />
Total compensation<br />
In line with earlier studies we find that the size <strong>of</strong> a company is the most important determinant for<br />
the level <strong>of</strong> compensation 43 . The sales indicator has a coefficient <strong>of</strong> 0.24 which implies that for<br />
every 10% increase in firm size, the average compensation paid to CEO increases by about<br />
2.4%. As predicted, we also find a strong positive relation between CEO pay and the firm’s<br />
growth opportunities (measured by the market-to-book ratio). The other economic variables,<br />
performance and risk, do not have a significant relation.<br />
Outside blockholders are negatively related to the level <strong>of</strong> compensation at a 1% level <strong>of</strong><br />
significance. The coefficient <strong>of</strong> -0.81 implies that every 10% increase in the total percentage <strong>of</strong><br />
shares owned by outside blockholders lowers total CEO pay with 8.1%. Remarkably, antitakeover<br />
measures also lower CEO compensation in contrast to what we earlier predicted. It<br />
seems that anti-takeover mechanisms like administration <strong>of</strong>fices or friendly blockholders - in<br />
combination with the other explanatory variables - also play a monitoring role. The type <strong>of</strong><br />
43 The standardized beta is twice as large as that <strong>of</strong> second strongest independent variable.
investors, where we particularly focus on the “potential active institutional investor”, is not<br />
significantly related to total compensation.<br />
<strong>Management</strong> board ownership has a strong negative impact on the level <strong>of</strong> compensation in<br />
accordance with earlier predictions, the coefficient <strong>of</strong> -0.40 is significant at the 5% level.<br />
Shareholdings <strong>of</strong> supervisory board ownership are also inversely related to CEO pay but not<br />
significant on conventional levels. CEO ownership has, in contrast to our predictions, a positive,<br />
though insignificant coefficient.<br />
Looking at the board characteristics, the key variable is the size <strong>of</strong> the supervisory board. Larger<br />
(or “overcrowded”) supervisory boards appear to be less effective, which result in higher CEO<br />
compensation. The coefficient 0.49 implies that supervisory boards with more than 5 members<br />
pay their CEO 49% more. The other board structure variable that is significantly related to CEO<br />
pay is the independence <strong>of</strong> supervisory board members. Independent supervisory board<br />
members are negatively associated with the levels <strong>of</strong> pay (at the 10% level). Like anti-takeover<br />
measures, non-independent supervisory board members seem to have a monitoring role as well.<br />
Tenure <strong>of</strong> the CEO or supervisory board members are not statistically significant associated with<br />
total compensation.<br />
Base salary<br />
Again size is the most important determinant for the level <strong>of</strong> pay. As predicted growth<br />
opportunities are not significantly associated with base salary. Of the other economic indicators,<br />
only return on equity has a significant (and negative) relation with base pay.<br />
Outside blockholders and anti-takeover mechanisms are inversely related to base salary, which is<br />
in line with the results for total compensation. There are, however, some remarkable differences<br />
to total compensation as presented in column 1. Potentially active institutional investors have a<br />
positive impact on the level <strong>of</strong> base salary. A potential explanation might be that these investors<br />
are primarily focused on incentive based pay and pay-for-performance while being less<br />
concerned with the overall level <strong>of</strong> base salary given the fact that variable pay makes up for the<br />
lion’s share <strong>of</strong> executive pay in the Netherlands 44 . Another difference is that next to management<br />
board ownership, shareholdings <strong>of</strong> supervisory board members have a negative coefficient<br />
(significant at the 1% level) as well. Both variables reduce base salary with 28.8% and 22.5%.<br />
The size <strong>of</strong> the supervisory board is again the key variable with regard to board characteristics.<br />
Non-independence <strong>of</strong> supervisory board members is not significantly related to the base salary.<br />
44 In our sample, see table 1, mean base pay equals EUR 0.58 million, which is about 37.5% <strong>of</strong> total pay EUR 1.56 million.
However, in contrast to total compensation, CEO tenure is positively associated with base salary.<br />
The coefficient for the CEO tenure is 0.089, which means that CEOs with a longer tenure (more<br />
than 6 year in position) are paid 8.9% more than their counterparts with a shorter tenure. This is<br />
in line with our earlier predictions. Tenure <strong>of</strong> supervisory members is not significant at<br />
conventional levels.<br />
Variable pay<br />
Size and growth opportunities are the major determinants for variable pay. Return on equity and<br />
stock return are positively related, as predicted, but they do not have significant coefficients.<br />
Stock price volatility also has a positive, but insignificant, regression coefficient.<br />
In contrast to base salary and total compensation, outside blockholders do not have a significant<br />
impact on the level <strong>of</strong> variable pay (note that the coefficient remains negative). The type <strong>of</strong> largest<br />
outside blockholder is also not significant. From this we infer that insiders largely determine actual<br />
variable pay levels, within the boundaries set by the overall remuneration policy as (ex ante)<br />
approved by shareholders. In other words, the final decision for granting annual bonuses and<br />
long-term incentives is made by the supervisory board in consultation with the management<br />
board/CEO and related parties, e.g. anti-takeover entities like administration <strong>of</strong>fices and friendly<br />
blockholders. The outcome <strong>of</strong> this internal decision process depends on various factors. On the<br />
one hand, CEO ownership and larger supervisory board are associated with higher variable pay,<br />
while management board ownership and anti-takeover measure have a mitigating effect on the<br />
other hand.<br />
We finally note that the incremental adjusted R-squared is significant for every compensation<br />
variable (total pay, base pay and variable pay) indicating that ownership and board structure have<br />
additional explanatory power next to the economic control variables.
Table 3: Regression results full sample<br />
Predicted<br />
sign Total Base<br />
Variable<br />
pay<br />
Constant 12.427 *** 12.295 *** 9.940 ***<br />
26.240 37.324 10.464<br />
Sales + 0.242 *** 0.168 *** 0.359 ***<br />
11.043 10.976 8.161<br />
Market-to-Book + 0.230 *** 0.045 0.547 ***<br />
4.156 1.163 4.918<br />
Return on equity + -0.010 -0.200 * 0.126<br />
-0.064 -1.840 0.402<br />
Stock return + 0.113 0.036 0.246<br />
0.956 0.432 1.035<br />
Stock volatility ? -0.046 -0.078 0.091<br />
-0.411 -0.993 0.405<br />
Sum <strong>of</strong> all blockholders - -0.810 *** -0.439 *** -0.610<br />
-3.795 -2.954 -1.423<br />
Anti-takeover measure + -0.221 *** -0.140 *** -0.243 **<br />
-3.635 -3.315 -1.994<br />
Potential active inst. investor - 0.077 0.132 *** 0.020<br />
1.100 2.716 0.144<br />
CEO ownership ≥1%) - 0.150 -0.061 0.452 **<br />
1.468 -0.858 2.203<br />
MB ownership ≥1%) - -0.404 ** -0.288 ** -0.677 *<br />
-2.025 -2.076 -1.691<br />
SB ownership ≥1%) - -0.138 -0.225 *** -0.037<br />
-1.198 -2.795 -0.159<br />
Size supervisory board + 0.494 *** 0.232 *** 0.766 ***<br />
6.723 4.531 5.191<br />
Non-independence <strong>of</strong> SB members + -0.119 * -0.046 -0.172<br />
-1.752 -0.968 -1.258<br />
CEO ternure + -0.013 0.089 * 0.006<br />
-0.172 1.719 0.040<br />
Tenure chairman SB + 0.084 0.046 0.106<br />
1.301 1.036 0.823<br />
Tenure other SB members + -0.005 0.038 -0.126<br />
-0.051 0.612 -0.698<br />
Adjusted R 2<br />
0.771 *** 0.720 *** 0.657 ***<br />
F 38.274 29.426 22.190<br />
Incremental Adjusted R 2 form<br />
ownership and board structure<br />
variables<br />
0.087 *** 0.087 *** 0.052 ***<br />
F 6.320 5.169 2.522<br />
*. significant at the 0.10 level<br />
**. significant at the 0.05 level<br />
***. significant at the 0.01 level<br />
CEO compensation variable (n=200)
4.3. Robustness checks 45<br />
Consistent with previous studies, firm size has the greatest explanatory power for variations in all<br />
three types <strong>of</strong> CEO compensation. Given our small sample size we are not able to split our data<br />
into “small” versus “large” firms (e.g. Cyert et al, 2002). Alternatively, we run separate regressions<br />
in which we exclude either the top 20% <strong>of</strong> the largest firms (first quintile) or the bottom 20% <strong>of</strong> the<br />
smallest firms (fifth quintile). Results for total compensation and variable pay are <strong>report</strong>ed in table<br />
4.<br />
We start with total compensation presented in the first two columns. The first column <strong>report</strong>s the<br />
total compensation regression results for the sample without the 20% largest companies. The<br />
second column <strong>report</strong>s the results for the sample without the 20% smallest firms. In line with<br />
previous results presented in table 3, size, growth opportunities, outside blockholders, antitakeover<br />
measures and the size <strong>of</strong> the supervisory board are significant determinants in both<br />
regressions.<br />
There are also a number <strong>of</strong> differences. First, the regression model has a higher explanatory<br />
power if the 20% smallest firms are removed (similar results for the variable pay regression).<br />
Second, the constant in the second column is higher. As expected removal <strong>of</strong> the 20% smallest<br />
firms result in higher compensation levels. Third, management board ownership plays a<br />
significant role if the top 20% <strong>of</strong> the firms is removed. Because none <strong>of</strong> the larger firms have<br />
management boards owning at least 1% <strong>of</strong> the shares (management ownership <strong>of</strong> at least 1% is<br />
only apparent in smaller firms), this variable is not apparent in the second column. Fourth, nonindependence<br />
<strong>of</strong> supervisory board members has a significant negative impact for the subsample<br />
for the larger firms (column 2) while this coefficient is also negative, but insignificant, for the<br />
smallest firms <strong>report</strong>ed in column 1.<br />
Variable pay is presented in the third and fourth column. Again size, growth opportunities and<br />
size <strong>of</strong> the supervisory board are the significant variables in both sub samples.<br />
There are also a few remarkable differences between columns 3 and 4. Only for the sub-sample<br />
without the top 20% largest companies, presented in column 3, CEO ownership is significantly<br />
positively associated with variable pay. In addition, blockholders do have a significant inverse<br />
relation with total variable pay for larger firms (column 4), while this relation is also negative, but<br />
not significant for the smaller firms (column 3). Only in larger firms, non-independent supervisory<br />
board members have a significant negative relation with variable pay (at the 5% level).<br />
45 Although not <strong>report</strong>ed we have also performed the same regressions for a sub sample on only Dutch legal entities.<br />
Because non-Dutch (e.g. Royal Dutch Shell Plc. and Antonov Plc.) firms only account for a small fraction (5.5%) <strong>of</strong> our<br />
total sample <strong>of</strong> 200 firm-year observations, results do not change.
Overall, we find a number <strong>of</strong> resemblances between the two sub-samples. Size and growth<br />
opportunities remain the important economic determinants. Blockholders and anti-takeover<br />
measures lower CEO pay, while large supervisory boards are associated with higher pay levels.<br />
Notable differences are the impact <strong>of</strong> managerial ownership and non-independence <strong>of</strong><br />
supervisory board members. <strong>Management</strong> board ownership and CEO ownership are more<br />
important in smaller companies, while the monitoring function <strong>of</strong> non-independent is more <strong>of</strong><br />
significance in larger companies.
Table 4: Regression results without largest 20% firms and without bottom 20% firms<br />
Predicted<br />
sign<br />
Total compensation Variable compensation<br />
Without<br />
top 20%<br />
Without<br />
bottom<br />
20%<br />
Without<br />
top 20%<br />
Without<br />
bottom<br />
20%<br />
Constant 12.191 *** 12.601 *** 9.509 *** 11.696 ***<br />
22.234 20.237 8.458 9.824<br />
Sales + 0.237 *** 0.256 *** 0.366 *** 0.313 ***<br />
7.520 8.250 5.659 5.288<br />
Market-to-Book + 0.208 *** 0.256 *** 0.566 *** 0.423 ***<br />
2.966 4.192 3.939 3.623<br />
Return on equity + -0.001 0.062 0.218 0.215<br />
-0.006 0.345 0.624 0.622<br />
Stock return + 0.160 0.030 0.254 0.232<br />
1.129 0.229 0.872 0.932<br />
Stock volatility ? 0.034 -0.115 0.182 -0.155<br />
0.256 -0.892 0.666 -0.628<br />
Sum <strong>of</strong> all blockholders - -0.744 *** -0.712 *** -0.434 -0.826 *<br />
-2.962 -2.951 -0.843 -1.790<br />
Anti-takeover measure + -0.242 *** -0.263 *** -0.254 * -0.415 ***<br />
-3.269 -3.983 -1.679 -3.285<br />
Potential active inst. investor - 0.061 -0.039 0.040 -0.161<br />
0.712 -0.497 0.226 -1.081<br />
CEO ownership ≥1%) - 0.173 -0.126 0.541 ** -0.124<br />
1.469 -1.020 2.237 -0.528<br />
MB ownership ≥1%) - -0.454 ** na -0.715 na<br />
-2.092 na -1.609 na<br />
SB ownership ≥1%) - -0.191 0.086 -0.081 0.315<br />
-1.456 0.607 -0.300 1.166<br />
Size supervisory board + 0.530 *** 0.460 *** 0.804 *** 0.714 ***<br />
6.539 6.015 4.837 4.886<br />
Non-independence <strong>of</strong> SB members + -0.108 -0.188 ** -0.132 -0.353 **<br />
-1.316 -2.604 -0.786 -2.558<br />
CEO ternure + 0.014 -0.007 0.058 0.001<br />
0.165 -0.088 0.335 0.007<br />
Tenure chairman SB + 0.060 0.036 0.010 0.008<br />
0.777 0.520 0.065 0.058<br />
Tenure other SB members + 0.001 -0.004 -0.103 -0.250<br />
0.009 -0.044 -0.496 -1.338<br />
Adjusted R 2<br />
0.621 *** 0.751 *** 0.513 *** 0.617 ***<br />
F 15.480 29.426 10.311 16.063<br />
Incremental Adjusted R 2 form<br />
ownership and board structure<br />
variables 0.148 *** 0.093 *** 0.069 * 0.090 ***<br />
F 5.077 4.855 1.842 3.055<br />
*. significant at the 0.10 level<br />
**. significant at the 0.05 level<br />
***. significant at the 0.01 level<br />
CEO compensation variable (n=160)
5. Conclusions and summary<br />
The primary objective <strong>of</strong> this study is to better understand the impact <strong>of</strong> ownership characteristics<br />
and board structures on compensation <strong>of</strong> Chief Executive Officers (CEOs) <strong>of</strong> publicly listed firms<br />
in the Netherlands. In our study we focus on the level <strong>of</strong> total compensation, base salary and total<br />
variable pay 46 <strong>of</strong> the largest 75 companies over the three year period 2006-2008.<br />
In line with previous research we find that ownership and board structure variables have<br />
significant additional explanatory power over commonly used economic determinants like size,<br />
performance and growth opportunities.<br />
Outside blockholders significantly lower the levels <strong>of</strong> total CEO compensation. This finding may<br />
have important public policy implications. Long-term shareholders and active share ownership are<br />
currently subject to debate in the Netherlands, both firms and institutional investors are<br />
considering ways to improve long term relationships. Examples <strong>of</strong> this are the loyalty dividend as<br />
proposed by Royal DSM in 2007 to attract and reward long-term investors and Kemna and Van<br />
de Loo (2009), who suggest <strong>of</strong>fering pension funds preferential prudential treatment by lowering<br />
the risk for a portfolio consisting <strong>of</strong> 5% interests in the Financial Assessment Framework <strong>of</strong> the<br />
Dutch Central Bank (DNB). Regardless <strong>of</strong> the question whether these specific initiatives will prove<br />
to be successful, the underlying trend for promoting active long-term ownership by large<br />
shareholders might provide the right course because large shareholders are an effective monitor<br />
to curb executive pay levels which have been debated in Netherlands since the late nineties.<br />
In contrast to our predictions, anti-takeover measures also seem to play monitoring role and have<br />
a significant negative association with CEO compensation. This outcome is, however, the result<br />
<strong>of</strong> the interaction with other corporate governance variables. Additional research on the<br />
interaction between various governance variables is required.<br />
Ownership by other management board members (excluding the CEO) and supervisory board<br />
members are also negatively associated with levels <strong>of</strong> various forms <strong>of</strong> CEO compensation. The<br />
effects <strong>of</strong> CEO ownership on compensation levels are less conclusive at first glance. Additional<br />
robustness checks show that CEO ownership is positively associated with compensation levels in<br />
smaller firms, while it has a negative (but not significant) relation with pay in larger firms. Overall<br />
results suggest that managerial ownership is more prominent in smaller companies.<br />
46 The sum <strong>of</strong> short-term incentives (annual bonuses) and long-term incentives (i.e. options and performance shares).
With regard to the board characteristics, the pivotal factor appears to be the size <strong>of</strong> the<br />
supervisory board. Larger or “overcrowded” supervisory boards are less effective, which results in<br />
higher CEO compensation.<br />
The other board structure variable which is inversely related to CEO pay is the independence <strong>of</strong><br />
supervisory board members. This result especially holds for larger firms. Like anti-takeover<br />
measures, non-independent supervisory board members, amongst others former employees,<br />
members with large equity stakes or supervisory board members that are tied to a large investor<br />
or a bank, may have a monitoring role as well. Previous research shows that representatives <strong>of</strong><br />
the controlling shareholder on the board <strong>of</strong> directors are effective monitors and lower CEO<br />
compensation levels (Sapp, 2007; Agrawal and Nasser, 2009). Interesting to note is that<br />
Eumedion, the Dutch corporate governance platform for institutional investors, is currently<br />
investigating whether large shareholders should be more involved in nomination process <strong>of</strong><br />
supervisory board members 47 .<br />
CEOs with tenure <strong>of</strong> more than six years receive higher base salaries, but no significant relation<br />
is found for variable pay or total compensation. We also find no evidence that the tenure <strong>of</strong><br />
supervisory board members is significantly related to CEO pay.<br />
47 See Eumedion newsletter <strong>of</strong> January 2010,<br />
http://www.eumedion.nl/doccontrol/index.php?action=download&href=%2FNieuwsbrieven%2FNIEUWSBRIEF+2010-<br />
01.pdf
6. Future research directions<br />
Further research on the impact <strong>of</strong> ownership and board structure on executive compensation in<br />
the Netherlands should be primary aimed at collecting a larger sample size. This can done by<br />
either adding the number <strong>of</strong> companies, approximately 130 firms are listed on the Amsterdam<br />
Stock Exchange year-end 2008 while our sample only covers the largest 75 firms, or by<br />
extending the sample period 48 . The registers for substantial blockholders <strong>of</strong> the Dutch Authority<br />
for the Financial Markets before 2006 are not fully consistent, as discussed in Section 3, but with<br />
cross-examination <strong>of</strong> other sources like annual <strong>report</strong>s at least four years (2002-2005) can be<br />
added next to an up-date with 2009 figures.<br />
In addition to the variables included in this study, other compensation variables could be<br />
examined. Rather than the level <strong>of</strong> compensation, the pay mix (variable pay to total<br />
compensation) or incentive intensity (Bryan, Hwang and Lilien, 2000) could be added to the<br />
analysis.<br />
Additional insights might be gained by using different ownership and board structure variables.<br />
Ownership concentration could, for example, be measured with the Herfindahl index (FitzRoy and<br />
Schwalbach, 1990; Hartzell and Starks, 2003). Finally, the interaction between different corporate<br />
governance variables is a promising field for further research like for instance the relationship<br />
between different types <strong>of</strong> blockholders or owner-board interlocks (e.g. shareholders with board<br />
representatives).<br />
48 See Euronext Amsterdam Fact Book 2008
7. References<br />
Agrawal, A. and T. Nasser, 2009, “Blockholders on Board and CEO Compensation, Turnover and<br />
Firm Valuation”, Working paper, August version.<br />
Almazan, A., J.C. Hartzell and L.T. Starks, 2005, “Active Institutional Shareholders and Costs <strong>of</strong><br />
Monitoring: Evidence from Executive Compensation”, Financial <strong>Management</strong>, Winter, pp. 5-34.<br />
Allen, M.P., 1981, “Power and Privilege in the Large Corporation: Corporate Control and<br />
Managerial Compensation”, The American Journal <strong>of</strong> Sociology, Vol. 86, No. 5 (March), pp. 1112-<br />
1123.<br />
Armstrong, C.S., C.D. Ittner and D.F. Larcker, 2008, “Economic Characteristics, Corporate<br />
Governance, and the Influence <strong>of</strong> Compensation Consultants on Executive Pay Levels”, Working<br />
Paper, June 12 version.<br />
Balachandran, S., F. Ferri and D. Maber, 2007, “Solving the executive compensation problem<br />
through shareholder votes? - Evidence from the U.K.”, Working paper, November<br />
Bebchuk, L.A. and J. Fried, 2004, Pay without Performance: The Unfulfilled Promise <strong>of</strong> Executive<br />
Compensation, Harvard University Press.<br />
Becht, M. and C. Mayer, 2000, “Corporate Control in Europe”, Working Paper (this paper is a<br />
abridged version <strong>of</strong> the introduction <strong>of</strong> the book “The Control <strong>of</strong> Corporate Europe”, eds. F. Barca<br />
and M. Becht, Oxford University Press, 2001).<br />
Becker, B., J. Cronqvist and R. Fahlenbrach, 2009, “Estimating the Effects <strong>of</strong> Large Shareholders<br />
Using a Geographic Instrument”, Working Paper, June 23 version.<br />
Benz, M., M. Kucher and A. Stutzer, 2001, “Stock Options: The Managers’ Blessing: Institutional<br />
Restrictions and Executive Compensation.” Working paper, University <strong>of</strong> Zurich Institute for<br />
Empirical <strong>Research</strong> in Economics.<br />
Bertrand, M. and S. Mullainathan, 2000, “Agents with and without Principals”, The American<br />
Economic Review, Vol. 90, No. 2, pp. 203-208.<br />
Boot, A., G. Mertens and P. Wallage, 2008, “De boer op met ons model”, Het Financieele<br />
Dagblad, May 13, pp.9.<br />
Bryn, S., L. Hwang, S. Lilien, 2000, “CEO Stock-BAsed Compensation: An Empirical Analysis <strong>of</strong><br />
Incentive-Intensity, Relative Mix and Economic Determinants:, Journal <strong>of</strong> Business, 2000, Vol. 73,<br />
No. 4, pp.661-693.<br />
Bryn, S., R. Nash and A. Patel, 2006, “The Structure <strong>of</strong> Executive Compensation: International<br />
Evidence from 1996-2004”, Working Paper.<br />
Carter, M.E. and V. Zamora, 2008, “Shareholder Remuneration Votes and CEO Compensation<br />
Design”, Working paper, April<br />
Cools, K. and J. Winters, 2008, “Heldere doelstelling”, Het Financieele Dagblad, August 15, p.15.
Core, J.E., W.R. Guay and R.S. Thomas, 2005, “Is U.S. CEO Compensation Broken”, Journal <strong>of</strong><br />
Applied Corporate Finance, Vol. 14, No. 4 (Fall), pp. 97-104.<br />
Core, J.E., R.W. Holthausen and D.F. Larcker, 1999, “Corporate governance, chief executive<br />
<strong>of</strong>ficer compensation, and firm performance”, Journal <strong>of</strong> Financial Economics, Vol. 51, pp. 371-<br />
406.<br />
Cornelisse, R.J.M., P.J.W. Duffhues and R. Kabir, 2005, “Beloning van topbestuurders<br />
en ondernemingsprestaties in Nederland”, Economische Statistische Berichten, 9 September, pp.<br />
390-394.<br />
Cyert, R.M., S-H. Kang and P. Kumar, 2002, ”Corporate Governance, Takeovers, and Top-<br />
<strong>Management</strong> Compensation: Theory and Evidence”, <strong>Management</strong> Science, Vol. 48, No. 4, pp.<br />
453-469.<br />
Dlugosz, J., R. Fahlenbrach, P. Gompers, and A. Metrick, 2005, “Large Blocks <strong>of</strong> Stock:<br />
Prevalence, Size and Measurement“, Working Paper, January version.<br />
Duffhues, P. en R. Kabir, 2008, “Is the pay – performance relationship always positive? Evidence<br />
from the Netherlands”, Journal <strong>of</strong> Multinational Financial <strong>Management</strong>, Vol. 18, pp. 45-60.<br />
Dutch Corporate Governance Code, revised version 2008, www.corpgov.nl<br />
Dyl, E.A., 1988, “Corporate Control and <strong>Management</strong> Compensation: Evidence on the Agency<br />
Problem”, Managerial and Decision Economics, Vol. 9, No. 1, pp. 21-25.<br />
Ees, van, H, G. van der Laan, E.J.P. Engesaeth en C.A.S. Selker, 2007, “De relatie tussen de<br />
bezoldiging van bestuurders van beursgenoteerde ondernemingen en de prestaties van deze<br />
ondernemingen”, <strong>Research</strong> <strong>report</strong> commsisioned by the Dutch Corporate Governance Code<br />
Monitoring Committee, Rijksuniversiteit Groningen/Towers Perrin.<br />
Elston, J.A. and L.G. Goldberg, 2003, “Executive Compensation and Agency Costs in Germany”,<br />
Journal <strong>of</strong> Banking and Finance, Vol. 27, pp. 1391-1410.<br />
Eumedion, 2009, “Evaluatie AVA-seizoen 2009”, 9 July,<br />
http://www.eumedion.nl/news/item/Eumedion_publiceert_evaluatie_AVA-<br />
seizoen_2009/235?mid=.<br />
Fahlenbrach, R., 2004, “Shareholder Rights and CEO Compensation”, Working Paper, Version<br />
April 22 nd .<br />
Ferrarini, G., N. Moloney and C. Vespro, 2003, “Executive Remuneration in the EU: Comparative<br />
Law and Practice”, Working Paper, June version, http://ssrn.com/abstract=419120.<br />
Finkelstein, S. and D.C. Hambrick, 1988, “Chief Executive Compensation: A Synthesis and<br />
Reconciliation”, Strategic <strong>Management</strong> Journal, Vol. 9, pp.543-558.<br />
Finkelstein, S. and D.C. Hambrick, 1989, “Chief Executive Compensation: A Study <strong>of</strong> the<br />
Intersection <strong>of</strong> Markets and Political Processes”, Strategic <strong>Management</strong> Journal, Vol. 10, pp.121-<br />
134.
Finkelstein, S. and D.C. Hambrick, 1995, “The Effects <strong>of</strong> Ownership structure on the Conditions<br />
at the Top: The Case <strong>of</strong> CEO Pay Raises”, Strategic <strong>Management</strong> Journal, Vol. 16, pp.175-193.<br />
FitzRoy, F.R., Schwalbach, J., 1990, "Managerial compensation and firm performance: Some<br />
evidence from West Germany”, Discussion Paper FS IV 90-20.<br />
Florackis, C. and A. Ozkan, 2004, “Agency costs and coporate governance mechanisms:<br />
Evidence for UK firms”, Working Paper.<br />
Gompers, P. A., J.L. Ishii, and A. Metrick, 2003, “Corporate Governance and Equity Prices”,<br />
Quarterly Journal <strong>of</strong> Economics, 118, p. 107-155.<br />
Haid, A. and B. B. Yurtoglu, 2006, “Ownership Structure and Executive Compensation in<br />
Germany”, Working paper.<br />
Hartzell, J.C. and L.T. Starks, 2003, “Institutional Investors and Executive Compensation”,<br />
Journal <strong>of</strong> Finance, Vol. 58, No. 6, pp. 2351-2374.<br />
Hewitt, 2009, Report on Eurotop 100 Director’s Remuneration.<br />
Institutional Shareholder Services, 2007, “What International Markets Say on Pay – An Investor<br />
Perspective”, April, http://www.riskmetrics.com/system/files/private/SayOnPay.pdf.<br />
Jensen, M.C. and W.H. Meckling, 1976, “Theory <strong>of</strong> the Firm: Managerial Behavior, Agency Costs<br />
and Ownership Structure”, Journal <strong>of</strong> Financial Economics, 3, pp. 305-360.<br />
Jensen, M.C. and K.J. Murphy, 2004, “Remuneration: Where we’ve been, how we got to here,<br />
what are the problems, and how to fix them”, Finance working paper no. 44/2004, July,<br />
www.ecgi.org/wp<br />
De Jong, A., R. Kabir, T. Marra and A. Röell, 2000, “Ownership and Control in the Netherlands”,<br />
In The Control <strong>of</strong> Coporate Europe, edited by F. Barca and M. Becht.<br />
Khan, R., D. Dharwadkar and P. Brandes, 2005, “Institutional ownership and CEO compensation:<br />
a longitudinal examination”, Journal <strong>of</strong> Business <strong>Research</strong>, 58, pp. 1078-1088.<br />
Kemna, A. and E. van de Loo, 2009, “Role <strong>of</strong> institutional investors in relation to management<br />
boards and supervisory directors - A triangular survey”, <strong>Research</strong> <strong>report</strong> commsisioned by<br />
Eumedion, http://www.eumedion.nl/page/downloads/Kemna_Van_De_Loo_Report_FINAL_-<br />
_English.pdf.<br />
Kemna, A. and G. Mertens, 2009, “Executive long-term pay and firm performance in The<br />
Netherlands: Evidence from new data on individual executive compensation”, Working paper,<br />
April.<br />
Lambert, R.A., D.F. Larcker and K. Weigelt, 1993, “The Structure <strong>of</strong> Organizational Incentives“,<br />
Administrative Science Quarterly, Vol. 38, No. 3 (Sep), pp. 438-461.<br />
La Porta, R., F. Lopez-de-Silanes, A. Shleifer, R.W. Vishny, 1998, "Law and Finance", The<br />
Journal <strong>of</strong> Political Economy, Vol. 106, No. 6 (Dec.), pp. 1113-1155.<br />
La Porta, R., F. Lopez-de-Silanes, A. Shleifer, 1999, “Corporate Ownership around the World<br />
Source”, The Journal <strong>of</strong> Finance, Vol. 54, No. 2 (Apr), pp. 471-517.
Maatman, R., 2004, “Tabaksblat en de botsende doelstellingen”, Ondernemingsrecht, Nr. 4, pp.<br />
116-120.<br />
Mehran, H., 1995, “Executive compensatin structure, ownership, and firm performance”, Journal<br />
<strong>of</strong> Financial Economics, Vol. 38, pp. 163-184.<br />
Mertens, G., N. Knop and R. Strootman, 2007, “Pay-for-performance in Nederland 2002-2006 –<br />
De praktijk en aanbevelingen voor de toekomst”, Working paper,<br />
http://www.rsm.nl/portal/page/portal/RSM2/attachments/pdf1/Pay-<br />
Performance%20Onderzoek%20Nederlandse%20Beursfondsen%202002-.pdf.<br />
Mertens, G. and N. Knop, 2008, Relative performance evaluation in the Netherlands – An<br />
empirical study on current market practices amongst large Dutch companies, Erasmus Institute<br />
Monitoring & Compliance, http://www.toezichtencompliance.nl/publicaties?id=26.<br />
Otten, J, 2007, “Theories on executive pay: A literature overview and critical assessment”,<br />
Working Paper, December, Electronic copy available at: http://ssrn.com/abstract=1088272<br />
Otten, J., H. Schenk, and A. Verwer, 2008, “ De Code Tabaksblat en de beloning van CEO’s in<br />
Nederland“, Maandblad voor Accountancy en Bedrijfseconomie, Vol. 82, October, pp.445-453.<br />
RiskMetrics Group, 2008, “A Pan-European Perspective on Executive Remuneration – Case<br />
Studies from the 2008 Proxy Season”, October 24,<br />
http://www.riskmetrics.com/docs/2008paneuropean_perspective_remuneration<br />
Sapp, S., M. Bryant, and J. Cotte, 2007, “What are real concerns in the design <strong>of</strong> CEO<br />
compensation contracts”, Manuscript Ivey Business <strong>School</strong>.<br />
Sapp, S.G., 2007, “The Impact <strong>of</strong> Corporate Governance on Executive Compensation”, Working<br />
Paper, Version December 9, http://ssrn.com/abstract=1107943<br />
Schäfer, D., 2010, “Bosch chief criticises banks“, Financial Times, 27 January.<br />
Schmid, F.A., 1997, "Vorstandbezuge, Aufsichtsratsvergutung und Aktionarsstruktur“, Zeitschrift<br />
für Betriebswirtschaft, 1, pp. 67–83.<br />
Shin, J.Y., 2005, “The Composition <strong>of</strong> Institutional Ownership and the Structure <strong>of</strong> CEO<br />
Compensation”, Working Paper, Version January 10.<br />
Shleifer, A. and R. Vishny. 1986. Large shareholders and corporate control. Journal <strong>of</strong><br />
Political Economy, Vol. 94, No. 3, pp. 461-488.<br />
Smith, C.W. and R.L. Watts, 1992, “The investment opportunity set and corporate financing,<br />
dividend, and compensation policies”, Journal <strong>of</strong> Financial Economics, Vol. 32, pp. 263-292.<br />
Smith, G.S. and P.L. Swan, 2007, “Too Good to be True: Do Concentrated Institutional Investors<br />
Really Executive Compensation whilst Raising Incentives?”, Working Paper, Version November<br />
11, http://ssrn.com/abstarct=979525<br />
Straath<strong>of</strong>, B, S. Groot and J. Möhlmann, 2010, “Hoge bomen in de polder - Globalisering en<br />
topbeloningen in Nederland”, CPB Document, No 199,<br />
http://www.cpb.nl/nl/pub/cpbreeksen/document/199/doc199.pdf.
Tosi, H.L. and L.R. Gomez-Meija, 1989, “The Decoupling <strong>of</strong> CEO Pay and Performance: An<br />
Agency Theory Perspective”, Administrative Science Quarterly, Vol. 34, No. 2 (Jun.), pp. 169-<br />
189.<br />
Tosi, H.L., S. Werner, J.P. Katz and L.R. Gomez-Meija, 2000, “How much does performance<br />
matter? A meta-analysis <strong>of</strong> CEO pay studies”, Journal <strong>of</strong> <strong>Management</strong>, Vol. 26, No. 2, pp. 301-<br />
339.<br />
Yermack, D.,1995, “Do corporation award CEO stock options effectively?”, Journal <strong>of</strong><br />
Financial Economics, Vol. 39, pp. 237-269.<br />
Yermack, D.,1997, “Good Timing: CEO Stock Option Awards and Company News<br />
Announcements”, Journal <strong>of</strong> Finance, Vol. 52, No. 2. (June), pp. 449-476.<br />
Other information sources:<br />
� www.afm.nl<br />
� Annual <strong>report</strong>s 2006-2008<br />
� www.cbs.nl<br />
� Thomson One Banker
Appendix A: Sample composition<br />
Index composition per 12-31-2008<br />
Large Cap Mid Cap Small Cap<br />
AEX AMX AScX<br />
1 Aegon Aalberts Accell Group<br />
2 Ahold AMG Antonov<br />
3 Akzo Arcadis Ballast Nedam<br />
4 Arcelor Mittal ASM International Beter Bed<br />
5 ASM Litho BinckBank Brunel<br />
6 BAM Group Boskalis Eriks<br />
7 Corio Crucell Exact Holding<br />
8 DSM CSM Fornix<br />
9 Fortis Draka Gamma<br />
10 Fugro Eurocomm. Prop. Grontmij<br />
11 Heineken Heijmans InnoConcepts<br />
12 ING Imtech Kardan<br />
13 KPN Logica Kas Bank<br />
14 Philips Nutreco Macintosh<br />
15 Randstad Océ Nieuwe Steen Inv.<br />
16 RD Shell-A Mediq (OPG Group) Qurius<br />
17 Reed Elsevier Ordina Sligro<br />
18 SBM Offshore Pharming Spyker Cars<br />
19 TNT Smit Super de Boer<br />
20 TomTom SNS Reaal Telegraaf<br />
21 Unibail-Rodamco KTC TKH Group<br />
22 Unilever Vastned Retail Unit 4<br />
23 USG people Vopak Van Lanschot<br />
24 Wereldhave Wavin Van der Moolen<br />
25 Wolters Kluwer Wessanen Vastned Offices/Ind.