impact of high oil prices on freight transportation: modal shift ...
impact of high oil prices on freight transportation: modal shift ...
impact of high oil prices on freight transportation: modal shift ...

You also want an ePaper? Increase the reach of your titles
YUMPU automatically turns print PDFs into web optimized ePapers that Google loves.
TECHNICAL REPORT - IMPACT OF HIGH OIL PRICES ON FREIGHT TRANSPORTATION:<br />
MODAL SHIFT POTENTIAL IN FIVE CORRIDORS<br />
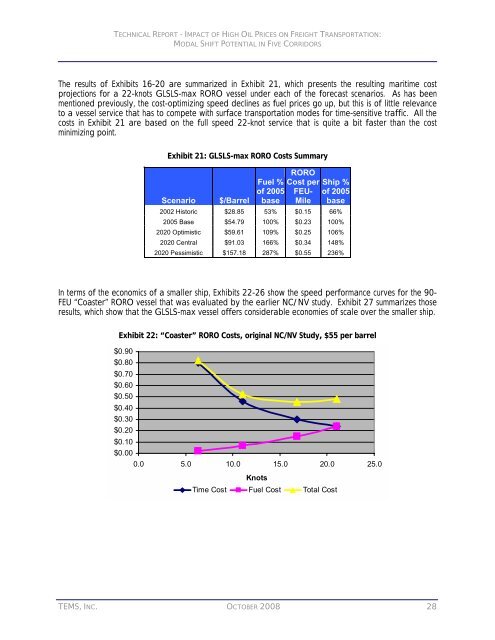
The results <str<strong>on</strong>g>of</str<strong>on</strong>g> Exhibits 16-20 are summarized in Exhibit 21, which presents the resulting maritime cost<br />
projecti<strong>on</strong>s for a 22-knots GLSLS-max RORO vessel under each <str<strong>on</strong>g>of</str<strong>on</strong>g> the forecast scenarios. As has been<br />
menti<strong>on</strong>ed previously, the cost-optimizing speed declines as fuel <str<strong>on</strong>g>prices</str<strong>on</strong>g> go up, but this is <str<strong>on</strong>g>of</str<strong>on</strong>g> little relevance<br />
to a vessel service that has to compete with surface transportati<strong>on</strong> modes for time-sensitive traffic. All the<br />
costs in Exhibit 21 are based <strong>on</strong> the full speed 22-knot service that is quite a bit faster than the cost<br />
minimizing point.<br />
Exhibit 21: GLSLS-max RORO Costs Summary<br />
Scenario $/Barrel<br />
Fuel %<br />
<str<strong>on</strong>g>of</str<strong>on</strong>g> 2005<br />
base<br />
In terms <str<strong>on</strong>g>of</str<strong>on</strong>g> the ec<strong>on</strong>omics <str<strong>on</strong>g>of</str<strong>on</strong>g> a smaller ship, Exhibits 22-26 show the speed performance curves for the 90-<br />
FEU “Coaster” RORO vessel that was evaluated by the earlier NC/NV study. Exhibit 27 summarizes those<br />
results, which show that the GLSLS-max vessel <str<strong>on</strong>g>of</str<strong>on</strong>g>fers c<strong>on</strong>siderable ec<strong>on</strong>omies <str<strong>on</strong>g>of</str<strong>on</strong>g> scale over the smaller ship.<br />
Exhibit 22: “Coaster” RORO Costs, original NC/NV Study, $55 per barrel<br />
$0.90<br />
$0.80<br />
$0.70<br />
$0.60<br />
$0.50<br />
$0.40<br />
$0.30<br />
$0.20<br />
$0.10<br />
$0.00<br />
TEMS, INC. OCTOBER 2008<br />
RORO<br />
Cost per<br />
FEU-<br />
Mile<br />
Ship %<br />
<str<strong>on</strong>g>of</str<strong>on</strong>g> 2005<br />
base<br />
2002 Historic $28.85 53% $0.15 66%<br />
2005 Base $54.79 100% $0.23 100%<br />
2020 Optimistic $59.61 109% $0.25 106%<br />
2020 Central $91.03 166% $0.34 148%<br />
2020 Pessimistic $157.18 287% $0.55 236%<br />
0.0 5.0 10.0 15.0 20.0 25.0<br />
Time Cost<br />
Knots<br />
Fuel Cost Total Cost<br />
28