

Journal of Language Teaching and Research Contents - Academy ...
Journal of Language Teaching and Research Contents - Academy ...
Journal of Language Teaching and Research Contents - Academy ...

Create successful ePaper yourself
Turn your PDF publications into a flip-book with our unique Google optimized e-Paper software.
JOURNAL OF LANGUAGE TEACHING AND RESEARCH<br />
A. Underlining Scoring<br />
© 2011 ACADEMY PUBLISHER<br />
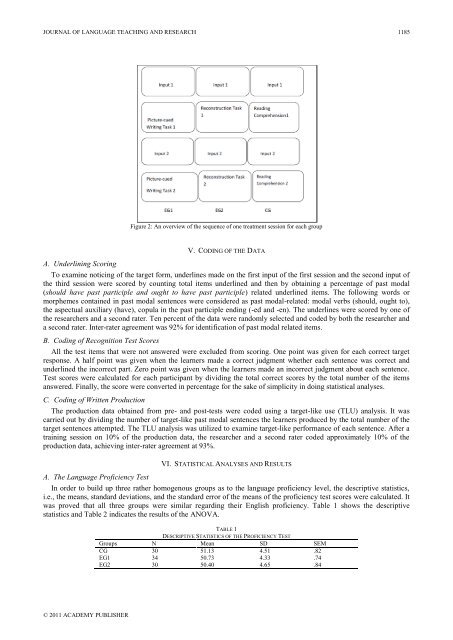
Figure 2: An overview <strong>of</strong> the sequence <strong>of</strong> one treatment session for each group<br />
V. CODING OF THE DATA<br />
To examine noticing <strong>of</strong> the target form, underlines made on the first input <strong>of</strong> the first session <strong>and</strong> the second input <strong>of</strong><br />
the third session were scored by counting total items underlined <strong>and</strong> then by obtaining a percentage <strong>of</strong> past modal<br />
(should have past participle <strong>and</strong> ought to have past participle) related underlined items. The following words or<br />
morphemes contained in past modal sentences were considered as past modal-related: modal verbs (should, ought to),<br />
the aspectual auxiliary (have), copula in the past participle ending (-ed <strong>and</strong> -en). The underlines were scored by one <strong>of</strong><br />
the researchers <strong>and</strong> a second rater. Ten percent <strong>of</strong> the data were r<strong>and</strong>omly selected <strong>and</strong> coded by both the researcher <strong>and</strong><br />
a second rater. Inter-rater agreement was 92% for identification <strong>of</strong> past modal related items.<br />
B. Coding <strong>of</strong> Recognition Test Scores<br />
All the test items that were not answered were excluded from scoring. One point was given for each correct target<br />
response. A half point was given when the learners made a correct judgment whether each sentence was correct <strong>and</strong><br />
underlined the incorrect part. Zero point was given when the learners made an incorrect judgment about each sentence.<br />
Test scores were calculated for each participant by dividing the total correct scores by the total number <strong>of</strong> the items<br />
answered. Finally, the score were converted in percentage for the sake <strong>of</strong> simplicity in doing statistical analyses.<br />
C. Coding <strong>of</strong> Written Production<br />
The production data obtained from pre- <strong>and</strong> post-tests were coded using a target-like use (TLU) analysis. It was<br />
carried out by dividing the number <strong>of</strong> target-like past modal sentences the learners produced by the total number <strong>of</strong> the<br />
target sentences attempted. The TLU analysis was utilized to examine target-like performance <strong>of</strong> each sentence. After a<br />
training session on 10% <strong>of</strong> the production data, the researcher <strong>and</strong> a second rater coded approximately 10% <strong>of</strong> the<br />
production data, achieving inter-rater agreement at 93%.<br />
A. The <strong>Language</strong> Pr<strong>of</strong>iciency Test<br />
VI. STATISTICAL ANALYSES AND RESULTS<br />
In order to build up three rather homogenous groups as to the language pr<strong>of</strong>iciency level, the descriptive statistics,<br />
i.e., the means, st<strong>and</strong>ard deviations, <strong>and</strong> the st<strong>and</strong>ard error <strong>of</strong> the means <strong>of</strong> the pr<strong>of</strong>iciency test scores were calculated. It<br />
was proved that all three groups were similar regarding their English pr<strong>of</strong>iciency. Table 1 shows the descriptive<br />
statistics <strong>and</strong> Table 2 indicates the results <strong>of</strong> the ANOVA.<br />
TABLE 1<br />
DESCRIPTIVE STATISTICS OF THE PROFICIENCY TEST<br />
Groups N Mean SD SEM<br />
CG 30 51.13 4.51 .82<br />
EG1 34 50.73 4.33 .74<br />
EG2 30 50.40 4.65 .84<br />
1185


