Metalurgija: sadašnjost Metallurgy: Present Metalurgija ... - CARNet
Metalurgija: sadašnjost Metallurgy: Present Metalurgija ... - CARNet
Metalurgija: sadašnjost Metallurgy: Present Metalurgija ... - CARNet

Create successful ePaper yourself
Turn your PDF publications into a flip-book with our unique Google optimized e-Paper software.
A. NAGODE et al.: STRUCTURAL AND THERMODYNAMIC ANALYSIS OF WHISKERS ON THE SURFACE...<br />
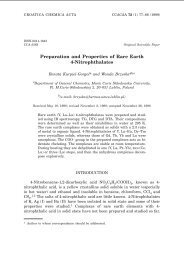
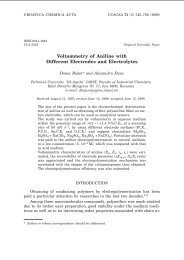
Figure 2 Surface of grey cast iron covered with whiskers; SEI<br />
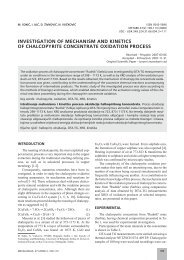
Figure 3 Typical oxide pattern after black oxide coating; SEI<br />
trast) and the inner (dark contrast) oxide layers However,<br />
a detailed EDXS analysis (Table 1) shows that<br />
whiskers as well as the upper part of the outer oxide<br />
layer is composed of pure Fe-oxide, while in the lower<br />
oxide layer EDXS analysis indicates FeMn-oxides. The<br />
EDXS analysis of the inner oxide layer (dark contrast)<br />
confi rms the presence of Fe, Mn and Cr; however, the<br />
increased content of Si indicates that the inner layer is<br />
composed of Si-rich Fe(MnCr) oxide.<br />
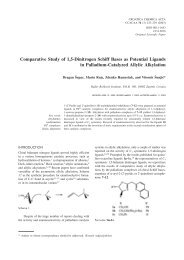
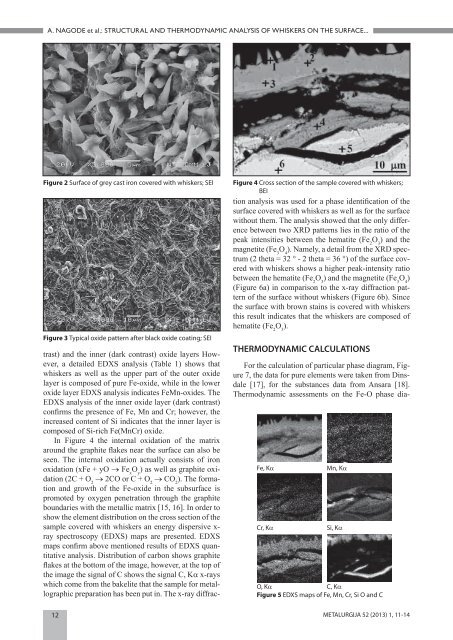
In Figure 4 the internal oxidation of the matrix<br />
around the graphite fl akes near the surface can also be<br />
seen. The internal oxidation actually consists of iron<br />
oxidation (xFe + yO → Fe x O y ) as well as graphite oxidation<br />
(2C + O 2 → 2CO or C + O 2 → CO 2 ). The formation<br />
and growth of the Fe-oxide in the subsurface is<br />
promoted by oxygen penetration through the graphite<br />
boundaries with the metallic matrix [15, 16]. In order to<br />
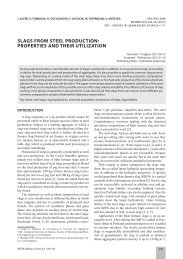
show the element distribution on the cross section of the<br />
sample covered with whiskers an energy dispersive xray<br />
spectroscopy (EDXS) maps are presented. EDXS<br />
maps confi rm above mentioned results of EDXS quantitative<br />
analysis. Distribution of carbon shows graphite<br />
fl akes at the bottom of the image, however, at the top of<br />
the image the signal of C shows the signal C, Kα x-rays<br />
which come from the bakelite that the sample for metallographic<br />
preparation has been put in. The x-ray diffrac-<br />
Figure 4 Cross section of the sample covered with whiskers;<br />
BEI<br />
tion analysis was used for a phase identifi cation of the<br />
surface covered with whiskers as well as for the surface<br />
without them. The analysis showed that the only difference<br />
between two XRD patterns lies in the ratio of the<br />
peak intensities between the hematite (Fe 2 O 3 ) and the<br />
magnetite (Fe 3 O 4 ). Namely, a detail from the XRD spectrum<br />
(2 theta = 32 ° - 2 theta = 36 °) of the surface covered<br />
with whiskers shows a higher peak-intensity ratio<br />
between the hematite (Fe 2 O 3 ) and the magnetite (Fe 3 O 4 )<br />
(Figure 6a) in comparison to the x-ray diffraction pattern<br />
of the surface without whiskers (Figure 6b). Since<br />
the surface with brown stains is covered with whiskers<br />
this result indicates that the whiskers are composed of<br />
hematite (Fe 2 O 3 ).<br />
THERMODYNAMIC CALCULATIONS<br />
For the calculation of particular phase diagram, Figure<br />
7, the data for pure elements were taken from Dinsdale<br />
[17], for the substances data from Ansara [18].<br />
Thermodynamic assessments on the Fe-O phase dia-<br />
Fe, Kα Mn, Kα<br />
Cr, Kα Si, Kα<br />
O, Kα C, Kα<br />
Figure 5 EDXS maps of Fe, Mn, Cr, Si O and C<br />
12 METALURGIJA 52 (2013) 1, 11-14