PhD Reza Erfanzadeh 2009 - Ghent Ecology - Universiteit Gent
PhD Reza Erfanzadeh 2009 - Ghent Ecology - Universiteit Gent
PhD Reza Erfanzadeh 2009 - Ghent Ecology - Universiteit Gent

Create successful ePaper yourself
Turn your PDF publications into a flip-book with our unique Google optimized e-Paper software.
<strong>Ghent</strong> University<br />
Faculty of Sciences<br />
Department of Biology<br />
Terrestrial <strong>Ecology</strong> Unit<br />
K.L. Ledeganckstraat 35<br />
BE- 9000 <strong>Ghent</strong><br />
www.ecology.ugent.be<br />
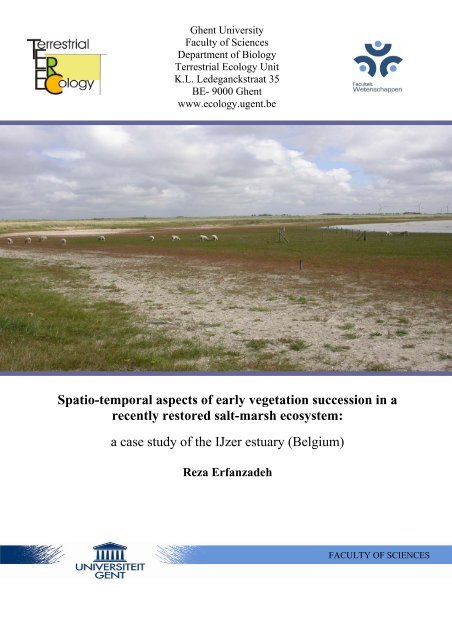
Spatio-temporal aspects of early vegetation succession in a<br />
recently restored salt-marsh ecosystem:<br />
a case study of the IJzer estuary (Belgium)<br />
<strong>Reza</strong> <strong>Erfanzadeh</strong><br />
FACULTY OF SCIENCES
Spatio-temporal aspects of early vegetation succession in a<br />
recently restored salt-marsh ecosystem:<br />
a case study of the IJzer estuary (Belgium)<br />
<strong>Reza</strong> <strong>Erfanzadeh</strong><br />
Thesis submitted in partial fulfilment of the requirements for the degree of<br />
Doctor in Sciences<br />
(Biology)<br />
Promotor:<br />
Prof. Dr. Maurice Hoffmann<br />
<strong>Ghent</strong> University<br />
<strong>2009</strong>
Spatio-temporal aspects of early vegetation succession in a<br />
recently restored salt-marsh ecosystem:<br />
a case study of the IJzer estuary (Belgium)<br />
<strong>Reza</strong> <strong>Erfanzadeh</strong><br />
Promotor:<br />
Prof. Dr. Maurice Hoffmann<br />
<strong>Ghent</strong> University, Department Biology, Terrestrial <strong>Ecology</strong> Unit; Research Institute for<br />
Nature and Forest, Department of Biodiversity and Natural Environment, Brussels, Belgium<br />
Co-promotor:<br />
Prof. Dr. Jean-Pierre Maelfait<br />
<strong>Ghent</strong> University, Department Biology, Terrestrial <strong>Ecology</strong> Unit; Research Institute for<br />
Nature and Forest, Department of Biodiversity and Natural Environment, Brussels, Belgium<br />
Reading Committee:<br />
Prof. Dr. Patrick Meire<br />
University of Antwerp, Department of Biology, Research Group Ecosystem Management,<br />
Belgium<br />
Prof. Dr. Paul Goetghebeur<br />
<strong>Ghent</strong> University, Department of Biology, Research Group Spermatophytes, Belgium<br />
Prof. Dr. Frederik Hendrickx<br />
<strong>Ghent</strong> University, Department of Biology, Terrestrial <strong>Ecology</strong> Unit; KBIN, Department of<br />
Entomology, Brussels, Belgium<br />
Dr. Julien Pétillon<br />
Université de Rennes, Biodiversité Fonctionelle et Gestion Territoriale, France<br />
Dr. Jurgen Tack<br />
Research Institute for Nature and Forest, Brussels, Belgium<br />
Examination Committee:<br />
Prof. Dr. Luc Lens<br />
<strong>Ghent</strong> University, Department of Biology, Terrestrial <strong>Ecology</strong> Unit, Belgium<br />
Prof. Dr. Maurice Hoffmann<br />
<strong>Ghent</strong> University, Department Biology, Terrestrial <strong>Ecology</strong> Unit; Research Institute for<br />
Nature and Forest, Department of Biodiversity and Natural Environment, Brussels, Belgium<br />
Prof. Dr. Jean-Pierre Maelfait<br />
<strong>Ghent</strong> University, Department Biology, Terrestrial <strong>Ecology</strong> Unit; Research Institute for<br />
Nature and Forest, Department of Biodiversity and Natural Environment, Brussels, Belgium<br />
Project start: September 01, 2004<br />
Public defence: April 30, <strong>2009</strong><br />
During the period of the project <strong>Reza</strong> <strong>Erfanzadeh</strong> had a research grant provided by the Iranian<br />
Ministry of Science, Research and Technology.<br />
III
To My Wife, Fatemeh<br />
For my sons, Pourya and Parham<br />
V
Acknowledgements<br />
The accomplishment of this study would never have been possible without the help of<br />
many people and organizations to whom I have the honour of expressing my appreciation and<br />
gratitude.<br />
I would like to extremely thank my supervisor Prof. Dr. Maurice Hoffmann whose help<br />
in writing the research proposal at the beginning of the program and field sampling helped me<br />
to finish the thesis. I would like to especially thank my co-promotor Prof. Dr. Jean-Pierre<br />
Maelfait for his professional advice and experience sharing particular in writing and making<br />
the structure of the thesis. Indeed without his help, the thesis could not have been completed.<br />
Although, he sadly passed away but he will always stay in my heart. Dr. Julien Pétillon has<br />
also supervised me during the writing of the thesis. My gratitude also goes to him for his<br />
constructive comments and helps from the day he joined us until the end of the project.<br />
Indeed, words are not enough to express my gratitude to Prof. M. Hoffmann and Dr. J.<br />
Pétillon, but I take great pleasure in thanking them for their valuable advice and their patience<br />
in helping and coaching me. I wish them success in their scientific and personal life.<br />
I would also like to thank Angus Garbutt for very useful and valuable comments that<br />
clarified and improved two chapters. I would like to thank Amelia Curd and Philip Maelfait<br />
for their revision of the English of some chapters. I also thank Prof. Dr. Dries Bonte for his<br />
statistical advice in the analyses of the data. I also thank Dr. ir. Beatrijs Bossuyt for her<br />
comments on preliminary chapters.<br />
I would also like thank the members of the Reading Committee; Prof. Dr. Patrick Meire,<br />
Prof. Dr. Frederik Hendrickx, Prof. Dr. Paul Goetghebeur and Dr. Jurgen Tack and the<br />
additional member of the Examination Committee, Prof. Dr. Luc Lens for their valuable and<br />
constructive comments during the predefence.<br />
VII
VIII<br />
This work could not have been completed without the scientific, technical and logistic<br />
support of the Research Institute for Nature and Forest (INBO) in Brussels. My special thanks<br />
go to the INBO employees Edward Vercruysse for his help with vegetation sampling and<br />
plant species identification, and Tanja Milotic for her help with vegetation sampling for<br />
forage quality measurements. I also thank the VLIZ (the Flanders Marine Institute) and the<br />
department for Maritime and Coastal Service (MDK) of the Flemish Community for the use<br />
of their greenhouse infrastructure. I particularly wish to thank Frank Broucke of MDK and his<br />
son who provided daily technical support in the greenhouse experiment.<br />
I would never have been able to complete my study and stay in Belgium without the<br />
support of my friends. Acknowledgement and special thanks to my colleagues Dr. Rahmat<br />
Zarkami, Nele Somers, Bram D'hondt, Bram Vanthournout, Sam Provoost, Soheil Iegderi, Dr.<br />
Ataollah Ebrahimi and Dr. Pejman Tahmasebi for their help and support, I learned a lot from<br />
them. The secretarial support was capably provided by Angelica Alcantara, Viki Vandomme<br />
and Hans Matheve who are appreciated.<br />
I pursued this study under an awarded scholarship of the Ministry of Science, Research<br />
and Technology of Islamic Republic of Iran, which is highly appreciated.<br />
Finally, I would like to dedicate my special thanks to my family. I am especially<br />
thankful to my wife for her accompanying me to Belgium. Fatemeh, I heartily thank you for<br />
your patience and the peaceful environment that you created for me and our sons during my<br />
study abroad.
List of Abbreviations<br />
ADF Acid Detergent Fibre<br />
AOAC Association of Official Analytical Chemists<br />
CANOCO CANOnical Community Ordination<br />
CCA Canonical Correspondence Analysis<br />
CP Crude Protein<br />
DCA Detrended Correspondence Analysis<br />
DE Digestible Energy<br />
GDHW Gemiddeld Doodtij HoogWater (mean neap tide high water)<br />
GHW Gemiddeld HoogWater (mean high water)<br />
GLM General Linear Modelling<br />
GSHW Gemiddeld Springtij HoogWater (mean spring tide high water)<br />
INBO Instituut voor Natuur en BOsonderzoek<br />
LEDA Life-history traits of the northwest European flora DAtabase<br />
LIFE L'Instrument Financier pour l'Environnement (the financial instrument for environment)<br />
LSD Least Significant Difference<br />
MHW Mean High Water<br />
NDF Neutral Detergent Fibre<br />
NGI National Geographical Institute<br />
NIRS Near-Infrared Spectroscopy procedure<br />
PCA Principal Component Analysis<br />
psu practical salinity units<br />
SD Standard Deviation<br />
SE Standard Error<br />
SPSS Statistical Package for the Social Sciences<br />
TAW Tweede Algemene Waterpassing (second general levelling)<br />
TWINSPAN Two Way Indicator Species ANalysis<br />
VLIZ VLaams Instituut voor de Zee (The Flanders Marine Institute )<br />
IX
Table of contents<br />
CHAPTER 1 GENERAL INTRODUCTION ............................................................................................... 1<br />
1.1 WHAT IS SUCCESSION? ......................................................................................................................... 2<br />
1.1.1 Temporal and spatial aspects of succession.................................................................................... 2<br />
1.2 GENERAL CONSIDERATIONS ON SUCCESSION IN SALT-MARSH HABITAT................................................ 3<br />
1.2.1 The facilitation mechanism ............................................................................................................. 4<br />
1.2.2 The tolerance mechanism................................................................................................................ 4<br />
1.2.3 The inhibition mechanism ............................................................................................................... 5<br />
1.3 WHAT IS KNOWN ABOUT SALT-MARSH SUCCESSION ............................................................................. 6<br />
1.3.1 Which species are able to be the first colonizers in a salt-marsh?.................................................. 7<br />
1.3.2 Inundation, vegetation and succession.......................................................................................... 10<br />
1.3.3 Grazing and succession................................................................................................................. 11<br />
1.3.4 The effect of soil conditions on vegetation in different successional stages.................................. 14<br />
1.3.5 Seed bank and succession ............................................................................................................. 16<br />
1.4 THE REASONS WHY TO STUDY SUCCESSION IN A RESTORATION PROGRAM.......................................... 17<br />
1.5 MATERIAL AND METHODS .................................................................................................................. 18<br />
1.5.1 The recently history of the study area ........................................................................................... 18<br />
1.5.2 Materials ....................................................................................................................................... 24<br />
1.6 THE RESTORATION INTEREST OF SALT-MARSHES ................................................................................ 26<br />
1.7 WHY PERMANENT PLOTS?................................................................................................................... 28<br />
1.8 OBJECTIVES AND OUTLINE OF THE THESIS .......................................................................................... 29<br />
CHAPTER 2 FACTORS AFFECTING THE SUCCESS OF EARLY SALT-MARSH COLONIZERS:<br />
SEED AVAILABILITY RATHER THAN SITE SUITABILITY AND DISPERSAL TRAITS ................. 33<br />
2.1 ABSTRACT .......................................................................................................................................... 34<br />
2.2 INTRODUCTION ................................................................................................................................... 36<br />
2.3 MATERIAL AND METHODS.................................................................................................................. 38<br />
2.3.1 Study area ..................................................................................................................................... 38<br />
2.3.2 Seed production in the reference site ............................................................................................ 40<br />
2.3.3 Seed bank in the restoration site ................................................................................................... 40<br />
2.3.4 Vegetation cover within the restoration and reference sites ......................................................... 41<br />
2.3.5 Plant traits and site suitability ...................................................................................................... 42<br />
2.3.6 Statistical analyses........................................................................................................................ 42<br />
2.4 RESULTS ............................................................................................................................................. 43<br />
2.4.1 Seed production at the reference site ............................................................................................ 43<br />
2.4.2 Seed bank at the restoration site ................................................................................................... 44<br />
2.4.3 Vegetation cover within the restoration site and adjacent local salt-marsh ................................. 44<br />
2.4.4 Plant traits..................................................................................................................................... 47<br />
2.5 DISCUSSION ........................................................................................................................................ 47<br />
2.6 CONCLUSIONS..................................................................................................................................... 52<br />
CHAPTER 3 INUNDATION FREQUENCY DETERMINES THE POST-PIONEER<br />
SUCCESSIONAL PATHWAY IN A NEWLY CREATED SALT-MARSH................................................. 53<br />
3.1 ABSTRACT .......................................................................................................................................... 54<br />
3.2 INTRODUCTION ................................................................................................................................... 56<br />
3.3 MATERIAL AND METHODS .................................................................................................................. 59<br />
3.3.1 Study area ..................................................................................................................................... 59<br />
3.3.2 Data collection.............................................................................................................................. 59<br />
3.3.2.1 Vegetation..................................................................................................... 59<br />
3.3.2.2 Inundation frequency.................................................................................... 60<br />
3.3.3 Data analysis................................................................................................................................. 60<br />
3.4 RESULTS ............................................................................................................................................. 62<br />
3.4.1 Variation in cover (and frequency) of individual species.............................................................. 62<br />
3.4.2 Change in richness, the cover of growth forms and composition (DCA1 and DCA2) .................. 64<br />
3.4.3 Curve estimation ........................................................................................................................... 66<br />
3.4.4 Species turnover and inundation frequency .................................................................................. 68<br />
3.4.5 Change in plant communities........................................................................................................ 70<br />
XI
XII<br />
3.5 DISCUSSION ........................................................................................................................................ 71<br />
CHAPTER 4 SHORT-TERM IMPACT OF SHEEP GRAZING ON SALT-MARSH VEGETATION<br />
SUCCESSION IN A NEWLY CREATED SALT-MARSH SITE.................................................................. 75<br />
4.1 ABSTRACT .......................................................................................................................................... 76<br />
4.2 INTRODUCTION ................................................................................................................................... 78<br />
4.3 MATERIAL AND METHODS .................................................................................................................. 80<br />
4.3.1 Study area ..................................................................................................................................... 80<br />
4.3.2 Methods......................................................................................................................................... 81<br />
4.3.3 Forage quality............................................................................................................................... 81<br />
4.3.4 Data analysis................................................................................................................................. 83<br />
4.4 RESULTS ............................................................................................................................................. 84<br />
4.4.1 The effect of grazing on species richness, total cover and plant community composition ............ 84<br />
4.4.2 The effect of grazing on biomass and forage quality parameters ................................................. 88<br />
4.4.3 Forage quality parameters in different individual species............................................................ 90<br />
4.5 DISCUSSION ........................................................................................................................................ 91<br />
4.6 CONCLUSION ...................................................................................................................................... 94<br />
CHAPTER 5 ENVIRONMENTALLY DETERMINED SPATIAL PATTERNS OF ANNUAL<br />
PLANTS IN EARLY SALT-MARSH SUCCESSION VERSUS STOCHASTIC DISTRIBUTION IN OLD<br />
SALT-MARSH CONDITIONS ......................................................................................................................... 95<br />
5.1 ABSTRACT .......................................................................................................................................... 96<br />
5.2 INTRODUCTION ................................................................................................................................... 98<br />
5.3 MATERIAL AND METHODS.................................................................................................................. 99<br />
5.3.1 Study area and vegetation............................................................................................................. 99<br />
5.3.2 Soil analysis ................................................................................................................................ 100<br />
5.3.3 Data analysis............................................................................................................................... 101<br />
5.4 RESULTS ........................................................................................................................................... 102<br />
5.4.1 Composition and environmental factors ..................................................................................... 102<br />
5.4.2 The results of logistic regression................................................................................................. 105<br />
5.5 DISCUSSION ...................................................................................................................................... 106<br />
5.6 CONCLUSION .................................................................................................................................... 109<br />
CHAPTER 6 THE EFFECT OF SUCCESSIONAL STAGE AND SALINITY ON THE VERTICAL<br />
DISTRIBUTION OF SEEDS IN SALT-MARSH SOILS ............................................................................. 111<br />
6.1 ABSTRACT ........................................................................................................................................ 112<br />
6.2 INTRODUCTION ................................................................................................................................. 114<br />
6.3 MATERIAL AND METHODS................................................................................................................ 116<br />
6.3.1 Study areas.................................................................................................................................. 116<br />
6.3.2 Data collection............................................................................................................................ 117<br />
6.3.3 Data analysis............................................................................................................................... 118<br />
6.4 RESULTS ........................................................................................................................................... 119<br />
6.4.1 Seed bank properties and succession stage................................................................................. 119<br />
6.4.2 Seed bank properties and salinity ............................................................................................... 124<br />
6.4.3 Seed bank properties in different three salt-marshes .................................................................. 124<br />
6.5 DISCUSSION ...................................................................................................................................... 127<br />
6.6 CONCLUSION .................................................................................................................................... 131<br />
CHAPTER 7 GENERAL CONCLUSIONS .............................................................................................. 133<br />
7.1 CONSTRAINTS ON SPECIES COLONIZATION........................................................................................ 136<br />
7.2 THE EFFECT OF INUNDATION FREQUENCY ON VEGETATION SUCCESSION .......................................... 138<br />
7.3 GRAZING AND SUCCESSION............................................................................................................... 139<br />
7.4 RELATIONSHIP BETWEEN SOIL CHARACTERISTIC AND VEGETATION IN DIFFERENT STAGES............... 140<br />
7.5 SEED BANK AND SUCCESSION ........................................................................................................... 141<br />
7.6 MANAGEMENT IMPLICATIONS........................................................................................................... 142<br />
7.7 LINES OF FUTURE RESEARCH ............................................................................................................ 144<br />
REFERENCES.................................................................................................................................................. 147<br />
SUMMARY ....................................................................................................................................................... 187<br />
APPENDICES................................................................................................................................................... 191
Chapter 1 General introduction
1.1 What is succession?<br />
2<br />
Succession is a fundamental concept in ecology. Many definitions are given in the<br />
literature. Simple but straightforward definitions are: the change in species composition or<br />
three-dimensional architecture of the plant cover of a specified place through time (Pickett &<br />
Cadenasso 2005) or the changes observed in an ecological community following a<br />
perturbation that opens up a relatively large space (Connel & Slatyer 1977). In fact,<br />
succession is the continuous change in the species composition of natural communities that<br />
results from many causes and processes (Glenn-Lewin et al. 1992), particularly the<br />
colonization, growth and mortality of organisms under environmental conditions that are<br />
continuously changing as a result of either the actions of the organisms themselves (autogenic<br />
succession) or of externally imposed processes (allogenic succession) or both (Huston 1994).<br />
Grime (1979) considers succession as the change in predominant kinds of life histories of the<br />
plant species, succession being a shift in the relative importance of ruderal, competitive and<br />
stress-tolerant species. Succession occurs, with different rates and patterns, in all natural<br />
communities, and is the fundamental process of vegetation dynamics (Huston 1994).<br />
1.1.1 Temporal and spatial aspects of succession<br />
Vegetation succession has temporal and spatial aspects (e.g. Southall et al. 2003).<br />
Indeed, time and space are related, in that forcing functions for vegetation change over large<br />
areas tend to be the same as those causing change over long time periods, and likewise for<br />
small areas and short time spans the causes of change are supposed to be similar (Shugart &<br />
Urban 1988; Falinski 1988). An inherent property of succession that is responsible for much<br />
of the confusion surrounding the interpretation of successional patterns and the development<br />
of a theory of succession is that succession creates both temporal and spatial patterns (Huston<br />
1994). Temporal succession refers to vegetation changing (progressive or retrogressive) in
time (Glenn-Lewin & van der Maarel 1992), while spatial variation in vegetation can result<br />
from a single successional sequence (sere) that occurs under similar conditions (i.e. resource<br />
availability, soil characteristics, differentiated disturbance; e.g. Olff et al. 1999) and follows<br />
the same pattern of species composition at different locations (Huston 1994). Spatial variation<br />
in vegetation can also be caused by succession that occurs under different conditions in<br />
different locations (Ferreira et al. 2007) and follows different patterns of species composition<br />
toward different endpoints (Huston 1994).<br />
Succession, particularly plant succession, was one of the first major research topics of<br />
the field of ecology (Huston 1994). The observation of temporal and spatial changes in plant<br />
communities has a long history, and use of the term ‘Succession’ dates back at least to<br />
Thoreau, 1860 (cf. Huston 1994) and Clements, 1916 (cf. Pickett & Cadenasso 2005) and has<br />
been a challenging problem in ecological studies up to the present (Drury & Nisbet 1973;<br />
West et al. 1981; Smith & Huston 1989; Prach et al. 2001; Kahmen & Poschlod 2004;<br />
Wolters et al. 2008). The spatio-temporal variation in vegetation patterns and its driving<br />
forces are of great and ongoing concern in ecology and there have been studies dealing with<br />
the theme of succession in various habitats and ecosystems, of which the books and papers of<br />
Connell & Slatyer (1977), Tilman (1985), Huston & Smith (1987), Turner et al. (1998) and<br />
Kahmen & Poschlod (2004) are among the more conceptual ones.<br />
1.2 General considerations on succession in salt-marsh habitat<br />
The succession on salt-marshes, whose pioneer vegetation is regularly submerged by<br />
seawater, is often described as consecutive stages, known as haloseres. Succession may start<br />
in a newly created salt-marsh (primary succession). On the other hand, vegetation may<br />
undergo succession after being damaged but not destroyed, called secondary succession<br />
(Adam 1990). Secondary succession occurs after salt-marsh vegetation has been damaged by<br />
clipping or by excessive trampling and grazing. Wash-over processes in salt-marshes may<br />
3
completely destroy the existing vegetation by covering it by storm-driven sediment, but in<br />
other cases it can grow through a thin layer of fresh sediment. Secondary succession can also<br />
start on a mature soil if plant propagules are left after the former vegetation has been virtually<br />
destroyed. In such succession most of the plant species are either present from the outset as<br />
buried seeds, bulbs and rhizomes or invade shortly afterwards (Packham & Willis 1997).<br />
4<br />
Of the three major mechanisms of succession outlined by Connell & Slatyer (1977),<br />
none by itself can account for the complete range of floristic replacements found in salt-<br />
marshes.<br />
1.2.1 The facilitation mechanism<br />
In the facilitation mechanism, species replacement is assisted by environmental changes<br />
brought about by organisms in earlier stages in the succession (Packham & Willis 1997). In<br />
this mechanism, the early-succession species modify the environment so that it is more<br />
suitable for late successional species to invade and grow to maturity (Connell & Slatyer<br />
1977). Whittaker (1975) stated that in the facilitation mechanism “one dominant species<br />
modified the soil and microclimate in ways that made the entry of a second species possible,<br />
which then became dominant and modified the environment in ways that suppressed the first<br />
and made the entry of a third dominant possible, which in turn altered its environment.” This<br />
sequence continues until the resident species no longer modifies the site in ways that facilitate<br />
the invasion and growth of a different species (Castellanos et al. 1994; Huckle et al. 2000).<br />
1.2.2 The tolerance mechanism<br />
The tolerance mechanism does not depend on the initial presence of early successional<br />
species. Species, which occupy a site early, have little or no influence on the recruitment of<br />
other species, which grow to maturity despite their presence (Burrows 1990). Any species can<br />
start the succession but those which establish first are replaced by others that are more
tolerant (competitively superior) and usually longer-lived at the habitat. In this mechanism<br />
species that appear later are simply those that arrived either later or at the very beginning, but<br />
germinated and/or grew more slowly. The sequence of species is determined solely by their<br />
life-history characteristics. In contrast to the early species, the propagules of the later ones are<br />
dispersed more slowly and their juveniles grow more slowly to maturity. They are able to<br />
survive and grow despite the presence of early-succession species that are healthy and<br />
undamaged (MacArthur & Connell 1966; Farrell 1991).<br />
1.2.3 The inhibition mechanism<br />
In contrast to the first mechanism, in inhibition mechanism, once earlier colonists<br />
colonize a habitat, they secure the space and/or other resources, and subsequently inhibit the<br />
invasion of new colonists or suppress the growth of those already present. The latter invade or<br />
grow only when the dominating residents are damaged or killed, thus releasing resources<br />
(Connel & Slatyer 1977). In this mechanism, invasion is prevented by the present occupants<br />
of the site, perhaps through heavy shading or allelopathic mechanisms; replacement will<br />
occur only when previous colonists are removed. The species, which colonize the site first,<br />
thus gain a major advantage (Packham & Willis 1997).<br />
In salt-marsh conditions, it is generally expected that vegetation changes in time are<br />
driven by the facilitation mechanism. Soil trapped by early colonizers, that themselves are<br />
able to endure the harsh pioneer stage environmental conditions, elevates the substrate, thus<br />
facilitating the colonization by mid- and late-successional species, which were not able to<br />
endure the early succession conditions of daily inundation with salt water. Beeftink (1965)<br />
and Hoffmann (1993) stated that Salicornia spp. or Spartina townsendii-dominant<br />
communities would eventually change to Elymus athericus (on levees) or Halimione<br />
portulacoides-dominant (on backlands) communities through the facilitation mechanism by<br />
sedimentation (Fig. 1.1). However, inhibition mechanism through spatial competition could<br />
5
also occur in salt-marsh habitat, as it has been reported by a few authors for Spartina (e.g.<br />
Packham & Willis 1997).<br />
Fig. 1.1. Vegetation succession illustrated with the dominant plant species in consecutive vegetations<br />
in backland and levee in SW- Netherlands (reconstructed from Beeftink 1965; Hoffmann 1993);<br />
grazing is believed to set back succession to vegetations dominated by low-sward grasses,<br />
predominantly Puccinellia maritima.<br />
1.3 What is known about salt-marsh succession<br />
6<br />
On levee<br />
Sandy environment<br />
Salicornia spp.<br />
Spartina townsendii<br />
On backland<br />
Silty environment<br />
Suaeda<br />
maritima<br />
Puccinellia<br />
maritima<br />
Halimione<br />
portulacoides<br />
Halimione<br />
portulacoides<br />
Elymus<br />
athericus<br />
Halimione<br />
portulacoides +<br />
Artemisia sp.<br />
Vegetation succession in salt-marshes in Europe was described by Beeftink (1962;<br />
1965; 1966; 1977). He distinguished two kinds of vegetation succession in European salt-<br />
marsh: progressive and retrogressive. Changes in the vegetation which involve an increasing<br />
number of species and an increasing complexity of structure are considered to be progressive<br />
succession e.g. the sere Puccinellietum maritimae, Juncetum gerardii, Agropyro-Rumicion<br />
crispi. The sere in the opposite direction is called retrogressive succession. He stated that the<br />
causes of retrogressive succession can be both natural (e.g. erosion and grazing) and man-<br />
made (e.g. grazing and mowing). After Beeftink’s thorough studies of salt-marshes in the<br />
south-western part of the Netherlands (Beeftink 1965; 1966), the effects of biotic and abiotic<br />
factors on vegetation succession in salt-marsh habitats were further investigated, e.g. tidal
inundation (Egan & Ungar 2000; Wolters et al. 2005), grazing (Bakker & Ruyter 1981;<br />
Pehrsson 1988; van Wijnen et al. 1997; Schroder et al. 2002; Kleyer et al. 2003; Kiehl et al.<br />
2007) and soil factors (Tessier et al. 2000; Schroder et al. 2002; Tessier et al. 2003) (see<br />
details of these and other studies in the introduction of each of the following chapters). Very<br />
generally speaking, the results of these diverse studies showed that the impact of biotic and<br />
abiotic factors on vegetation succession often depends on the study area where the<br />
observations were made. Hence, general conclusions on succession determining process are<br />
difficult to make.<br />
1.3.1 Which species are able to be the first colonizers in a salt-marsh?<br />
The variables that control plant species co-occurrence (Gotelli & McCabe 2002) and<br />
primary succession (Kalliola et al. 1991; Walker et al. 2006; Shiels et al. 2008) are manifold<br />
and interactive (van der Valk 1992; Wiegleb & Felinks 2001).<br />
Initial substrates are colonized by a species through recruitment from viable seeds. Seed<br />
can be available by seed dispersal or from seed buried in the soil (Rand 2001). Seed (or<br />
diaspores in general) availability is only the first step needed to establish a population on a<br />
new substrate; seed availability alone only makes a species a member of the potential flora of<br />
the new site, not necessarily of its actual flora (Major & Pyott 1966). The probability of<br />
successful establishment from dispersed seed depends on several factors, i.e. seed production,<br />
seed dispersion and seed germination (van der Valk 1992). Unfortunately, these factors have<br />
never been examined together in detail in any single study. Many secondary factors affect<br />
each of these processes. For instance, seed production (the number of seeds produced by a<br />
plant or a population during a given growing season or year) depends on such factors as the<br />
age or size of the plant, the abundance of the population in the community or at a higher scale,<br />
environmental conditions during the previous and current growing season, availability of<br />
pollinators, predispersal predation and energetic trade-off between vegetative propagation and<br />
7
seed production (Willson 1983; Price & Jenkins 1986; Zammit & Westoby 1988; Howe &<br />
Westly 1988; Louda 1989).<br />
8<br />
Seed dispersal depends on the vector of seed transport (van der Valk 1992) and the<br />
ability of seeds for dispersion (Adam 1990). In coastal marshes, dispersal of seeds by tidal<br />
currents is suggested as the main pathway, as most seeds are able to float in the water column<br />
(Koutstaal et al. 1987; Huiskes et al. 1995). The ability of seeds for dispersal by tidal currents<br />
is affected by seed mass and seed shape (length and width) (Poschlod et al. 2005).<br />
Only part of the colonization process has been completed when seeds are produced,<br />
transported and have reached a site: they must still germinate. Seed germination is a complex<br />
physiological process influenced by many environmental conditions (Mayer & Poljakoff-<br />
Mayber 1982). In salt-marshes, seed germination can be affected by soil salinity, moisture and<br />
nutrition level (Woodell 1985; Shumway & Bertness 1992; Noe & Zedler 2000).<br />
In general, a species can be an early successful colonizer if its parents produce sufficient<br />
seeds at local or regional scale, disperse to new areas very well and germinate successfully.<br />
Fig. 1.2 shows the conceptual framework for exploring constraints in the colonization of salt-<br />
marsh species. At the first step, total seed production can be affected by the abundance of<br />
adults in the old salt-marsh. In chapter 2, the relationship between the frequency of species in<br />
newly created salt-marsh and its adjacent old salt-marsh (functioning as a seed source) will be<br />
examined. It is hypothesized that a species occurring in high abundance in the adjacent old<br />
salt-marsh (the local seed source) has a higher chance of becoming an initial colonizer in the<br />
newly created salt-marsh. In addition, some seed traits (seed shape and mass) which could<br />
affect seed dispersal will be investigated for the new colonizers. Although several studies<br />
dealt with mechanisms of succession in salt-marsh habitat, there are few studies on the<br />
species traits which help species to be initial colonizers. The hypothesis is that initial
colonizers have shorter and lighter seeds than later colonizers. Moreover, it is hypothesised<br />
that initial colonizers are more salt and poor-nutrient tolerant than later colonizers.<br />
Seed mass<br />
Seed length<br />
Seed width<br />
Soil salinity<br />
Soil nutrition<br />
Soil moisture<br />
Regional and local<br />
species pool (seed<br />
sources)<br />
Safe site<br />
Germination<br />
Colonization<br />
Viable seed<br />
production<br />
Seed dispersal<br />
Restoration site<br />
Unsuitable condition<br />
Seed bank<br />
Fig. 1.2. Framework for exploring constraints in the initial colonization of salt-marsh species<br />
9
1.3.2 Inundation, vegetation and succession<br />
Once species have colonized a new substrate, the growing and replacement of different<br />
species can be influenced by biotic and abiotic factors (e.g. Bernhardt & Koch 2003). In salt-<br />
marsh habitat, inundation frequency is one of the most important abiotic factors. Inundation<br />
by the tide affects halophytes largely through changes in oxygen availability (or soil aeration)<br />
and soil chemistry (Silvestri & Marani 2004). Additionally, tidal currents may have<br />
mechanical effects on plants, particularly in the lower part of salt-marshes and affect the<br />
growth rate and survival. As the presence of thick cuticles in most salt-marsh species is likely<br />
to prevent direct entry of salt into the plant, the immediate effect on halophyte physiology<br />
could be the flooding of soil pores affecting the availability of oxygen for aerobic root<br />
processes and producing reduced toxic ions (Packham & Willis 1997). The physiology of<br />
water-logging tolerance has been quite widely studied in plant species in salt-marshes (e.g.<br />
Anderson 1974; Cooper 1982 ; Armstrong et al. 1985; Naidoo et al. 1992; Varty & Zedler<br />
2008) and different strategies were reported for salt-marsh plants to adopt and survive in<br />
periodic soil saturation (Visser et al. 2000). Given the complexity and the variability in the<br />
combination of strategies to cope with anaerobic conditions, the effects of tidal flooding on<br />
germination and respiration are also species-dependent. Cooper (1982) found that species<br />
such as Plantago maritima, Puccinellia maritima and Salicornia europaea were particularly<br />
tolerant to water-logging, whereas species generally found higher on the marsh, including<br />
Festuca rubra, Juncus gerardii and Armeria maritima, were less so. As a result, the survival<br />
and stability of different species might be different in relation to inundation frequency; the<br />
rate of species replacement is influenced by inundation frequency.<br />
Classical concepts of succession emphasize the role of organisms in modifying the<br />
environment; the operation of such autogenic factor leads to the gradual development and<br />
replacement of plant species and communities (Clements 1916), which is considered to
exhibit increased species diversity, yield and amounts of organic matter with time (Odum<br />
1969). Succession processes such as “facilitation” and “inhibition” are associated with it<br />
(Connel & Slatyer 1977). Such features (autogenic plant succession) are indeed likely to<br />
predominate at higher elevations, where tidal influence is reduced. Lower elevations,<br />
however, experience frequent tidal inundation, associated with more complete litter removal<br />
and greater likelihood of inorganic sedimentation. This enhancement of the allogenic<br />
(environmental) influence leads to replacement of species by the tides, as for instance Eilers<br />
(1979) found in the lower salt-marshes. Consequently, inundation could influence not only the<br />
germination and growth of species but also the stability and dynamics of different species and<br />
communities. Previous studies have shown that the speed of vegetation succession in salt-<br />
marshes depends on drainage conditions and on sedimentation rates in relation to sea level<br />
rise (Leendertse et al. 1997; Olff et al. 1997; Schröder et al. 2002). Nevertheless, there is a<br />
lack of studies on vegetation replacement and succession related to inundation frequency. The<br />
effect of inundation frequency on vegetation succession (species turnover) will be studied in<br />
chapter 3. We hypothesize there that the rate of species succession and turnover at higher<br />
inundation frequencies is lower.<br />
1.3.3 Grazing and succession<br />
Grazing is one of the most important biotic disturbance factors, affecting the growth rate<br />
of species and the rate of replacement. In terrestrial habitats, animal grazing has been reported<br />
to be an important succession factor (Olff et al. 1999) and nature management tool for poor<br />
and low-productivity habitats (Provoost et al. 2002; Stroh et al. 2002; Hellström et al. 2003).<br />
Moderate grazing was beneficial to annual species, whereas ungrazed grassland was<br />
dominated by tall perennial grasses (Noy-Meir et al. 1989). Species richness increased with<br />
increasing grazing pressure, but decreased sharply when the grazing pressure was severe<br />
(Taddese et al. 2002). Although, grazing increased the number of rare species, it negatively<br />
11
affected plant species richness in acidic, extremely nutrient poor coastal grasslands, while<br />
species richness was positively affected in more basic, nutrient richer coastal dune grasslands<br />
(Tahmasebi Kohyani et al. 2008). As a result, the effects of livestock on the environment are<br />
numerous and depend on the habitat, grazing intensity and herbivore species (see also Gough<br />
& Grace 1998). Probably the most obvious and most important grazing effect is the selective<br />
phytomass extraction by herbivores. Some plant species or certain plant functional types were<br />
preserved during the course of succession; others were discriminated against by a grazing<br />
impact, depending on the preferences of the livestock species (Hülber et al. 2005).<br />
Additionally, grazing animals influenced their environment when they created gaps by<br />
trampling, scratching or rolling (Lamoot et al. 2004). These micro sites were extremely<br />
important for mid-successional stages, because they represented spots where retrogressive<br />
succession and a regeneration of niches for low-competitive plant species (Bakker et al. 2003)<br />
occur. As a result, it can be expected that during succession some species disappear or<br />
decrease in abundance and some new species appear or increase in abundance by grazing.<br />
12<br />
For the management of dry and nutrient-poor sandy ecosystems, mainly sheep grazing<br />
is used as a measure of nature management. The effectiveness of sheep grazing as a tool for<br />
protection and restoration has been proven in various studies (Stroh et al. 2002; Hellström et<br />
al. 2003). There are, however, few studies that investigated the mechanism of plant succession<br />
induced by sheep grazing in salt-marsh habitat (but see, e.g. Jensen 1985); most researches<br />
have been done about the effect of cattle grazing. Effects of five years of cattle grazing on a<br />
salt-marsh vegetation were investigated by Bakker & Ruyter (1981). They demonstrated that<br />
the ungrazed area showed a progressive succession while in some parts of the grazed area<br />
retrogressive succession took place, i.e. the vegetation became more open and diversity<br />
increased by grazing. Intensive grazing of salt-marshes by cattle can lead to a downward shift<br />
of vegetation zones (Bakker 1989) towards a pioneer succession stage and to a loss of
grazing-sensitive species, because only a few plant species (e.g. Salicornia spp. and<br />
Puccinellia maritima) tolerate frequent biomass loss and trampling (Kiehl et al. 1996). Gibson<br />
& Brown (1992) showed that the impact of herbivores is considered to induce regressional<br />
trends against successional development.<br />
Short-term investigations showed that plant species density was lowest in intensively<br />
grazed low salt-marshes but did not differ between moderately grazed and ungrazed plots<br />
(Kiehl 1997). A meta-analysis of long-term vegetation changes in the Wadden-Sea salt-<br />
marshes showed, however, that grazing abandonment would have a negative effect on species<br />
density due to the increasing dominance of competitive plant species such as Elymus spp. in<br />
the high marsh (levees) or Halimione portulacoides in the low marsh (backland) (Bos et al.<br />
2002). In contrast, some examples from long-term grazed salt-marshes indicate that species-<br />
rich vegetation mosaics can also persist over long periods (Kiehl et al. 2000). This was<br />
already proven for the study area (see Fig. 1.5) in 1904, when Massart (1908) described the<br />
species rich vegetation of the salt-marsh (salt-marsh with Salicornia europaea, Suaeda<br />
maritima, Glaux maritima, Puccinellia maritima, Armeria maritima and other salt-marsh<br />
species), that was grazed by cattle, horses and hinnies.<br />
Particularly strong competitive species such as Elymus athericus tend to increase their<br />
dominance during progressive succession, resulting in a strong decrease in species diversity in<br />
late successional stages. But there is no study of the effect of sheep grazing on this species.<br />
Whether sheep grazing can reduce the expansion of Elymus athericus is a question which has<br />
not been answered so far.<br />
In addition, studies on the effects of livestock grazing on forage quality can be<br />
important in salt-marsh habitat since forage quality is relevant in the attraction of other<br />
herbivorous animals such as geese (Hupp et al. 1996). Studies on the effect of sheep grazing<br />
on forage quality in salt-marsh habitat are not reported so far.<br />
13
14<br />
In chapter 4, the effects of sheep grazing on vegetation succession will be analyzed<br />
from 2004 to 2007 after the establishment of exclosures in different plant communities in the<br />
salt-marsh and in the ecotone between salt-marsh and sand dune. We will focus on the<br />
variation in abundance of Elymus athericus with and without sheep grazing. In addition, the<br />
effect of sheep grazing on forage quality parameters of some salt tolerant species will also be<br />
investigated in chapter 4. We hypothesize that grazing by sheep in salt-marsh habitat can be<br />
an adequate management method to avoid ruderalisation of salt-marsh habitat by Elymus<br />
athericus, i.e. to maintain pioneer and species rich saline grasslands through selective grazing<br />
on the more competitive species, such as Elymus athericus. Moreover, it is hypothesized that<br />
sheep grazing has a positive influence on forage quality.<br />
1.3.4 The effect of soil conditions on vegetation in different successional stages<br />
Soil characteristics constrain plant performance and community composition (Grime<br />
2001; Pywell et al. 2003), and attempts to restore plant communities are likely to fail if they<br />
do not consider the limitations imposed by soil conditions (Eviner 2008). Understanding the<br />
effects of soil conditions on above-ground vegetation is critical since it can help to predict<br />
plant responses to soil conditions, determining which species can thrive at a given site and<br />
which will outcompete others (Eviner 2008).<br />
Salt-marshes are habitats with extreme environmental conditions due to regular flooding<br />
by saline water. Gradients of water-logging and salinity from the pioneer zone over the low to<br />
the high marsh induce a distinct vegetation zonation depending on the tolerance ranges of<br />
different plant species (Adam 1990). Soil is the substrate from which the roots of plants<br />
absorb water and mineral salts. Plant community distribution and species composition are<br />
known to be related to specific soil properties such as soil texture, pH, salinity and toxic<br />
influences (e.g. Funk et al. 2004).
The ability of certain plants to survive in particular salt-marsh environments is often<br />
related to water and mineral nutrient availability, soil aeration and oxygen diffusion rates,<br />
redox potential and the presence or absence of toxic ions (Adam 2002). As soil aeration and<br />
oxygen diffusion rates are correlated with soil texture, the distribution, frequency and<br />
abundance of plant species will be strongly affected by soil texture. Another soil factor,<br />
salinity, is one of the most important edaphic factors governing the distribution of salt-marsh<br />
plant species (Packham & Willis 1997). Elevation is also one the most important indirect<br />
abiotic factors, influencing the distribution and occurrence of species in salt-marsh habitat<br />
through other ecological determinants associated with elevation, and hence with inundation<br />
frequency. Indeed, several studies were carried out on the effect of different abiotic factors on<br />
distribution and occurrence of species in salt-marshes (e.g. Huckle et al. 2000). Nevertheless,<br />
vegetation-soil relationships for different successional stages in salt-marshes have not been<br />
addressed so far.<br />
It has been demonstrated that stochastic factors, such as seed availability, are important<br />
in plant distribution and occurrence in early successional stages (Walker et al. 2006), while in<br />
late successional stages, more deterministic factors such as abiotic characteristics play a more<br />
important role in the distribution and occurrence of species (Lepš & Rejmánek 1991). In other<br />
words, early in the succession process, species establishment would be largely stochastic<br />
(Økland 1999; del Moral et al. 2005), and eventually, deterministic processes should produce<br />
predictable relationships between species and their environments (del Moral & Lacher 2005).<br />
Community structure in mature systems is often assumed to result from deterministic links<br />
between plants and their environment (del Moral 1999). Therefore, it is to be expected that<br />
species distribution and occurrence are more predictable by abiotic factors in late successional<br />
stages in comparison to early successional stages. In chapter 5, we hypothesize that the<br />
15
elationship between soil characteristics and vegetation is stronger in late successional than in<br />
early successional stages.<br />
1.3.5 Seed bank and succession<br />
16<br />
Depth distribution of viable seeds is not merely of academic interest (Espinar et al.<br />
2005). Indeed, for some restoration measures the knowledge of the depth distribution of<br />
viable seeds in soil is indispensable, e.g. for topsoil removal, a regularly applied restoration<br />
measure in some habitats (Grootjans et al. 2001), has a significant impact on seed availability.<br />
The soil removal treatment dramatically decreased the availability of seeds in the seed bank in<br />
dune slacks (Grootjans et al. 2001), flood meadows (Holzel & Otte 2003) and fen meadows<br />
(Ramseier 2000), indicating that soil seed bank density and composition decline<br />
monotonically with soil depth. Some studies conversely stated that viable seed density in<br />
deeper layers is higher than in shallow layers or that the distribution of seeds along depth is<br />
binomial (Espinar et al. 2005). Depth distribution is often a reasonably good indicator of seed<br />
longevity (Thompson et al. 1997; Bekker et al. 1998).<br />
Salt-marshes can differ in salt concentration (Adam 1990). Several studies have proven<br />
that salinity can delay or hamper the germination (Rubio-Casal et al. 2003). As a result, in<br />
higher salinity conditions it can be expected that a relatively higher number of seeds may<br />
penetrate to the soil compared with less saline conditions. In chapter 6, we will compare the<br />
depth distribution of seeds in two salt-marshes differing in salt concentration (euhaline and<br />
mesohaline).<br />
Seed bank and above-ground vegetation can have a mutual interaction. This interaction<br />
can be influenced by age (Wolters et al. 2002), as the above-ground vegetation changes<br />
during succession. In terrestrial habitats, several studies reported on the vertical and<br />
horizontal distribution of seeds in soil with respect to age (e.g. Bossuyt & Hermy 2003), while<br />
knowledge is scant for salt-marsh habitats (but see Wolters & Bakker 2002). Early
successional species tend to form persistent seed banks and late successional species tend to<br />
show a more transient seed bank (Bossuyt & Hermy, 2004). Therefore it can be expected that<br />
seed density and similarity between seed bank and above ground vegetation decrease along<br />
time. Seed bank density and similarity with above-ground vegetation will be compared for<br />
early and late successional stages in chapter 6. It is hypothesized that the vertical distribution<br />
of seeds is different for euhaline and mesohaline salt-marshes. In addition, it is further<br />
hypothesized that seed density and similarity between seed bank and above-ground vegetation<br />
in old salt-marsh is lower than in new salt-marsh.<br />
1.4 The reasons why to study succession in a restoration program<br />
Successional vegetation processes are an important aspect in ecological restoration,<br />
because they determine the type and timing of restoration measures used and affect the final<br />
success. Therefore, vegetation succession and its study should be taken into account in<br />
virtually any restoration program. On the other hand, results of both spontaneous processes<br />
and restoration measures are usually intermingled and influence each other (Luken 1990). In<br />
some restoration programs, we can completely rely on spontaneous succession (Prach et al.<br />
2001). Spontaneous succession is affected by many local biotic and abiotic factors and their<br />
interactions and, hence, will be different in different places. It is not possible to extrapolate<br />
the results of a study in a particular location to other locations (Eviner & Hawkes 2008).<br />
Many restoration failures can be attributed to site-specific issues that were not taken into<br />
account (Wassenaar et al. 2007), indicating the importance of studies on natural plant<br />
succession in each site separately.<br />
Beside the importance of vegetation succession studies in restoration programs, newly<br />
(by man or naturally) created substrates offer us unique opportunities to study plant<br />
succession fundamentally, in which salt-marshes are a remarkable habitat. Salt-marsh<br />
communities normally arise on bare substrate and when mature are often eroded, creating bare<br />
17
areas which are re-colonized. They are thus very suitable habitats to study processes of<br />
vegetation change (Packham & Willis 1997). Previous studies showed that the kind of pioneer<br />
species, the way of succession and the speed of species turnover are different in different salt-<br />
marshes. For instance, Wolters et al. (2008) showed that annual species were the new<br />
colonizers in salt-marshes in the north of the Netherlands and perennial species only started to<br />
colonize or increase notably in abundance after a relative long time after restoration. In<br />
contrast, Odland & del Moral (2002) demonstrated that in wetland conditions perennial herbs<br />
soon invaded and came to dominance, although annuals together with acrocarpous mosses<br />
were the first colonizers in this case also. Sometimes vegetation changed and replaced quickly<br />
and in other cases vegetation was stable for several years. Therefore, plant succession will be<br />
unique in each (salt-marsh) habitat, indicating again the necessity to study plant succession in<br />
each salt-marsh separately.<br />
1.5 Material and methods<br />
1.5.1 The recently history of the study area<br />
The study area is part of the Flemish Nature Reserve the IJzermonding and is located along<br />
the right hand bank of the IJzermonding in the city of Nieuwpoort (Prov. West-Flanders),<br />
Belgium (Fig. 1.3). It consists of two parts: an old, more or less untouched salt-marsh and a<br />
recently created intertidal area, where a new salt-marsh came to development (Fig. 1.4). The<br />
IJzermonding salt-marshes are one of the only four daily-inundated salt-marsh areas in<br />
Belgium. The other three are the Baai van Heist, the Zwin with true salt-marshes and the<br />
Scheldt estuary with brackish salt-marshes. The history of the old salt-marsh area during the<br />
last century is one of constant deterioration and regression, caused by many kinds of<br />
destruction.<br />
18
● ○<br />
Fig. 1.3. The position of the study area (the asterisk). The study area is located in the city of<br />
Nieuwpoort, Belgium. Two other study areas are used in this <strong>PhD</strong> to study seed bank characteristics<br />
(chapter 6): the Zwin area is located at the filled circle, the Verdronken Land van Saeftinghe is located<br />
at the open circle<br />
19
Fig. 1.4. The position of the newly (2002) created salt-marsh (N) and the old salt-marsh (O1 and O2)<br />
in the Flemish Nature Reserve “De IJzermonding” at Nieuwpoort.<br />
20
A<br />
B<br />
Fig. 1.5. Photos taken by Massart in 1904 (Massart 1908). (A) The surprisingly narrow ecotone<br />
between salt-marsh (left) and coastal dune (right) with floodmark conditions in between in the former<br />
IJzer estuary, before this area was raised with slurry and sand in the mid-20 th century; the picture was<br />
taken in northern direction, in between the middle part of transect 3 and 4 (Fig. 1.6) in the present<br />
study; the vegetation was described as follows: “left of a central floodmark, a salt-marsh vegetation,<br />
grazed by cows, horses and hinnies (both latter not in the picture), appears with Salicornia europaea,<br />
Suaeda maritima, Glaux maritima, Puccinellia maritima, Armeria maritima and other salt-marsh<br />
species, right of the floodmark a classical dune grassland appears, with species like Festuca rubra,<br />
Agrostis sp., mosses and lichens (descriptions, translated from Vanhecke et al. 1981). (B) Creek of<br />
Lombartsyde in the IJzer estuary at low tide with a non-grazed vegetation of Puccinellia maritima,<br />
Aster tripolium, Triglochin maritimum, Plantago maritima, Halimione portulacoides, Suaeda<br />
maritima and other salt-marsh species; the picture was taken in a western direction (descriptions,<br />
translated from Vanhecke et al. 1981).<br />
21
22<br />
There are some photos available dating from the turn of the last century (Massart 1908)<br />
from the old salt-marshes (e.g. Fig. 1.5). A comparison of the vegetation between Massarts’s<br />
photos and vegetation in 1974 by Goetghebeur (1976) showed that the surface of salt-marsh<br />
vegetation steadily diminished in time. There were 60-70ha of salt-marsh vegetation in 1913,<br />
while it decreased to less than 5ha in 1974. On the other hand, some species were always<br />
reported as occurring in high abundance, e.g. Aster tripolium in the higher parts. Spartina<br />
townsendii was only present from the mid-20 th century onwards; it was not yet described by<br />
Hocquette (1927) and Isaäcson & Magnel (1929), while Duvigneaud & Lambinon 1963<br />
described it for the first time from the area in 1963. Some species were reported as being rare<br />
and only present in small spots, e.g. Armeria maritima. Several species have disappeared<br />
since 1913; the vegetation has totally changed (Goetghebeur 1976). From 1976 onwards, the<br />
vegetation was further disturbed by military, agricultural and fishery activities.<br />
The new intertidal area was created between 1999 and 2002 within the framework of a<br />
large-scale LIFE restoration project. General aim of the initiative was to restore or create<br />
beach-salt-marsh-dune ecotones with gradual salt-fresh, dynamic-stable, wet-dry and mud-<br />
sand gradients. In order to reach this goal, several large buildings and roads were broken<br />
down, an entire tidal dock was restructured and some 500,000m³ of dredging material was<br />
removed to restore or create intertidal and coastal dune habitats and their intermediate<br />
ecotones.<br />
It was decided to monitor changes from the very start of the restoration process in both<br />
habitats giving the opportunity to study vascular plant succession in old and new salt-marshes.<br />
Investigations were multidisciplinary and were realized in a partnership between several<br />
scientific institutes: <strong>Ghent</strong> University, Catholic University of Louvain, Royal Belgian Institute<br />
of Natural Science and the Institute of Nature Conservation with facility support of VLIZ<br />
(Hoffmann 2006a). Studies included the most relevant abiotic conditions, such as
sedimentation and erosion, topography and ground water fluctuations, biotic conditions,<br />
particularly available seed bank and biological response variables, i.e. flora and vegetation,<br />
benthic macrofauna, terrestrial arthropods and birds. To study vegetation succession, data<br />
Fig. 1.6. The positioning of the quadrates in the old and new salt-marshes. Black circles show the<br />
quadrates which were sampled in 2003; white and red circles show the poles located along transects<br />
with 50m distance between each other, white poles are located in the old salt-marsh and red poles are<br />
located in the newly created salt-marsh or on the mud flats, which have no macrophytic vegetation.<br />
The aerial photo has been taken at low tide on the 28 th July, 2002, after the majority of restoration<br />
works were realised in early spring of 2002; in the summer of 2002 the first colonizers (Salicornia<br />
spp., Suaeda maritima and others) were already observed in the newly created intertidal area. The<br />
numbers show different transects.<br />
23
were collected systematically along transects perpendicular to the most important gradients in<br />
both habitats, new and old salt-marshes. Vegetation changes were followed through yearly<br />
sampling of permanent plots in the growing season. Dune vegetation was sampled in July and<br />
August; salt-marsh vegetation was sampled in late August and September. Dune data are not<br />
considered in this study, since we here focus on succession processes in estuarine intertidal<br />
conditions. Within this intertidal part of the nature reserve, 90 permanent plots were laid out<br />
in 4 transects in 2001; in 2002 the number of plots was 94 and the number of transects was 4.<br />
In 2003, the number of intertidal plots was raised to 279 and the number of transects to 11,<br />
while in 2005 and 2007, the number of intertidal sampled plots was 214 and 267, respectively<br />
and the number of transects was 11 (Fig. 1.6). Evaluation of early successional trends was<br />
done after the last sampling in the summer of 2007 of some biotic and abiotic factors relevant<br />
for this study, i.e. inundation frequency and sheep grazing.<br />
1.5.2 Materials<br />
Not all vegetation or seed bank sample plots were used in all chapters. Selection of plots<br />
depended on the environmental or biological data available for every plot, or from the specific<br />
questions raised per chapter.<br />
In chapter 2, we used plots that were sampled in 2003, 2005 and 2007. The number of plots is<br />
therefore restricted to those that were sampled in all three study periods. This means that 175<br />
plots were used from the newly created salt-marsh and 66 plots from the old salt-marsh. Plot<br />
positions are visualized in Appendix A. Additionally, in 2008 vegetation was sampled in 30<br />
quadrates to estimate seed production (these plots are not indicated on the map in Appendix<br />
A); these 30 quadrates were concentrated in three different subsites (10 quadrates each) and<br />
were situated within the old salt-marsh (reference site). Seed bank data used in chapter 2 are<br />
collected from the same plots as were used in chapter 6 from the newly created salt-marsh; the<br />
position of these seed bank plots are visualized in Appendix E.1.<br />
24
In chapter 3, all plots of which inundation frequency data were available and vegetation data<br />
were sampled in 2003, 2005 as well as 2007 were included; this concerns a total of 119 plots,<br />
all situated in the newly created salt-marsh area (Appendix B).<br />
In chapter 4, data collected in five exclosure and five neighbouring enclosures in 2005 and<br />
2007 were used (Appendix C). Each exclosure and each enclosure consisted of 5 permanent<br />
plots, leading to a total of 40 subplots, in which vegetation composition, plant species cover,<br />
and plant species forage quality determinants were measured (for further explanation, we refer<br />
to the method-part of chapter 4).<br />
In chapter 5, we used 155 plots that were sampled in 2005, of which soil factors and elevation<br />
were measured. Of these, 95 were situated in the newly created salt-marsh and 60 in the<br />
adjacent old salt-marsh (Appendix D).<br />
Finally, in chapter 6, vegetation and soil seed bank were measured in 90 plots; they were<br />
sampled in 2006. These plots are located in four salt-marsh entities, i.e. IJzer estuary-old<br />
marsh, IJzer estuary-new marsh, Zwin and Saeftinghe (see Appendix E.1, E.2 and E.3).<br />
Table 1.1 shows the material (mostly vegetation) and methods (mostly permanent plots) used<br />
in each chapter, separately.<br />
25
Table 1.1. Materials and methods used in different chapters. The size of plots was 2m × 2m and<br />
quadrates was 50cm × 50cm.<br />
Parameters<br />
Number<br />
Chapter to be<br />
Location<br />
Year Method (plots or<br />
estimated<br />
quadrates)<br />
Vegetation<br />
data<br />
Newly created and old (reference) saltmarshes<br />
(IJzermonding)<br />
2003, 2005<br />
and 2007<br />
Permanent<br />
plots 175+66<br />
2 Seed<br />
Old (reference) salt-marsh<br />
2008 Quadrates<br />
production<br />
(IJzermonding)<br />
3×10<br />
Seed bank Newly created salt-marsh (IJzermonding) 2007 Soil cores 10<br />
Vegetation Newly created salt-marsh (IJzermonding) 2003, 2005 Permanent<br />
3 data<br />
and 2007 plots 119<br />
Inundation Newly created salt-marsh (IJzermonding)<br />
Tide and plot<br />
frequency<br />
2003 level 119<br />
Vegetation Newly created salt-marsh (IJzermonding) 2005 and Permanent<br />
4 data<br />
2007 plots 4×5×2<br />
Forage quality Newly created salt-marsh (IJzermonding) 2006 and Quadrate<br />
2007<br />
1516<br />
Vegetation Newly created and old (reference) salt- 2005 Permanent<br />
data<br />
marshes (IJzermonding)<br />
plots 95+60<br />
5 Soil factors Newly created and old (reference) salt- 2005 Soil cores<br />
marshes (IJzermonding)<br />
95+60<br />
Elevation Newly created and old (reference) salt- 2005 Plot level<br />
marshes (IJzermonding)<br />
95+60<br />
Vegetation (IJzermonding-new, IJzermonding-old, 2007 Temporary 10+16+<br />
6 data Zwin, Saeftinghe, respectively)<br />
plots 14+50<br />
Soil seed bank (IJzermonding-new, IJzermonding-old, 2007 Soil cores 10+16+<br />
Zwin, Saeftinghe, respectively)<br />
14+50<br />
1.6 The restoration interest of salt-marshes<br />
26<br />
Coastal salt-marshes are defined as areas, vegetated by herbs, grasses or low shrubs,<br />
bordering saline water bodies. They are subject to periodic flooding as a result of fluctuating<br />
water levels of the adjacent saline water bodies (Adam 1990). Salt-marshes are restricted to a<br />
narrow zone between land and sea, many salt-marsh plant species and their associated plant<br />
communities are considered rare (Doody et al. 1993) or vulnerable to extinction (Westhoff et<br />
al. 1993).<br />
Salt-marshes are considered particularly important for migratory birds and waterfowl<br />
(see e.g. Rowcliffe et al. 1995; Zedler & Callaway 1999; van der Wal et al. 2000; Dierschke<br />
& Bairlein 2004). This importance is reflected in the national and international policies on the<br />
conservation and restoration of salt-marshes (Doody et al. 1993; Janssen & Schaminée 2003;<br />
Ozinga & Schaminée 2005). Apart from their nature conservation interest, salt-marshes are
important as a natural flood control, dissipating wave energy (Möller et al. 1999). It has been<br />
estimated that with a 6m wide salt-marsh in front, a 6m high seawall would be sufficient to<br />
protect the hinterland, whereas in the absence of a salt-marsh the seawall should be 12m high<br />
(King & Lester 1995). As building and maintaining seawalls is expensive there are obviously<br />
great economic advantages in having a salt-marsh in front of coastal embankments (Wolters et<br />
al. 2005).<br />
Recently, large losses of salt-marsh area have been reported globally (Dijkema 1987;<br />
Cox et al. 2003). These losses have been attributed to several factors associated with human<br />
development and climate change, dredging, coastal squeeze, land claim for farming or<br />
building, pollution from land or sea (Allen 2000, Goodwin et al. 2001; Adam 2002, Doody<br />
2004). Consequently, in an attempt to restore the former salt-marsh area and to promote salt-<br />
marsh development, to enlarge salt-marsh-dune ecotones, a restoration project was started<br />
along the right bank of the IJzer estuary. The main goal of the nature restoration project was<br />
to enlarge the intertidal salt-marsh and mud flat area, creating an ecotone between river and<br />
land, since ecotones are potentially important hot spots of biodiversity, both at large scale<br />
(Smith et al. 2001) at regional and at local scale (van Leeuwen 1966). Restoration measures<br />
were taken in such a way that gradual gradients of inundation were created, along which a<br />
vegetation development from vegetation free sand or mud flat to vegetated salt-marsh habitat<br />
was expected. Salt-marsh vegetation development was assumed to be possible; thanks to the<br />
presence of salt-marsh species in adjacent old salt-marsh, the newly created intertidal area and<br />
the old salt-marsh were only a few meters apart and were hydrologically connected by tidal<br />
inundations.<br />
Although, there is much debate on the question of how to define restoration success and<br />
in many cases there are no clearly defined targets, one of the possibilities for assessing<br />
success is to compare the ecological structure (richness and composition) of a restored site<br />
27
with one or more reference sites (Thom et al. 2002; Edwards & Proffitt 2003). In the present<br />
study, the rate of appearance of salt-marsh species present on the adjacent old salt-marsh<br />
could be used as an evaluation criterion for restoration success.<br />
1.7 Why permanent plots?<br />
28<br />
Permanent plot studies have a long history (Austin 1981) and long-term permanent plots<br />
are important as they can help in separating trends and seasonal fluctuations (Huisman et al.<br />
1993), and are needed to test ecological models that are often based on assumptions and not<br />
derived from solid field studies (Bakker et al. 1996). The study of long-term permanent plots<br />
has made it clear that vegetation development in many ecosystems under restoration was<br />
different from the final state that was anticipated. This may generate new hypotheses (Klotzli<br />
& Grootjans 2001). Furthermore, long-term recordings are needed to validate the effects of<br />
management measures. Even, experimental changes in salt-marsh management (Bos et al.<br />
2002) revealed clear changes after some years, stressing the importance of long-term<br />
monitoring (Bakker 2005).<br />
Permanent plots are useful in studies of climate change (Petriccione 2005), in field<br />
experiments (Brys et al. 2005) and in the restoration projects (Bekker et al. 1996; Kiehl &<br />
Wagner 2006). Measuring sequential percent cover and species composition in permanent<br />
plots allows the trajectory of vegetation change to be quantified by multivariate methods and<br />
similarity measures (del Moral 2007). Bakker et al. (1996) stressed that permanent plot<br />
studies permit both internal and external driving forces to be explored. Such studies can lead<br />
to new hypotheses and offer clues to appropriate experiments to test these hypotheses (Odland<br />
& del Moral 2002).<br />
The size of vegetation relevés may differ according to the structural characteristics of<br />
the vegetation. Dutch ecologists have used permanent plots 2m × 2m in size for decades to
show cyclical and directional vegetation dynamics in salt-marshes (Leendertse et al. 1997;<br />
Smits et al. 2002). Consequently, we also used plots 2m × 2m in our study.<br />
1.8 Objectives and outline of the thesis<br />
Understanding the driving factors of succession is still a matter of great interest in<br />
ecological science, despite countless studies that deal with succession in all kinds of habitats.<br />
One of those habitats is salt-marsh environment in which drivers determine plant species<br />
turnover in time and changes in spatial plant arrangement during the succession process.<br />
General primary succession determinants in naturally developing salt-marshes are relatively<br />
well described, although the vast literature on this matter shows that local plant succession is<br />
unique for each salt-marsh environment, since biotic and abiotic factors always differ among<br />
localities. Additionally, relatively little knowledge is available on the specific drivers in<br />
restoration conditions, which will always differ from natural conditions, in which spontaneous<br />
salt-marsh vegetation would develop. Knowledge of succession patterns and processes in<br />
these restoration conditions is essential though, when one wants to be able to estimate<br />
potential success of restoration initiatives that aim at the creation or restoration of a diverse<br />
salt-marsh environment in general. This thesis uses the restoration initiative taken in 1999-<br />
2004 along the right bank of the IJzer estuary (province of West-Flanders, Belgium) to learn<br />
about the specificity of succession processes at a salt-marsh restoration site.<br />
Primary succession on a newly created salt-marsh starts with colonization of species<br />
from the local and regional species pool from the seed bank or from seed rain. Seed dispersal<br />
from the local species pool is more important than from the regional species pool, since it may<br />
take several years to disperse seeds from the regional species pool to newly created salt-marsh<br />
(Wolters et al. 2008). Nevertheless, species present in the local species pool show different<br />
colonization abilities. In the study area, no seed bank existed because of the huge quantities of<br />
slurry material deposited on the former salt-marshes, removed in 2001. This was proven in a<br />
29
pilot study performed in the area in 2001 (Stichelmans 2002 cit. in Hoffmann & Stichelmans<br />
2006). Nevertheless, the colonization by a few species was enormous and fast, i.e.<br />
immediately after creation of the new intertidal area in 2002. Among the different species<br />
existing in the adjacent area, only few species were able to colonize during the first growing<br />
season, while most species appeared more slowly. More surprisingly is that some species have<br />
not yet appeared in the newly created salt-marsh, five years after its creation. In chapter 2, we<br />
will describe the characteristics of the initial colonizers in the new salt-marsh environment,<br />
which may help a species to be an initial colonizer. Which species trait could be important for<br />
a plant species to appear itself as a new colonizer? The abundance of the first colonizers in the<br />
local salt-marsh, the salt and nutrient limitation tolerance and seed dispersal traits of new<br />
colonizers will be dealt with.<br />
30<br />
Once populations colonize and establish on a new substrate, vegetation succession<br />
starts. Both biotic and abiotic factors could influence vegetation succession (Olff et al. 1997).<br />
The effect of some abiotic factors on plant succession will be investigated in chapter 3, in<br />
which inundation frequency is one of the most important abiotic factors, affecting vegetation<br />
dynamics.<br />
One of the most important biotic factors affecting vegetation succession is grazing. The<br />
new salt-marsh was accessible for sheep from 2004 onwards. The effect of grazing on early<br />
plant succession and succession trajectory was investigated by the establishment of exclosures<br />
and will be described in chapter 4. Particularly, the effect of sheep grazing on the strong<br />
competitor Elymus athericus will be discussed in this chapter, since it has been shown to be a<br />
problematic species for general species richness in European salt-marshes. In addition, it will<br />
be tried to relate the grazing of different plant species (particularly Elymus athericus) to their<br />
forage quality in this chapter.
The relationships between biotic and abiotic factors with vegetation can vary according<br />
to stage of succession (Lepš & Rejmánek 1991). For example, the relationship between<br />
abiotic soil factors and vegetation could be different in different stages of succession. Another<br />
example, the relationship between seed bank (as a biotic factor) with vegetation, could be<br />
different in different successional stages (Milberg 1995). Having an old salt-marsh adjacent to<br />
a newly created salt-marsh gave us an unique opportunity to compare some aspects of<br />
vegetation succession in different stages. The relationship between abiotic factors (soil<br />
factors) with vegetation in both new and old successional stages will be compared in chapter<br />
5.<br />
Temporal and spatial distribution of seeds buried in soil, seed density and similarity<br />
with above-ground vegetation will be compared between new and old salt-marshes in chapter<br />
6.<br />
Fig. 1.7 shows the conceptual framework of the different chapters in this thesis, and<br />
tries to illustrate the connections between the chapters and the relevance of each in explaining<br />
the general questions on succession determinants.<br />
Successful restoration of plant communities depends on the availability of target species, the<br />
ability of the species to reach a target area and the presence of suitable environmental<br />
conditions that allow the species to germinate and establish. Succession starts with<br />
colonization of some species available by seed dispersal from the reference site close to the<br />
restoration site. However the rate of this succession could be impacted by a very strong<br />
abiotic factor, inundation frequency or a biotic factor, sheep grazing. In a given time along<br />
successional stages, the relationship between abiotic factors and vegetation could be different<br />
between early stages and lately stages. In addition, the relationship between seeds buried in<br />
soil and above-ground vegetation could also be different in early and late stages of succession.<br />
31
Fig. 1.7. The conceptual framework for exploring the constraints for early vegetation succession<br />
compared with late vegetation succession.<br />
32<br />
Charter 2<br />
Chapter 3<br />
Chapter 4<br />
Chapter 5<br />
Chapter 6<br />
Site<br />
suitability<br />
Inundation<br />
frequency<br />
Newly created saltmarsh<br />
(Restoration site)<br />
Colonization<br />
Early<br />
primary<br />
succession<br />
Early established<br />
vegetation<br />
Inundation<br />
frequency<br />
Seed<br />
availability<br />
Sheep<br />
grazing<br />
Abiotic soil<br />
factors<br />
Seed bank<br />
Old salt-marsh<br />
(Reference site)<br />
Late<br />
primary<br />
succession<br />
Late established<br />
vegetation
Chapter 2 Factors affecting the success of early salt-marsh<br />
colonizers: seed availability rather than site suitability and<br />
dispersal traits 1<br />
<strong>Erfanzadeh</strong> R., Garbutt A., Pétillon J., Maelfait J.-P. & Hoffmann M.<br />
1 rd<br />
This chapter has been invited for re-submission in Plant <strong>Ecology</strong> on 3 of April <strong>2009</strong>.<br />
Field data were collected by the first author
2.1 Abstract<br />
Restoration of salt-marshes on newly created substrates provides an excellent opportunity to<br />
study plant colonization and its constraints. We evaluated the process of salt-marsh<br />
colonization in early successional stages and investigated how the sequence of species<br />
establishment is related to the abundance of species in neighbouring, long-existing salt-<br />
marshes, site suitability, seed production and dispersal traits of the involved plant species.<br />
Species distribution and colonization data were collected, using vegetation relevés, that were<br />
collected in the restoration site during three consecutive periods in 175 permanent 2m × 2m<br />
plots. The plots were located along eight randomly chosen transects which were established<br />
perpendicular to the shoreline. To describe the only local diaspore source for new salt-marsh<br />
plant species, vegetation data were also collected in the adjacent salt-marsh in 66 permanent<br />
plots in the same time sequence. We used seed length, width and mass as dispersal traits, and<br />
Ellenberg moisture, salinity and nutrient indices as indicators of site suitability. To describe<br />
the importance of seed availability on initial colonization, seed production in the reference<br />
site and seed bank in the restoration site were also investigated.<br />
The results showed that the establishment of salt-marsh species in the restoration site was<br />
good and fast, the cover of new colonizers in the restoration site was unrelated to their cover<br />
in the adjacent salt-marsh. Seed availability appeared to be a more important factor in<br />
explaining the sequence of species establishment than salt and nutrient-limitation tolerance.<br />
The first colonizers are known as massive seed producers, shorter seed length and lower seed<br />
mass, which probably increased buoyancy. Among dispersal and site traits, seed length and<br />
mass, and in a less extent salinity and nutrients, indicated a relationship with new colonizers.<br />
Despite few species have not appeared in vegetation and seed bank in the restoration site yet,<br />
the existence of an old salt-marsh adjacent to the restoration site is shown to be vital for fast<br />
colonization of newly created intertidal areas.<br />
34
Key words: Site suitability, Seed dispersal traits, Seed availability, New colonizers.<br />
Nomenclature: Lambinon et al. (1998).<br />
35
2.2 Introduction<br />
The successful restoration of plant communities depends on the availability of diaspores of<br />
the target species and favourable abiotic conditions for seedling establishment and growth<br />
(Bakker et al. 1996). Of all species included in local and regional floras, only some take an<br />
important part in early primary succession; such species must be capable of colonizing and<br />
reaching a large cover in the restoration site (Prach & Pysek 1999). Succession at a new site<br />
by colonization of plant species from higher spatial scales is controlled by local and regional<br />
variables (Caley & Schluter 1997; Hillebrand & Bleckner 2002; Kirmer et al. 2008). Both<br />
plant species richness and composition depend on the presence of suitable abiotic conditions<br />
(Grubb 1977; Urbanska 1997; Peach & Zedler 2006). Site conditions typical of a pioneer<br />
stand (e.g. nutrient deficiency in terrestrial habitats) were proven to be important factors for<br />
the colonization by initial adapted species (Rehounkova & Prach 2006; Kirmer et al. 2008).<br />
Physical factors, e.g. salinity, anoxia, pH or sedimentation, strongly affect the germination<br />
and recruitment of species in salt-marshes, particularly at lower marsh elevations (Gray 1992;<br />
Huckle et al. 2000; Tessier et al. 2000).<br />
36<br />
Population dynamics of plant species at the beginning of primary succession are not<br />
only determined by local niche-based processes, but also by seed dispersal processes (Kirmer<br />
et al. 2008), which are assumed to be particularly important in late successional stages<br />
(Bossuyt & Honnay 2008). Seed availability (limitation) can be a major limiting factor in<br />
ecological restoration projects (Ozinga et al. 2004; Dausse et al. 2008). Target species can<br />
establish through dispersal from source plant communities. The degree of seed limitation is<br />
likely to depend on the abundance of adults in the local and adjacent species pool and specific<br />
dispersal traits of the plant species (Zobel 1997; Ozinga et al. 2005). It is expected that the<br />
plant species that exist in the local and regional areas would have the ability to colonize a<br />
newly available site (Wolters et al. 2005a). Distances to seed sources (Frenzen et al. 1988),
spatial distribution of seed sources (Wood & del Moral 1987), neighbourhood influences<br />
(Ryser 1990) and the movement of seeds from productive areas into the new site (Shmida &<br />
Ellner 1984) are all likely important determinants of the outcome of colonization.<br />
In salt-marsh restoration, the fastest development of vegetation is expected from the<br />
community species pool within a target area, either from established vegetation or the below-<br />
ground seed bank (Wolters et al. 2008). Colonization of plants from the species pool is a two-<br />
step process: seed availability and germination. Seed availability is the first step needed to<br />
establish a population from seed, but does not guarantee seed germination. Seed dispersal<br />
alone, only makes a species a member of the potential flora of the site, not its actual flora<br />
(Major & Pyott 1966). Species abundance in the local species pool was also found to be<br />
important for determining the order of colonization in salt-marshes with late establishers<br />
being less abundant on the adjacent marshes than intermediate colonizers (Wolters et al.<br />
2008). Dispersal ability affects the probability of a plant species to colonize a new substrate<br />
(Wilson & Traveset 2000), initial colonizers having a high dispersal ability compared to<br />
species that would colonize later. The tidal current is the most important agent to disperse<br />
plant seeds in salt-marshes. Although seeds of most salt-marsh species can immerse or float in<br />
seawater (Packham & Willis 1997), buoyancy of seeds and flotation period are different in<br />
various species, which affects the dispersal ability of salt-marsh species (Huiskes et al. 1995).<br />
Several factors affect the buoyancy of seeds, such as seed shape (defined as length/width:<br />
Grime et al. 1988) and seed mass; with increasing seed shape and seed mass, seed buoyancy<br />
is reduced (Poschlod et al. 2005). It is expected that initial colonizers in a salt-marsh have<br />
seeds with a shorter length, wider width and lower seed mass than the species of later<br />
successional stages. In terrestrial habitats, species tend to present heavier seeds in late<br />
successional than in early successional ones (Fenner 1987; Leishman 1999), but few studies<br />
have examined such relationship in salt-marsh habitats. Lastly, seed germination is a complex<br />
37
physiological process depending on many environmental conditions (Mayer & Poljakoff-<br />
Mayber 1982). It can be expected that species with high salinity tolerance germinate and<br />
establish earlier (Wolters et al. 2008). Of all species included in a regional and local flora,<br />
only some take an important part in early primary succession; such species must be capable of<br />
colonizing and reaching a large cover in a restoration site (Prach & Pysek 1999). There are<br />
few studies that have synchronically examined factors affecting mechanisms for distribution<br />
and colonization in a newly created salt-marsh in Europe.<br />
38<br />
The present paper aims to determine the factors affecting both plant colonization and<br />
distribution in a newly created salt-marsh in the IJzer estuary, Belgium, by addressing the<br />
following questions: what seed and plant traits are important in the establishment of primary<br />
colonizers in a salt-marsh restoration scheme, and is colonization limited by seed availability<br />
or by abiotic conditions? We first tested the hypothesis that seed dispersal traits may limit<br />
plant colonization by comparing the seed availability in the reference site and the seed bank in<br />
the restoration site. First year colonizers are hypothesized to show shorter seed length, wider<br />
seed width and lower seed mass than those colonizing in later years. We then tested the<br />
hypothesis that, beside seed availability, the success of restoration can be influenced by plant<br />
traits (as a surrogate of site suitability) by comparing the seed bank and the plant presence and<br />
cover in the restoration site. In particular highly salt and nutrient-limitation tolerant species<br />
are expected to be earlier colonizers than less salt tolerant and less nutrient-limitation tolerant<br />
species.<br />
2.3 Material and Methods<br />
2.3.1 Study area<br />
The study area is situated in the IJzer estuary, part of the IJzermonding nature reserve on the<br />
Belgian North Sea coast. A new salt-marsh (ca. 14ha) was created after the removal of
uildings and slurry material during large nature restoration works in the period 1999-2002.<br />
(Hoffmann 2006). The objective of the restoration project was to restore beach-dune-salt-<br />
marsh ecotones by the dispersal of target species from the local species pool (adjacent salt-<br />
marshes and sand dunes) by natural colonization. In the newly created intertidal area<br />
(hereafter called the restoration site), gradual elevational gradients were created, ensuring<br />
inundation frequency conditions between 100% and 0.01% inundation. The area was exposed<br />
to tidal inundation from the beginning of 2002 onwards. Subsequently, the unique opportunity<br />
was created to study the sequence of species establishment in relation to site suitability, seed<br />
availability, species pools and traits.<br />
From a pilot study of the seed bank of some intertidal mud flats, newly created after<br />
removal of 3 to 4m of slurry material (Stichelmans 2002, cit. in Hoffmann & Stichelmans<br />
2006) at the study site, we could conclude that no relevant salt-marsh species seed bank was<br />
available in the formerly buried, newly exposed mud flat soil. This indicates that the soil of<br />
the rest of the restoration site that was buried for several decades would also be free of salt-<br />
marsh species seeds. Colonization of the site therefore relied entirely on diaspores from<br />
external sources. In salt-marshes, hydrochory has been reported as the preferential mode for<br />
seed dispersal, which is mostly of a local character, even though very few seeds can disperse<br />
over long distances, up to 60km per week (Koutstaal et al. 1987; Huiskes et al. 1995). The<br />
presence of a naturally established salt-marsh in the adjacent IJzer estuary was considered<br />
here as the only local source of diaspores for the restoration site because the most proximate<br />
salt-marsh areas are approximately 50km southwest and 42km northeast of the present study<br />
area.<br />
The old adjacent natural salt-marsh (hereafter called the reference site) consists of two<br />
parts (Fig. 1.4): a large one (O1) at the west and in free tidal current contact with the<br />
restoration site (N), and a smaller (O2) located in the south of the restoration site and<br />
39
separated from it by a dike (with a 7m height), not allowing direct tidal current contact<br />
between both.<br />
2.3.2 Seed production in the reference site<br />
Seeds produced by salt-marsh species were collected from the reference site to estimate seed<br />
production. Three sites were randomly selected, one in the southern part (O2) and two in the<br />
west part (O1). At each site, 10 samples were randomly collected in plots of 50cm × 50cm on<br />
four occasions between the beginning of September and the end of October, 2008. Seeds were<br />
collected before they were completely ripened and naturally dispersed. Each sample contained<br />
all flowering stems for perennials and all entire plants for annuals per quadrates 50cm ×<br />
50cm. The average total seed production was measured in each spike for grasses and each<br />
flower (or capitule) for flowering species. After the number of spikes and flowers was<br />
counted, we counted the number of seeds for one unit randomly chosen for each quadrate.<br />
Mean seed production by unit was estimated by using the average seed production across<br />
quadrates where the plant was present. Finally, the total seed production was calculated for<br />
the entire reference site by multiplying the number of seeds per unit, the number of units per<br />
quadrate and the total area of the site divided by the surface of the quadrate.<br />
2.3.3 Seed bank in the restoration site<br />
The seed bank of the restoration site was collected in 10 randomly chosen 2m × 2m plots in<br />
close proximity of permanent plots and across the restoration site. The seed bank data were<br />
sampled in 2006, four years after the site was first exposed to tidal inundation. In each plot,<br />
with an auger with a diameter of 3cm, an average of 25 soil cores were randomly collected, to<br />
a depth of 15cm, ensuring taking samples of all newly accreted marine sediments. The<br />
samples were collected in March after natural stratification during winter. The big parts of<br />
litter layer were removed in the field and samples transferred to the laboratory. The<br />
40
methodology of ter Heerdt et al. (1996) was used to concentrate the soil seed bank samples,<br />
which were washed through a coarse (2mm mesh width) and a fine (0.18mm mesh width)<br />
sieve, removing all roots and coarse vegetative parts on the first sieve, and withholding the<br />
vast majority of seeds on the second, while most of the soil material flushed away through the<br />
latter sieve. The concentrated samples were spread in a thin layer (maximum 0.4cm thick) in<br />
40cm × 40 cm trays filled with sterilized potting soil. The trays were placed in a greenhouse<br />
in a random order with a natural light regime and were kept moist by regular rain water<br />
spraying. Air temperature varied between 14°C and 25°C throughout the experiment. 24<br />
control trays, filled with the same sterilized potting soil, were randomly placed among the<br />
seed bank trays in order to test for possible greenhouse and potting soil seed contamination.<br />
Seedlings were identified as soon as possible after germination, counted and removed<br />
or, if they could not be identified immediately, transplanted to pots to allow further growth.<br />
After 6 months, when no further seedlings germinated, the trays were left to dry for two<br />
weeks. This allowed the sample to be crumbled to expose deeper buried seeds to the light.<br />
After watering the samples for another 3 weeks and controlling the light regime in 8 hour<br />
dark/16 hour light conditions, no new seedlings emerged. Finally, the residual soil was<br />
checked for remaining seeds by viewing small random samples taken from trays under a<br />
microscope and probing seeds with a needle in order to distinguish any remaining, potentially<br />
viable seeds. Since, the number of seeds that remained in the investigated soil samples was<br />
very low (none in most cases, and always less than 3 per tray), we did not need to correct for<br />
remaining seeds. Mean number of seeds per m² was finally calculated from the 10 cores for<br />
each species recorded in the seed bank samples taken from the restoration site.<br />
2.3.4 Vegetation cover within the restoration and reference sites<br />
Vegetation data were collected in the restoration site and adjacent reference salt-marsh in<br />
permanent plots. Cover of all vascular plant species was visually estimated, using a decimal<br />
41
scale (Londo 1976). According to the size of the surface of the restoration site and adjacent<br />
salt-marsh, 175 and 66 permanent 4m² (2m × 2m) plots were collected. Vegetation was<br />
sampled in 2003, 2005 and 2007 along eight and five randomly chosen transects in restoration<br />
site and adjacent salt-marsh, respectively, which were established perpendicular to the main<br />
elevation gradient (inundation frequency). Plots were distributed evenly across transects at 3m<br />
intervals to account for vegetation heterogeneity across the study sites.<br />
2.3.5 Plant traits and site suitability<br />
The selection of plant traits was based on previous studies by Wolters et al. (2008) and prior<br />
expectations about possible effect on the abundance of new colonizers. We selected six traits<br />
related to environmental factors and seed morphology: the Ellenberg indices for nutrients,<br />
salinity and moisture (Ellenberg et al. 1991) and three seed traits: seed length, seed width and<br />
seed mass. Seed length and width are correlated to seed shape, which is related to seed<br />
buoyancy (Poschlod et al. 2005). Ellenberg indices were used to estimate the species tolerance<br />
to environmental factors and seed traits were used to estimate the seed dispersal ability.<br />
Dispersal traits were abstracted from the Biolflor database (www.ufz.de/biolflor/index.jsp),<br />
and the Leda trait database (Knevel et al. 2003, www.leda-traitbase.org) for salt-marsh<br />
species.<br />
2.3.6 Statistical analyses<br />
The average cover of each species in the restoration site and adjacent reference salt-marsh<br />
were correlated by Pearson correlation index for each year separately. For analyzing changes<br />
in species cover along time, average covers of dominant species (i.e. having a cover of at least<br />
5% during our study) were compared among years by T-tests for dependent samples for each<br />
site separately (after Bonferonni correction for multiple comparisons). Plant trait analysis was<br />
performed in order to detect the differences in trait promotion or inhibition during succession<br />
42
from 2003 until 2007. For each plant trait (three Ellenberg’s indicators and three seed traits)<br />
weighted averages were calculated at the plot level in all three years separately, i.e. 2003,<br />
2005 and 2007. All trait data were continuous. The species traits were compared between<br />
three years (2003, 2005 and 2007) using repeated measurements General Linear Modelling<br />
(GLM) and a pairwise LSD test. Calculations were done with SPSS 15.0. All data met normal<br />
distribution criteria according to Kolmogorov-Smirnov tests (after log10(x+1) transformation<br />
for plant covers).<br />
2.4 Results<br />
2.4.1 Seed production at the reference site<br />
Seed production as observed for different salt-marsh species is given in Table 2.1. In some<br />
species, no flowering stems were observed in any of the four sampling sessions. Some<br />
perennial graminoid species were contaminated by fungi. For Aster tripolium, each flowering<br />
branch contained on average 85±14 capitules. Each capitule contained 17±7.6 seeds. For<br />
Elymus athericus, most florets were empty, but by taking into account the percentage cover of<br />
this species, total seed production is still being estimated to be no less than 6.7×10 5 seeds for<br />
the reference site. For Puccinellia maritima, flowering stems were never observed. For<br />
Spartina townsendii, most spikes were contaminated with Claviceps purpurea and/or empty.<br />
Table 2.1. Seed production in different salt-marsh species at the study site.<br />
Species Unit Seeds/unit Seeds/reference site/year<br />
Aster tripolium Flowering stem 1445±650 18.2×10 8<br />
Atriplex littoralis Individual 111±29 4.1×10 6<br />
Atriplex prostrata Individual 365±78 1.3×10 7<br />
Elymus athericus Spike 0.8±1.4 6.7×10 5<br />
Limonium vulgare Flowering stem 322±284 6.0×10 8<br />
Puccinellia maritima Plant 0 0<br />
Salicornia europaea Individual 62±56 8.6×10 8<br />
Spartina townsendii Spike 0 0<br />
Suaeda maritima Individual 146±158 4.9×10 8<br />
Triglochin maritimum Flowering stem 12±15 6.7×10 5<br />
43
2.4.2 Seed bank at the restoration site<br />
The number of species within the seed bank of the restoration site was limited (Table 2.2).<br />
The density of seeds in the seed bank in the restoration site was entirely dominated by annual<br />
species. Characteristic perennial salt-marsh species, present in the above-ground vegetation of<br />
the reference site, were not recorded within the restoration site seed bank (Elymus athericus,<br />
Limonium vulgare, Plantago maritima, Puccinellia maritima, Artemisia maritima and<br />
Spartina townsendii). Aster tripolium and Triglochin maritimum were only recorded from one<br />
core with one germinating seed each.<br />
Table 2.2. Seed density (germinating seeds/m²) for salt-marsh species in the restoration site in 2006,<br />
four years after the site was first exposed to tidal inundation, also to be considered as the first exposure<br />
period to seed rain. The average of seed density was estimated in 0-15cm depth.<br />
Species Seed density (mean ± SE)<br />
Aster tripolium 3.13±3.13<br />
Atriplex littoralis 48.47±28.85<br />
Atriplex prostrata 69.36±34.95<br />
Chenopodium rubrum 971.53±424.49<br />
Glaux maritima 5.61±5.61<br />
Salicornia spp. 3431.62±1580.22<br />
Spergularia spp. 651.89±315.85<br />
Suaeda maritima 201±63.25<br />
Triglochin maritimum 2.46±2.46<br />
2.4.3 Vegetation cover within the restoration site and adjacent local salt-marsh<br />
In 2003, one year after being exposed to tidal flooding, 79% of the species present in the<br />
adjacent old salt-marsh germinated within the restoration site (Table 2.3). Species from the<br />
adjacent species pool that established during the first year were predominantly annuals. The<br />
restoration site was dominated by the annual species Suaeda maritima, Atriplex spp., Salsola<br />
kali and Salicornia europaea. The adjacent salt-marshes were dominated by the perennial<br />
species Elymus athericus, Puccinellia maritima and Limonium vulgare. There was no<br />
44
significant correlation between species cover within the restoration and the reference sites in<br />
the first year of colonization.<br />
In 2005, after three years of tidal inundation, 81% species growing in the adjacent salt-<br />
marshes were recorded in the restoration site. Glaux maritima and Parapholis strigosa, absent<br />
in 2003, were recorded in 2005 within the restoration site for the first time. There was a<br />
significant correlation between species abundance within the restoration and the reference<br />
sites in 2005 (p
Table 2.3. Average (± SE) species cover (%) in restoration and reference sites between 2003 and<br />
2007. Vegetation data were collected from mid-August until end-September. a, b and c indicate<br />
significant differences between years and within each site for dominant species (bold in the table;<br />
according to t-test for dependent samples, after Bonferonni correction for multiple comparisons). Saltmarsh<br />
species not present in the plots but present at the site are given too. (*): present in the reference<br />
site but not (yet) within the permanent plots; (**) present in the restoration site but not (yet) in the<br />
permanent plots.<br />
Species Restoration site Reference site<br />
2003 2005 2007 2003 2005 2007<br />
Agrostis stolonifera 2.02±0.81 1.89±0.47 2.26±0.54 0.21±0.10 0.36±0.17 0.41±0.2<br />
Artemisia maritima (*) 0.00±0.00 0.00±0.00 0.00±0.00 0.00±0.00 0.00±0.00 0.00±0.00<br />
Aster tripolium (**) 0.00±0.00 0.00±0.00 0.00±0.00 2.51±0.84 2.38±0.74 3.01±1.14<br />
Atriplex littoralis 0.91±0.41 0.20±0.07 0.05±0.02 1.24±1.07 0.09±0.03 0.09±0.03<br />
Atriplex prosterata 1.29±0.52 0.72±0.25 0.13±0.02 0.95±0.70 0.22±0.05 0.07±0.03<br />
Beta vulgaris ssp. maritima 0.04±0.02 0.01±0.01 0.01±0.01 0.07±0.04 0.07±0.04 0.05±0.02<br />
Cakile maritima 0.02±0.01 0.01±0.01 0.08±0.06 0.02±0.02 0.00±0.00 0.01±0.01<br />
Carex arenaria 0.19±0.04a 3.36±0.99b 5.57±1.15c 0.09±0.03a 1.53±0.91a 2.00±0.84a<br />
Chenopodium album 0.06±0.02 0.07±0.02 0.03±0.01 0.00±0.00 0.04±0.02 0.00±0.00<br />
Chenopodium glaucum 0.00±0.00 0.02±0.01 0.02±0.01 0.00±0.00 0.00±0.00 0.01±0.01<br />
Chenopodium rubrum 0.31±0.05 0.15±0.06 0.02±0.01 0.12±0.04 0.01±0.01 0.00±0.00<br />
Cirsium arvense 0.36±0.14 0.88±0.25 0.57±0.19 0.26±0.11 0.24±0.08 0.51±0.35<br />
Diplotaxis tenuifolia 0.21±0.06 0.12±0.03 0.00±0.00 0.01±0.01 0.05±0.02 0.01±0.01<br />
Elymus athericus 0.36±0.23a 1.82±0.72b 3.36±1.05c 24.01±3.77a 25.74±3.67ab 33.72±4.46b<br />
Erigeron canadensis 0.01±0.01 0.40±0.19 0.60±0.19 0.01±0.01 0.02±0.02 0.16±0.04<br />
Festuca rubra 0.02±0.01 0.22±0.11 1.14±0.35 0.43±0.2 0.64±0.30 1.72±0.60<br />
Glaux maritima 0.00±0.00 0.03±0.01 0.30±0.10 0.19±0.11 0.76±0.60 0.28±0.16<br />
Halimione portulacoides 0.01±0.01 0.00±0.00 0.01±0.01 0.07±0.04 0.25±0.13 0.34±0.17<br />
Juncus gerardii(**) 0.00±0.00 0.00±0.00 0.00±0.00 0.00±0.00 0.00±0.00 1.21±1.06<br />
Limonium vulgare 0.07±0.04a 0.13±0.02b 0.35±0.04c 5.74±1.87a 5.66±1.71a 5.14±1.73a<br />
Parapholis strigosa 0.00±0.00a 0.20±0.11b 7.90±0.95c 0.31±0.17a 0.02±0.02a 0.55±0.28a<br />
Phragmetis australis 0.01±0.01 0.02±0.01 1.02±0.51 0.02±0.02 0.06±0.02 0.14±0.06<br />
Plantago coronopus 0.01±0.01 0.18±0.06 0.56±0.15 0.43±0.18 0.09±0.04 0.07±0.03<br />
Plantago maritima 0.00±0.00 0.00±0.00 0.00±0.00 0.14±0.14 0.04±0.03 0.07±0.03<br />
Puccinellia maritima 0.01±0.01a 0.45±0.11b 3.77±0.69c 1.78±0.54a 5.31±1.32b 6.29±1.37b<br />
Sagina apetala 0.01±0.01 0.03±0.01 0.26±0.14 0.01±0.01 0.02±0.02 0.01±0.01<br />
Sagina maritima (*)(**) 0.00±0.00 0.00±0.00 0.00±0.00 0.00±0.00 0.00±0.00 0.00±0.00<br />
Salicornia europaea 1.93±0.23 11.35±1.33 8.69±1.18 3.57±1.18a 4.99±1.51a 3.33±1.21a<br />
Salicornia procumbens 0.00±0.00 3.39±0.79 3.37±0.84 0.00±0.00 2.35±0.89 1.06±0.46<br />
Salsola kali 1.66±0.29 0.51±0.14 0.15±0.03 1.13±0.32 0.39±0.24 0.12±0.03<br />
Scirpus maritimus 0.00±0.00 0.00±0.00 0.00±0.00 0.05±0.05 0.01±0.01 0.12±0.12<br />
Sedum acre 0.03±0.01 0.36±0.18 0.86±0.35 0.1±0.04 0.26±0.13 0.42±0.35<br />
Sonchus arvensis 0.01±0.01 0.09±0.06 0.07±0.06 0.00±0.00 0.01±0.01 0.01±0.01<br />
Spartina townsendii 0.02±0.01 0.18±0.13 0.15±0.08 3.70±1.40 4.99±1.7 4.47±1.63<br />
Spergularia marina 0.00±0.00 0.93±0.25 2.22±0.35 0.00±0.00 0.09±0.03 0.34±0.12<br />
Spergularia media ssp. angustata 0.03±0.01 0.11±0.04 0.53±0.11 1.00±0.25 0.53±0.09 0.20±0.04<br />
Suaeda maritima 4.10±0.60a 12.47±1.16b 21.11±1.88c 3.31±0.82a 2.59±0.66a 2.00±0.43a<br />
Triglochin maritimum 0.00±0.00 0.00±0.00 0.00±0.00 0.81±0.42 1.86±0.83 1.72±0.84<br />
46
2.4.4 Plant traits<br />
Seeds of early colonizers had the shortest length and seed length increased in time<br />
(Table 2.4). There was no significant difference in seed width between early and later<br />
colonizing species. Seed mass was lowest in 2003 and 2005, and highest in 2007. The<br />
weighted average of Ellenberg indicator of salinity was higher in 2003 and 2005 than in 2007.<br />
There was a significant decreasing trend in Ellenberg nitrogen indicator value from 2003 to<br />
2007. The early colonizers had the highest Ellenberg nitrogen indicator value in the<br />
restoration site. No clear trend was detected for moisture indication number from 2003 to<br />
2007 (Table 2.4).<br />
Table 2.4. Repeated measurements for plant traits during succession from 2003 to 2007 in the<br />
restoration site. a, b and c indicate the significant differences of traits between years.<br />
Plant traits<br />
Ellenberg nutrient<br />
(nitrogen) indicator<br />
Average 2003 Average 2005 Average 2007 df F p-value<br />
value<br />
Ellenberg moisture<br />
5.98±0.12a 5.23±0.11b 5.05±0.12c 2 25.73 0.001<br />
indicator value<br />
Ellenberg salinity<br />
6.84±0.10a 6.91±0.12a 6.94±0.11a 2 0.42 0.341<br />
indicator value<br />
6.29±0.22a<br />
6.17±0.23a<br />
6.08±0.22b<br />
2<br />
2.17<br />
0.056<br />
Seed length (mm) 1.59±0.03a 1.69±0.05b 2.02±0.03c 2 46.18 0.001<br />
Seed width (mm) 1.09±0.02a 1.06±0.02a 1.04±0.02a 2 2.13 0.122<br />
Seed mass (mg) 0.55±0.03a 0.61±0.04a 0.74±0.04b 2 420.23 0.001<br />
2.5 Discussion<br />
Limonium vulgare, Puccinellia maritima, Elymus athericus and Spartina townsendii were the<br />
late colonizers of the restoration site. We conclude that viable seed availability might be the<br />
most important constraint for these species to act as early colonizers. Nonetheless, all species<br />
can disperse seeds via seawater well (Boorman 1967; Gray & Scott 1977; Adam 1990;<br />
Huiskes et al. 1995). Since the seeds of these species also did not appear in the seed bank of<br />
the restoration site neither, probably the production of viable seeds is a very probable<br />
constraint to the appearance of these species as important initial colonizers in our study area,<br />
47
particular those species coming from low salt-marsh zones, i.e. Spartina townsendii,<br />
Limonium vulgare and Puccinellia maritima. The seed production estimates confirm this<br />
statement for some species only. In this study we used both seed production per unit and<br />
dominance of plant species for estimating seed availability. Despite the fact that the number<br />
of seeds of a given species available for dispersal may vary within a given site, according the<br />
parental abundance of species (Bertness et al. 1987), we wanted to estimate the global seed<br />
production per plant species by taking into account the mean number of seed per unit and a<br />
proxy of the number of units within the entire reference site. This particularly allowed us to<br />
consider the important cover of some species with low seed production. Indeed, Elymus<br />
athericus produced a relatively high seed number in the entire reference salt-marsh, indicating<br />
necessity of study on seed viability for this species. Concerning inter-annual variations in seed<br />
production, we can compare our results from 2008 to those obtained within the same study<br />
site in 2006 by Castermans (2007) for Aster tripolium. The author found that each flowering<br />
stem contained on average 89.76 capitules and each capitule contained on average 23 seeds,<br />
leading to a mean seed production with the same order of magnitude (2064 seeds per unit in<br />
2006, standard errors are not available, vs. 1445±650 seeds per unit in 2008). We thus argue<br />
that despite possible intra-site and inter-annual variations, our estimation of global seed<br />
production per species can be considered as a reliable general indicator of seed availability for<br />
new colonizers in the restoration site.<br />
Despite the rapid colonization of most of the species recorded in the local species pool, the<br />
abundance of early colonizers in the restoration site was not related to their abundance in the<br />
adjacent salt-marsh. Elymus athericus was dominant in the reference marshes, while, one year<br />
after creation, its cover and presence were extremely low in the restoration site. Adversely,<br />
Suaeda maritima was the dominant and most frequent species in the restoration site in 2003,<br />
while it appeared with very low cover values in the adjacent salt-marshes. There was no<br />
48
correlation between the abundance of species in the restored and adjacent salt-marshes in the<br />
first year of colonization, indicating that the relative cover of initial colonizers is determined<br />
by seed production rather than by standing cover in the reference sites. This again confirms<br />
the first hypothesis, indicating some species despite high abundance in the surrounding area<br />
can not be first colonizers since they can not produce sufficient viable seeds.<br />
The early colonizers of the restoration site in 2003 had the shortest seed length and<br />
lowest seed mass (second hypothesis). As the ratio of length over width (seed shape) and seed<br />
mass has been proven to be negatively correlated with seed buoyancy (Poschlod et al. 2005),<br />
it can be concluded that initial colonizers had a higher buoyancy and therefore greater<br />
dispersal ability than late colonizers. In addition, it has been demonstrated that seeds of<br />
pioneer species can disperse by other mechanisms, i.e. not only as seed, but also as seedling<br />
and adult plant (Dalby 1963; Morisawa 1999; Davy et al. 2001), increasing the chance of a<br />
higher number of seeds to disperse.<br />
Salicornia, Salsola and Suaeda were the dominant genera in the early stages of<br />
vegetation colonization within the restoration site. In our study, these genera only comprised<br />
annual species that produce large seed numbers (Morisawa 1999; Davy et al. 2001; Wolters &<br />
Bakker 2002). The large seed production (production of up to one million seeds per plant in<br />
Salsola kali: Duke, 1983 cited by Wolters et al. 2008 and 300-30000 per m² in Salicornia and<br />
Suaeda: Wolters et al. 2008 and the results of this study), high viability (Davy et al. 2001),<br />
high floatability of seeds (shortest seed length and lowest seed mass) and seedling and entire<br />
plant, may explain their rapid colonization within the first year after creating the new salt-<br />
marsh.<br />
Salinity was not shown to be the most important factor inhibiting the germination and<br />
establishment of species (part of the second hypothesis), since the Ellenberg index for salinity<br />
was between six and eight. If their seeds were transported to the restoration site and did not<br />
49
germinate, the seeds should have appeared in the seed bank. The data of the seed bank<br />
showed that some species had little or no seed bank available in the restoration site.<br />
Therefore, seed availability might be the most important factor to explain the absence of these<br />
species as initial colonizers. Nevertheless, species that colonized in 2003 and 2005, showed<br />
higher mean salt tolerance than species that colonized in 2007, indicating also higher salt<br />
tolerance for initial colonizers. Wolters et al. (2008) stated that salinity was the most<br />
important factor influencing the absence or presence of species as initial colonizers. In<br />
general, the late increase in abundance of these perennial species suggests that the increase of<br />
abundance is mainly occurring by clonal expansion.<br />
50<br />
Early colonizing species had the lowest nutrient Ellenberg indices. In this study, Salsola<br />
kali, with low nutrient-limitation tolerance, had a high abundance in the first year of<br />
colonization. However, previous studies showed that nutrient availability is rarely limiting in<br />
salt-marsh systems with the exception of those of barrier islands (van Wijnen & Bakker<br />
1999).<br />
The presence of a salt-marsh close to restoration sites appears to be a pre-requisite for<br />
rapid regeneration and colonization of new salt-marsh (Thom et al. 2002; Wolters et al. 2008).<br />
Four years after creation, the restored IJzer marsh showed species composition similar to that<br />
of adjacent old salt-marsh. The speed and rate of colonization in our study area was similar to<br />
that observed in the Sieperda tidal marsh in Scheldt estuary in the Netherlands (Eertman et al.<br />
2002). Vegetation succession took place rapidly and within 5 years, the newly created mudflat<br />
became colonized with most adjacently appearing salt-marsh species. The same pattern and<br />
progress was observed in an estuarine restoration site in the Elk River Estuary, USA (Thom et<br />
al. 2002), which was created by re-introducing a tidal inundation regime to a former<br />
embankment area. Here, the largest increase in number of species occurred 3 years after de-<br />
embankment and after 5 years species diversity was similar to an adjacent reference marsh.
In our study, most species growing on the reference salt-marsh were also recovered in the<br />
vegetation of the restoration site shortly after creation.<br />
A review of salt-marsh restoration at different sites in north-west Europe showed that<br />
between 48% and 100% of the species present in the local species pool established in the<br />
restoration site within 1-13 years after de-embankment (Wolters et al. 2008). Compared with<br />
the regional species pool, only 26-64% of the species established in the restoration sites<br />
(Wolters et al. 2005b; Wolters 2006). Wolters et al. (2008) showed that 8 years after<br />
restoration, only 32% of the regional species pool had established in the Tollesbury<br />
restoration site and the establishment of regional salt-marsh species in new salt-marsh may<br />
take several years to be reached and established. The distance between the restoration site and<br />
existing salt-marshes and the number of inundations per year may be important determinants<br />
of the speed with which newly created intertidal areas are colonized. This is shown by at least<br />
three species present on the old salt-marsh part O2 (Fig. 1.4) of the IJzer which were not<br />
recorded in plots on the restoration site by 2007 (Artemisia maritima, Plantago maritima and<br />
Triglochin maritimum). Since at least both last species produce sufficient seeds that can float<br />
in sea water from a few hours to several months and most seeds retain their viability in salt<br />
water and germinate when exposed to suitable conditions (Reading et al. 2008), their seeds<br />
apparently did not reach the restoration site in sufficient large numbers to allow successful<br />
colonization. The lack of colonization success of these three species is most probably caused<br />
by the low connectivity between O2 and the restoration site (cf. Fig. 1.4), both being<br />
separated by a narrow 7m TAW high dike (mean high water tide is ca. 4.45m TAW; mean<br />
spring tide high water reaches 4.86m TAW). We can conclude from these findings that<br />
hydrological connectivity between seed source and sink is vital for successful colonization of<br />
salt-marsh restoration sites. Even a distance of only 1km between seed source and seed sink<br />
area, which is the approximate distance at the study site between the old salt-marsh O2 and<br />
51
the restoration site along a strongly curved line, seems unbridgeable on the short term (six<br />
years).<br />
2.6 Conclusion<br />
The present study showed that the development of salt-marsh target species could be<br />
restricted by limited viable seed production and unfavourable soil conditions. In its current<br />
state there is a little hope that the vegetation of the restoration site will evolve towards a<br />
complete range of salt-marsh vegetation on the short run. It seems that some species such as<br />
Artemisia maritima, Plantago maritima and Triglochin maritimum would benefit from<br />
(artificial) seed introduction in the restoration site. Some species such as Spartina townsendii<br />
may not be able to perform as a pioneer species in the restoration site even if safe sites and a<br />
proper elevation level (i.e. inundation frequency) would be available. Nevertheless, it would<br />
be able to expand substantially by rhizome dispersal, followed by vegetative expansion<br />
(Garbutt & Wolters 2008). The successful establishment and spread of this species has been<br />
well documented and was largely attributable to the species’ rapid dispersal by rhizome<br />
pieces, perennial life-history and the colonization of mudflats formally unoccupied by salt-<br />
marsh plants (Gray et al. 1990). This study confirms the importance of a salt-marsh nearby to<br />
a restoration site and the importance of a continuous, short and straightforward water bridge<br />
between seed source and sink.<br />
52
Chapter 3 Inundation frequency determines the post-pioneer<br />
successional pathway in a newly created salt-marsh 2<br />
2 Not yet submitted to a scientific journal<br />
Field data were collected by the first author<br />
<strong>Erfanzadeh</strong> R., Maelfait J.-P. & Hoffmann M.
3.1 Abstract<br />
54<br />
The effect of inundation frequency on plant community composition, species turnover,<br />
total and growth form cover, species richness and abundance of individual common species<br />
was investigated. The study area was a newly created salt-marsh located along the Belgian<br />
coast with a more or less continuous gradient of inundation frequencies from 0.01% of all<br />
high waters for highest elevations to 100% for lowest elevations. Cover of all plant species<br />
was estimated in 119 permanent 2m × 2m plots along six randomly chosen transects<br />
perpendicular to the main inundation gradient with a 3m distance between the plots in 2003,<br />
2005 and 2007. Detrended correspondence analysis (DCA) scores were used as a proxy for<br />
plant composition. Total cover, the cover of annuals and perennials, total species richness,<br />
species richness of annuals and perennials and species turnover was calculated for each plot.<br />
Repeated measurements and LSD were used to compare all variables in three different years<br />
for different inundation frequencies. In addition, TWINSPAN was used to distinguish plant<br />
communities in different years.<br />
The results showed that plant composition changed differently according to inundation<br />
frequency. The cover of annual species increased at a higher pace at higher inundation<br />
frequencies. The cover of perennials increased at higher pace at lower inundation frequencies.<br />
In total, species richness and the abundance of most species increased in time, indicating<br />
absence of a competitive exclusion among species. Nevertheless, the abundance and<br />
frequency of Atriplex spp., Chenopodium spp. and Salsola kali strongly decreased in time,<br />
indicating a declining natural succession. It seems that perennial species (e.g. Elymus<br />
athericus) are spreading by vegetative propagules from upward to downward. Frequent<br />
inundations hampered plant species turnover, because of the low number of species that can<br />
tolerate that environmental condition. The frequencies of communities dominated by Elymus<br />
athericus and Salicornia procumbens strongly increased in time, indicating that these species
are getting more and more spatially separated, leading to a stronger separation of plant<br />
communities and an appearance of a salt-marsh zonation.<br />
Key words: Succession, Salt-marsh, Species turnover, Plant composition, Inundation<br />
frequency<br />
55
3.2 Introduction<br />
56<br />
Tidal marshes are colonized by salt tolerant plant species adapted to complete their life<br />
cycle in saline environments. The spatial distribution of vegetation in salt-marshes is<br />
organized in rather well delineated patches (Beeftink 1962; 1965; 1966; 1977; Adam 1990; de<br />
Leeuw 1992; Marani et al. 2003). The distribution is not random nor spatially uncorrelated<br />
but is, on the contrary, organized in characteristic patches whose observation has stimulated<br />
an increasing interest in the phenomenon of zonation (Silvestri & Marani 2004). A number of<br />
authors (Packham & Willis 1997; Costa et al. 2003) have described plant zonation in salt-<br />
marsh habitats and have evaluated the environmental conditions affecting the distribution of<br />
plant species. Scholten & Rozema (1990) demonstrated that the composition and distribution<br />
of plant communities along the elevational gradient (zonation) of a salt-marsh is related to the<br />
ability of individual species to tolerate environmental conditions associated with tidal<br />
inundation. Several abiotic factors vary in association with tidal inundation, including salinity<br />
(Rozema & van Diggelen 1991) and disturbance in the form of burial by debris (Brewer et al.<br />
1998). Environmental factors, such as sediment subsurface drainage, sediment deposition and<br />
water logging, which are associated with tidal inundation and distance to creek systems,<br />
determine the distribution and biomass production of salt-marsh species and consequently<br />
salt-marsh vegetation patterns and plant species zonation (Huckle et al. 2000; Silvestri &<br />
Marani 2004). Olff et al. (1988) stated that there are several ways in which species are<br />
influenced by the inundation by seawater, i.e. increasing inundation frequencies reduce the<br />
cover of the vegetation by inducing anaerobiosis of the substrate, by deposition of sand and<br />
clay, or by the toxic effects of salt, changing competitive interactions between species.<br />
Once vegetation is established, individual species cover and total composition change<br />
over time: succession takes place. A traditional view of succession is that assemblages slowly<br />
and progressively occupy a site until a homogeneous, sustainable community develops
(Odland & del Moral 2002). Similar to other habitats, succession on salt-marsh includes both<br />
floristic change as a function of time and a spatial separation in relation to environmental<br />
factors (Odland & del Moral 2002). Some of the first hypotheses of the concept of succession,<br />
i.e. the replacement of plant species in an orderly sequence of colonization and development<br />
(Silvestri et al. 2005), were linked to zonation in salt-marsh habitats (Chapman 1976). This<br />
hypothesis is based on the assumption that, on emerging salt-marshes, after an initial<br />
colonization phase, the substrate would be more stable and sediments would be trapped by the<br />
vegetation. This would allow other species to invade the marsh, producing changes directed<br />
towards a mature and stable climax ecosystem (Odum 1971). Nevertheless, results from long-<br />
term monitoring revealed that the dynamics of salt-marsh vegetation did not always proceed<br />
according to these classical succession schemes (de Leeuw et al. 1993). Adam (1990) reported<br />
that rapid succession of salt-marsh vegetation has been recorded in some cases, but in most<br />
studies, community boundaries remained relatively stable for years. At the species level, some<br />
species persist over long periods in an area, whereas other species disappear without<br />
recolonizing (Goetghebeur 1976). Salt-marsh vegetation dynamics is thus seen to be complex,<br />
and a deeper understanding of halophyte spatial and temporal patterns is required in different<br />
environmental conditions. It is expected that environmental conditions affect the speed, rate<br />
and trajectory of vegetation succession.<br />
It has been demonstrated that marshes high in the tidal frame, experience up to complete<br />
litter removal and greater likelihood of inorganic sedimentation due to the frequent tidal<br />
inundation. This relatively high allogenic influence leads to a change in vegetation (Packham<br />
& Willis 1997; Huckle et al. 2000). Although, the rate of sedimentation and erosion is higher<br />
at lower elevations because of higher inundation frequency (Packham & Willis 1997),<br />
dynamic conditions allow a very limited number of species to germinate and grow. It follows<br />
that species succession will occur with lower speed in these zones and vegetation would be<br />
57
more stable. Consequently, species turnover and change in vegetation composition would be<br />
more frequent at higher elevation and hence at lower inundation frequency.<br />
58<br />
Although many studies deal with wetland patterns and succession (e.g. van der Valk<br />
1981, Noon 1996), only few have measured vegetation change rates (Odland & del Moral<br />
2002). Vegetation change rates can be estimated in several ways, including changes in species<br />
cover (Prach et al. 1993; Oksanen & Tonteri 1995), species composition (Eilertsen et al. 1990;<br />
Odland & del Moral 2002) or species turnover or ß-diversity (Rydin & Borgegard 1988).<br />
Vegetation changes are however demonstrated most clearly at the composition or/and<br />
species level. Few studies are available in which vegetation changes were marked by a growth<br />
form progression i.e. annuals, perennials and clonal perennials (Odland & del Moral 2002). In<br />
the present study, we investigated the successional change in plant communities, growth form<br />
and cover of common salt-marsh species in time and whether inundation frequency affected<br />
this temporal change. Annual species can disperse everywhere since they produce many seeds<br />
(see chapter 2), therefore it can be expected that the total cover and richness of annuals<br />
increase in time in early primary succession. While perennials, of which Elymus athericus is<br />
the most important in the higher marshes, unable to produce seeds, spread by vegetative<br />
growth (see chapter 2). It can be expected that the cover and the richness of perennials<br />
increase in higher elevation (or lower inundation frequency). We tested the following<br />
hypotheses: 1- perennial cover and richness increase with decreasing inundation frequency<br />
while annual cover and richness decrease during early primary succession, irrespective of<br />
inundation frequency, 2- the composition of plant communities that experience high<br />
inundation frequencies are more stable than communities subjected to lower inundation<br />
frequency, and 3- species turnover in time is higher when inundation frequency is lower. In<br />
addition, we described variation in plant communities and individual salt-marsh species over<br />
time.
3.3 Material and methods<br />
3.3.1 Study area<br />
The study area (ca. 14 ha) is situated in the IJzermonding nature reserve on the IJzer<br />
estuary, Belgium. The restoration site was created following the large scale demolition and<br />
removal of buildings and the underlying slurry material between 1999 and 2002. The<br />
restoration site was profiled to provide a continuous gradient of inundation frequencies from<br />
0.00 for highest elevations to 100% for lowest elevation of all high waters (i.e. 1 to ca. 735<br />
inundations per year). The objective of the restoration project was to create or restore beach-<br />
dune-salt-marsh ecotones with salt-fresh, dynamic-stable, wet-dry and mud-sand ecotones.<br />
Colonization was started in a completely sterile substrate, i.e. no soil seed bank existed (tested<br />
in a pilot study, Stichelmans 2002 cit. in Hoffmann & Stichelmans 2006). Approximately 3 to<br />
4 meters of slurry material were removed prior to tidal inundation. Site construction was<br />
carried out in such a way that a more or less continuous inundation frequency would be<br />
available. The vegetated–sampled plots had an inundation frequency gradient from 0% (in<br />
very few plots) to 69.19% per year in 2003.<br />
3.3.2 Data collection<br />
3.3.2.1 Vegetation<br />
Vegetation data were collected in the restoration site in permanent plots. Examining<br />
permanent plots on newly formed land surface is an obvious means of observing temporal<br />
changes in vegetation (Burrows 1990; Bakker et al. 1996). Cover of all vascular plant species<br />
(and bryophytes if present) was visually estimated, using a decimal scale (Londo 1976), in<br />
119 permanent 2m × 2m plots in 2003, 2005 and 2007. The plots were located along six<br />
randomly chosen transects which were established perpendicular to the inundation gradient.<br />
The distance between the plots was three meters within transects.<br />
59
3.3.2.2 Inundation frequency<br />
60<br />
The inundation frequency of a vegetation plot is defined here as the percentage of all<br />
tides during one year that are higher than the elevation of the vegetation plot. The elevation of<br />
each plot was measured using a 'total station' (Leica TC1600) in 2002. The reference used is<br />
the Belgian Lambert '72 projection for x-y and 'Tweede Algemene Waterpassing' (T.A.W.)<br />
for altitude. Reference points from the NGI (National Geographical Institute) that were<br />
present in the neighbourhood were used as a bench mark for the measurements. Tidal<br />
information is also gathered permanently at the site by the administrative authorities of the<br />
Flemish Community. From these continuous data, we extracted all absolute high tide levels<br />
during the period 1991-2000. These give a fairly reliable estimate of high tide levels for the<br />
vegetation study period, since tidal movements did not evolve significantly during the last<br />
decade. More recent tidal data were not available for that long period of time. From these<br />
data, we calculated a general inundation curve (Fig. 3.1), from which we calculated the<br />
inundation frequency for each vegetation plot within the restoration site. The percentage<br />
inundation frequency for each plot was defined:<br />
(the number of high tides that inundate the plot in one year/ total high tide in one year) × 100.<br />
3.3.3 Data analysis<br />
Plant community composition differentiation was visualized by detrended<br />
correspondence analysis (DCA), using CANOCO (Lepš & Šmilauer 2005). Since axes 1 and<br />
2 explained a large proportion variation, only scores on the first two axes were used as a<br />
measure for plant community species composition.
%<br />
100<br />
90<br />
80<br />
70<br />
60<br />
50<br />
40<br />
30<br />
20<br />
10<br />
0<br />
overstromingsfrequentie - Nieuwpoort<br />
o.b.v. tijwaarnemingen 1991-2000 t.h.v. tijdok<br />
GDHW GHW GSHW<br />
3.00 3.50 4.00 4.50 5.00 5.50 6.00<br />
Plot hoogte height in in mTAW m TAW<br />
Fig. 3.1. Reconstructed inundation frequency curve, using tidal measurements (consecutive high<br />
tides) measured at the automatic measuring point on the northern peer along the former tidal<br />
harbour, based on tidal observations in the period 1991-2000 (Fremout 2002). GDHW: mean neap<br />
tide high water; GHW: mean high water; GSHW: mean spring tide high water. All points at the left<br />
side of the curve are inundated at every high tide; all points at the right hand side of the curve are<br />
never inundated (during the ten years observation period); redrawn from Hoffmann et al. 2006a.<br />
Total species richness, total cover and the cover (and richness) of growth forms (annuals<br />
and perennials) were transformed to log10(x+1) to meet the normal distribution. Repeated<br />
measurements ANOVA models with LSD tests were used to compare species richness, DCA<br />
scores, total cover and the cover (and richness) of growth forms (annuals and perennials)<br />
between years with respect to the inundation frequency. Species richness was the number of<br />
species observed in 2m × 2m plots. Species richness, DCA scores, total cover and the cover<br />
(and richness) of growth forms were introduced to the model as within-subject variables while<br />
inundation frequency was introduced as covariate. The interaction between year and<br />
inundation frequency was also introduced to the model.<br />
Because the interaction between year and inundation frequency was highly significant<br />
for most variables, we did linear regressions separately on different year plots (2003, 2005<br />
61
and 2007) for those variables that showed a significant effect of years, inundation frequency<br />
and their interaction. Since linear regressions in some cases showed a low R², we also tried to<br />
estimate the best fitting curve between inundation frequency and vegetation (perennial cover,<br />
perennial richness and annual cover) in 2003, 2005 and 2007. Linear, logarithmic, inverse,<br />
quadratic, cubic, power, compound, logistic, growth and exponential regression were<br />
compared. Dependent and independent variables were transformed to positive values (by<br />
adding the value of 0.01) to enable the calculation of different models. In addition, the cover<br />
of the most common salt-marsh species (Packham and Willis 1997) were compared between<br />
years (after Bonferonni correction for multiple comparisons) using Friedman and Wilcoxon<br />
test (a non-parametric test was used, since cover of individual species did not meet normal<br />
distribution criteria) two by two (2003 and 2005, 2005 and 2007, 2003 and 2007).<br />
62<br />
A species turnover rate was calculated according to the method of Bakker et al. (2003).<br />
To calculate species turnover for a plot in a specific year t, the number of species in that plot<br />
present in both year t and year t-1 was divided by the average total number of species in that<br />
plot and subtracted from 1. The species turnover rates between 2003-2005 and 2005-2007<br />
were averaged. A linear regression model was used to test the relationship between the<br />
species turnover and inundation frequency.<br />
Data from 2003 to 2007 were clustered using TWINSPAN (Hill 1979) in order to<br />
distinguish plant communities in different years. There were 119 plots in each of the three<br />
years, and if no change occurred, each plot would be in the same class in each year.<br />
3.4 Results<br />
3.4.1 Variation in cover (and frequency) of individual species<br />
The cover of the perennials and of the annuals of the frequently inundated zones<br />
(Elymus athericus, Limonium vulgare, Puccinellia maritima, Salicornia europaea and Suaeda
Cover(%)<br />
Cover(%)<br />
7.00<br />
6.00<br />
5.00<br />
4.00<br />
3.00<br />
2.00<br />
1.00<br />
0.00<br />
50.00<br />
45.00<br />
40.00<br />
35.00<br />
30.00<br />
25.00<br />
20.00<br />
15.00<br />
10.00<br />
5.00<br />
0.00<br />
A<br />
a<br />
a<br />
B<br />
Agrostis stolonifera<br />
a<br />
b<br />
a<br />
b<br />
2003<br />
2005<br />
2007<br />
Atriplex spp. Chenopodium spp. Salsola kali<br />
a b<br />
a<br />
Elymus athericus<br />
Limonium vulgare<br />
Puccinellia maritima<br />
c<br />
Salicornia europaea<br />
b b<br />
c a<br />
b a c<br />
a<br />
b b<br />
b a a<br />
b<br />
c<br />
a<br />
Salicornia procumbens<br />
b<br />
c<br />
2003<br />
2005<br />
2007<br />
b<br />
Suaeda maritima<br />
Fig. 3.2. Average of percentage cover (Mean + SD) of individual species in different years; Different<br />
successive letters indicate significant differences (at p
maritima) increased over time (Fig. 3.2B). The cover of annuals of the higher zones (Atriplex<br />
spp., Chenopodium spp. and Salsola kali) decreased in time (Fig. 3.2A). Atriplex spp.,<br />
Chenopodium spp. and Salsola kali were observed in 40, 37 and 39 plots, respectively, in<br />
2003, while they were observed in 15, 9 and 13 plots in 2007, respectively. Without<br />
exception, Agrostis stolonifera, Elymus athericus, Limonium vulgare, Puccinellia maritima,<br />
Salicornia europaea, Salicornia procumbens and Suaeda maritima all increased in occurrence<br />
(frequency in 2003 and 2007, respectively: 11�34, 14�51, 4�42, 2�60, 60�72, 0�32<br />
and 59�85 of the 119 plots).<br />
64<br />
Perennial richness<br />
1.4<br />
1.2<br />
1<br />
0.8<br />
0.6<br />
0.4<br />
0.2<br />
0<br />
03<br />
R 2 = 0.55(2007)<br />
R 2 = 0.32(2005)<br />
R 2 = 0.18(2003)<br />
05<br />
2003<br />
2005<br />
2007<br />
07<br />
0 10 20 30 40 50 60 70 80<br />
Inundation frequency (%)<br />
Fig. 3.3. Relationship between inundation frequency and perennial richness (slope-year 2003= -0.09,<br />
R²= 0.18; p
of perennials increased by 86% between 2003 and 2005 and increased by another 63%<br />
between 2005 and 2007. There was a tendency for an increasing difference in the number of<br />
Richness<br />
Cover(%)<br />
18<br />
16<br />
14<br />
12<br />
10<br />
8<br />
6<br />
4<br />
2<br />
0<br />
120<br />
100<br />
80<br />
60<br />
40<br />
20<br />
0<br />
a<br />
A<br />
b<br />
c<br />
a<br />
b<br />
2003<br />
2005<br />
2007<br />
Total richness Perennial richness Annual richness<br />
a<br />
B<br />
b<br />
c<br />
a<br />
b<br />
Total cover Perennial cover Annual cover<br />
Fig. 3.4. The average (Mean + SD) of richness per 4m² (A) and cover (B) in different years; Different<br />
successive letters indicate significant differences (at p
perennial species between years, with higher increase in the less frequently inundated plots<br />
(Table 3.1 and Fig. 3.3).<br />
Table 3.1. Result of the repeated measurements for richness, cover and composition for plant species<br />
recorded in the IJzermonding restoration site between 2005 and 2007 (n= 119).<br />
Effect Year Inundation frequency Year × Inundation frequency<br />
F-statistic p-value F-statistic p -value F-statistic p -value<br />
Total richness 111.47
Annual cover (%)<br />
Perennial cover (%)<br />
2.5<br />
2<br />
1.5<br />
1<br />
0.5<br />
0<br />
2.5<br />
2<br />
1.5<br />
1<br />
0.5<br />
0<br />
07<br />
03<br />
05<br />
R 2 = 0.18(2007)<br />
R 2 = 0.14(2005)<br />
R 2 = 0.10(2003)<br />
0 10 20 30 40 50 60 70 80<br />
03<br />
05<br />
07<br />
(a)<br />
Inundation frequency (%)<br />
R 2 = 0.47(2007)<br />
R 2 = 0.28(2005)<br />
R 2 = 0.16(2003)<br />
0 10 20 30 40 50 60 70 80<br />
Inundation frequency (%)<br />
Fig. 3.5. Relationship between inundation frequency and (a) annual cover (slope-year 2003= -0.32,<br />
R²= 0.10; p
68<br />
Perennial richness<br />
1.4<br />
1.2<br />
1<br />
0.8<br />
0.6<br />
0.4<br />
0.2<br />
0<br />
05<br />
07<br />
03<br />
R 2 = 0.61(2007)<br />
R 2 = 0.61 (2005)<br />
R 2 = 0.57 (2003)<br />
0 10 20 30 40 50 60 70 80<br />
Inundation frequency (%)<br />
Fig. 3.6. The best fit of regression between inundation frequency and perennial richness. In 2003:<br />
logarithmic, R²= 0.57, p
Annual cover (%)<br />
Perennial cover (%)<br />
2.5<br />
1.5<br />
1<br />
0.5<br />
2.5<br />
2<br />
1.5<br />
1<br />
0.5<br />
0<br />
2<br />
0<br />
(a)<br />
03<br />
07<br />
05<br />
R 2 = 0.34 (2007)<br />
R 2 = 0.24 (2005)<br />
R 2 = 0.10 (2003)<br />
0 20 40 60 80<br />
07<br />
05<br />
03<br />
Inundation frequency (%)<br />
(b)<br />
R 2 = 0.63 (2007)<br />
R 2 = 0.61 (2005)<br />
R 2 = 0.53 (2003)<br />
0 10 20 30 40 50 60 70 80<br />
Inundation frequency (%)<br />
Fig. 3.7. The best fit of regression between inundation frequency and (a) annual cover (in 2003: linear,<br />
R²= 0.10, p
70<br />
Species turnover<br />
1.2<br />
1<br />
0.8<br />
0.6<br />
0.4<br />
0.2<br />
0<br />
R 2 = 0.30<br />
0 10 20 30 40 50 60 70 80<br />
Inundation frequency<br />
Fig. 3.8. The relationship between inundation frequency and species turnover (slope= -0.05, p
3.5 Discussion<br />
Annual species were the first species to colonize the salt-marsh and confirmed hereby<br />
their status as pioneer species. The number of annual species increased during the first years,<br />
but remained constant in the latest stage. While some pioneer species (Salicornia europaea<br />
and Suaeda maritima) increased, some other species decreased (Atriplex spp., Chenopodium<br />
spp. and Salsola kali) in cover. Some pioneer annuals (in particular members of<br />
Chenopodiaceae family) were replaced with other pioneer species or by new colonizing<br />
species. The rate of annual cover expansion increased with higher inundation frequency over<br />
time. The cover of perennials increased with time with the speed of expansion rate higher<br />
with reducing inundation frequency (hypothesis 1). Puccinellia maritima and Elymus<br />
athericus expanded more than other perennials, recorded within the site. Puccinellia maritima<br />
increased in frequency between 2003 and 2007. Drastically increasing of Puccinellia<br />
maritima has also been reported in natural succession in other salt-marshes (Eertman et al.<br />
2002; Reading et al. 2008). However, increasing total species richness and total cover showed<br />
that competitive exclusion could not be demonstrated up to 2007. This is in contrast with the<br />
results of Odland and del Moral (2002), who showed that species richness in a wetland<br />
ecosystem peaked one year after the sediment exposition, then the number of species on the<br />
plots declined by competition, and finally stabilized. In our study area, this temporal pattern<br />
did not occur. In addition, in their study, vegetation establishment of different vascular<br />
species on exposed sediments was more rapid in comparison with our study, probably due to<br />
persistent seed banks and more favourable conditions in their study. Odland & del Moral<br />
(2002) demonstrated that existing a high species richness and density in the seed bank of<br />
exposed sediment resulted in a rapid appearance of high numbers of species in the above-<br />
ground vegetation in the first year and starting the competitive exclusion quickly. Seed banks<br />
are important for rapid recovery of marsh vegetation after sediment exposition (Keddy &<br />
71
Reznicek 1986). They therefore play an important role in early succession. In our study area,<br />
the establishment of plant species on exposed sediments was certainly due to seed dispersal<br />
by tidal water. The seed bank was likely to play no role in the establishment of pioneer plants,<br />
because most of the area was covered by buildings and the soil was dug out after the<br />
destruction of the building (see Hoffmann & Stichelmans (2006) for a pilot study of the mud<br />
flat seed bank). Tidal inundation is thought to be the main dispersal agent. The important role<br />
of tidal currents in seed dispersal of halophytes has already been proven (e.g. Huiskes et al.<br />
1995; Tatyana 2000). The tide is an important vector for the dispersal of plant propagules in<br />
salt-marsh restoration.<br />
72<br />
The first dominant pioneer species were Suaeda maritima, Salicornia europaea,<br />
Atriplex spp., Salsola kali and Chenopodium spp. Observations of the surrounding area<br />
(adjacent existing salt-marsh) showed that all pioneer species occur at close distances from<br />
the study site and could be delivered to the restoration site by tidal water.<br />
Plant composition within the restoration site changed over time (hypothesis 2). In areas<br />
of the site with a higher inundation frequency, the rapid expansion of some species (e.g.<br />
Suaeda maritima), the appearance of new species (e.g. Salicornia procumbens), and change in<br />
the abundance of other species (e.g. Salicornia europaea) resulted in a variation in plant<br />
composition. At lower inundation frequencies, the expansion of some species (e.g. Elymus<br />
athericus), and turnover of others, resulted in a change in species composition; as the results<br />
showed higher turnover and higher expansion of perennials at lower inundation frequencies.<br />
Nevertheless, species turnover was lower at higher inundation frequency (hypothesis 3).<br />
Frequent inundations hence hampered plant species turnover. This is likely to be a<br />
consequence of a higher rate of nitrogen accumulation at higher and less inundated sites (Olff<br />
et al. 1997), which may result in changes in biomass production and is therefore likely to<br />
determine the rate of succession and turnover (Marrs et al. 1983; Wijnen & Bakker 1999). In
addition, in the salt-marsh environment, an increase in elevation is associated with an increase<br />
in the species pool, or the number of potential species that can tolerate the abiotic conditions.<br />
In contrast, at low elevations where inundations occur frequently, few species can germinate<br />
and grow, so species turnover will be lower. Furthermore, at higher elevations and hence<br />
lower inundation frequency, the species pool is combined with less salt tolerant, glycophytic<br />
species, resulting in greater potential species richness and a higher species turnover.<br />
The frequency of Chenopodium spp., Atriplex spp. and Salsola kali decreased by 76%,<br />
51% and 53% between 2003 and 2007, respectively. As a result, these species disappeared<br />
from most plots in 2007, and it is to be expected that these species will locally go extinct in<br />
the future. Although, natural succession following the invasion and establishment of new<br />
species can change the floristic composition of wetland vegetation (e.g. van der Valk 1981), it<br />
is probable that sheep grazing caused a rapid decline after initial colonization of these highly<br />
palatable annual species (see more details in chapter 4).<br />
In comparison with 2007, there were no or very few plots in which Elymus athericus<br />
and Salicornia procumbens dominated in 2003. This could be an indication of the progress of<br />
a more explicit zonation over time. Over time, vegetation patterns show species adapted to a<br />
particular inundation frequency zone over the elevation gradient: the segregation of species,<br />
communities and zonation in space occurs (Eilers 1979; Bockelmann et al. 2002; Costa et al.<br />
2003).<br />
Conclusion<br />
Although the entire restoration site was created at one particular moment, an inundation<br />
frequency gradient was created artificially, leading to a zonation of different plant populations<br />
even in the first year after first colonization. It seems that vegetation succession is related with<br />
inundation frequency which is affected by sedimentation. At higher inundation frequencies,<br />
Salicornia procumbens and Spartina townsendii appeared later than Salicornia europaea and<br />
73
Suaeda maritima. Spartina is well known as a key species in trapping of sediments. The<br />
colonization of Spartina townsendii at lower elevation can induce replacement of Salicornia<br />
populations by species typical of intermediate elevations (e.g. Suaeda maritima). The<br />
replacement of Suaeda maritima by high salt-marsh species (e.g. Elymus athericus) can<br />
happen quickly (see chapter 5). Since tidal inundation is a strong agent for seed dispersal and<br />
sedimentation (and/or erosion), it has a strong impact on species replacement and succession<br />
in time and space.<br />
74
Chapter 4 Short-term impact of sheep grazing on salt-marsh<br />
vegetation succession in a newly created salt-marsh site 3<br />
<strong>Erfanzadeh</strong> R., Milotic T., Pétillon J., Maelfait J.-P., & Hoffmann M.<br />
3 This chapter has been invited for re-submission in Grass and Forage Science on 9 th of February <strong>2009</strong>.<br />
Field data on vegetation composition were sampled by R. <strong>Erfanzadeh</strong>; forage data were sampled by T.<br />
Milotic
4.1 Abstract<br />
76<br />
In this paper, the effect of three winter seasons of sheep grazing on cover, composition<br />
and species richness of vegetation, Elymus athericus expansion and forage quality of salt-<br />
marsh species were studied. Four zones were selected: three in real salt-marsh habitat (low,<br />
intermediate and high levels) and the fourth in the transition between salt-marsh and sand<br />
dune habitat. In each of the three salt-marsh zones, one site was selected and two sites were<br />
designated in the transitional zone. Half of each site was excluded from grazing (so-called<br />
exclosures) all year round, while the other half was accessible to sheep from mid-August until<br />
mid-June (enclosure areas). At each zone, 10 plots (2m × 2m) were established: five within<br />
exclosure and five within enclosure sites. In all plots, the cover of all species was estimated in<br />
the growing season in 2005 (initial state) and 2007 (state after two years of grazing). In<br />
addition, a total of 1516 quadrates (50cm × 50cm) were used to harvest the biomass of species<br />
to estimate the forage quality variation during the grazing period inside the plots. The forage<br />
quality variables were the percentages of crude protein, acid detergent fibre and neutral<br />
detergent fibre. The data of the cover of dominant salt-marsh species, species richness, total<br />
cover, plant composition and forage quality parameters are compared between exclosure and<br />
enclosure plots and between two sampling years (2005 and 2007) using repeated<br />
measurements (general linear model) separately for each zone. The results showed that after<br />
three years of plant succession, sheep grazing had a positive influence on plant richness on the<br />
high part of the salt-marsh, a negative effect in the transitional zone and no effect in the other<br />
zones. Grazing had no effect on cover and plant composition. Forage quality parameters were<br />
affected by sheep grazing only in the low salt-marsh zone. Limonium vulgare had the highest<br />
forage quality and Elymus athericus had the lowest. It would appear that grazing with the<br />
current intensity and number of grazers would fail to hamper the expansion of Elymus
athericus. A higher intensity of mixed sheep-cattle or cattle grazing would be needed to better<br />
control this highly prolific species.<br />
Key words: Succession, Management, Intertidal habitats, Forage quality, Elymus athericus<br />
77
4.2 Introduction<br />
78<br />
Salt-marshes are important intertidal ecosystems. Many salt-marsh plant species and<br />
their associated communities are rare (Doody et al. 1993) and vulnerable to extinction<br />
(Westhoff et al. 1993). These areas are also important refuges for many animal species and<br />
play a great role for the conservation of biodiversity in general (Lefeuvre et al. 2000). The<br />
salt-marsh vegetation itself supports a wide variety of animals (Heydemann 1960; 1962;<br />
Adam 1990), many of which are restricted to saline habitats (e.g. Doody 1992; Pétillon et al.<br />
2008). Salt-marshes are considered particularly important for migratory birds and waterfowl,<br />
which depend on these habitats for food and roosting sites (see e.g. Rowcliffe et al. 1995;<br />
Zedler & Callaway 1999; van der Wal et al. 2000; Dierschke & Bairlein 2004).<br />
Natural succession in salt-marshes tends to lead to a monospecific vegetation,<br />
dominated by late-successional plant species (e.g. Adam 2002), such as Elymus athericus<br />
which is spreading all over European salt-marshes (van Wijnen et al. 1997). Moreover,<br />
Elymus species have invaded lower salt-marsh communities at several sites (Bakker et al.<br />
1997a). At some of these sites (e.g. Schiermonnikoog, the Netherlands) they even occur<br />
below the mean high water (MHW) level. Expansion of Elymus athericus leads to a decrease<br />
of the diversity and richness of both vegetation (Roozen & Westhoff 1985; Bakker 1989;<br />
Andresen et al. 1990; Leendertse 1995; Bakker 1998; Bos et al. 2002; Kleyer et al. 2003;<br />
Bouchard et al. 2003) and fauna (Pétillon et al. 2005). It has been shown that following<br />
abandonment Elymus athericus build up dense stands with low plant species diversity (e.g.<br />
Bakker et al. 1997a). The expansion of Elymus leads to a decrease in plant (and animal)<br />
diversity in the absence of grazing (Kleyer et al. 2003). These invasions may also reduce salt-<br />
marsh functions, such as the export of organic matter towards marine systems (Valéry et al.<br />
2004) and their role as a fish nursery ground (Laffaille et al. 2005).
In this context, the use of management practices for maintaining young salt-marsh<br />
stages and reducing late-successional stages have been recommended and are being applied in<br />
many sites. It has been shown that cattle grazing could hamper the expansion of Elymus<br />
athericus consequently increasing the species diversity (e.g. Olff et al. 1997; Kleyer et al.<br />
2003). Moreover, higher stocking rates were shown to be better suited to conserve plant<br />
diversity and richness in areas in which Elymus athericus was dominant (Bakker et al. 2003;<br />
Kleyer et al. 2003). In contrast, high intensity grazing is known for its deleterious effects for<br />
both animal (Laffaille et al. 2000; Pétillon et al. 2007) and plant conservation (Bouchard et al.<br />
2003). Forage quality is also important as it has been reported that high quality patches attract<br />
more birds (Olff et al. 1997; Piedboeuf & Gauthier 1999; Bos et al. 2005) increasing the<br />
importance of such salt-marsh vegetations as a feeding ground for migratory birds (cf.<br />
Laffaille et al. 2000). For example, wild-ranging Brent Geese preferred the plots with the<br />
highest nitrogen content, and declining forage quality due to changing vegetation composition<br />
and structure during succession decreased the number of birds present (Olff et al. 1997).<br />
Moreover, difference in nutritional quality of forage between marshes is likely to have had<br />
consequences for goose fitness, and may have contributed to the reported declines in gosling<br />
survivorship and size (Ngai & Jefferies 2004). Forage quality of salt-marsh species could be<br />
influenced by grazing of large herbivores (cattle or sheep). Indeed, the effect of large<br />
herbivore grazing on forage quality in terrestrial habitats has been proven (e.g. Pavlů et al.<br />
2006). Nevertheless, until now no study directly targeting the effect of large herbivore grazing<br />
on forage quality in salt-marsh habitat has been identified. All studies were related to the<br />
influence of forage quality on herbivore behaviour, particularly geese (e.g. Olff et al. 1997).<br />
Previous studies on grazing of salt-marshes mainly dealt with the impact of cattle<br />
grazing on the composition, structure and the productivity of salt-marsh vegetation (e.g.<br />
Bakker 1989; Andresen et al. 1990; Esselink et al. 2002). Therefore, little information is<br />
79
available on the influence of sheep grazing (e.g. Tessier et al. 2003). Here, we explore the<br />
impacts of low-stock sheep grazing on salt-marsh vegetation, by considering two main target<br />
variables: species richness (as an index of conservation value) and total and individual species<br />
cover (as an indicator of successional state). As herbivores impact plant species differently,<br />
according to their quality and availability, we also considered the effect of grazing on both<br />
plant biomass and forage quality. We hypothesized that sheep grazing should enhance species<br />
richness and decrease the cover of late-successional species (mainly Elymus athericus), and<br />
that these patterns can be explained by changes in biomass and forage quality. In order to<br />
encompass salt-marsh heterogeneity, this hypothesis was tested in three salt-marsh zones, as<br />
well as in a transitional zone between salt-marsh and Marram sand dune (hereafter called<br />
floodmark zone), all within the same study area.<br />
4.3 Material and methods<br />
4.3.1 Study area<br />
80<br />
The study area, which corresponds to the grazed part of the nature reserve the<br />
IJzermonding, consists of 16ha of tidal marsh. On the right bank of the IJzer (a Flemish nature<br />
reserve owned and managed by the Agency of Nature and Forest of the Flemish Community),<br />
large-scale restoration initiatives were taken to create or restore ecological gradients in a<br />
contact zone between an estuary and coastal dunes. Restoration works took place during a<br />
five-year period from 1999 to 2003. A dike was constructed in 2001 and Ammophila arenaria<br />
was planted in 2002. Since the early nineties, a small herd of sheep has been grazing part of<br />
the dune area with the general aim to maintain a low grassland sward, and to avoid<br />
ruderalisation of dune grassland. From 2005 onwards, sheep have also been grazing the tidal<br />
marshes and the rest of the dune area, to maintain a pioneer stage and a species rich saline<br />
grassland through selective grazing on more competitive species, such as Elymus athericus
and Phragmites australis, and to maintain species rich, low sward dune grassland (Hoffmann<br />
et al. 2006c). The developing salt-marsh vegetation has a high potential as a feeding area for<br />
overwintering birds (Hoffmann et al. 2005), which is one of the reasons for investigating the<br />
forage quality of its vegetation.<br />
4.3.2 Methods<br />
Five sites (in four zones) were selected in 2004 before the start of the growing season,<br />
three in salt-marsh habitat in three different elevational zones (low, intermediate and high)<br />
and two in the floodmark zone with respect to dominant plant species. Each site was 27m ×<br />
12m large, half of which (27m × 6m) was excluded from grazing (hereafter referred to as<br />
exclosures), while the other half was accessible to sheep (hereafter referred to as enclosures).<br />
In this way, we were able to follow vegetation succession with and without grazing during<br />
three consecutive years (2005-2007). The study area is grazed with a flock density of ca. 1<br />
sheep/ha salt-marsh from mid-August to mid-June. Salt-marsh sites were dominated by<br />
Salicornia europaea and Suaeda maritima in the low zone, by Elymus athericus in the high<br />
zone and by Limonium vulgare and Puccinellia maritima in the intermediate zone. In the<br />
transitional zone, site vegetation was dominated in one site by Calamagrostis epigejos,<br />
Agrostis stolonifera and Erigeron canadensis, and Trifolium spp. Erigeron canadensis and<br />
Sedum acre dominated the other site. In each zone in salt-marsh habitats 10 plots (2m × 2m)<br />
were established: 5 in exclosures and 5 in enclosures. In addition, 10 plots were established in<br />
the two transitional sites. In all plots, the Londo-scale was used to estimate cover data at the<br />
end of the growing season (mid-August) in 2005 and 2007.<br />
4.3.3 Forage quality<br />
During 2005, the biomasses of the four zones were sampled on a monthly basis in both<br />
exclosures and enclosures. Since these data did not show much variation between 2<br />
81
consecutive months, sampling efforts were lowered and in the period of 2007 the same sites<br />
were sampled on a two-monthly basis up to the beginning of winter 2007. Vegetation<br />
sampling started in May 2005, while grazing started in mid-August 2005. The data collected<br />
during May, June and July was used to compare enclosure and exclosure plots before the<br />
beginning of grazing.<br />
82<br />
In each biomass sampling session, every exclosure and enclosure area was sampled,<br />
taking 5 replicas in each zone. In doing so, for 5 exclosures and 5 enclosures in four zones, a<br />
total of 40 plots were taken per sampling session in the whole area. To avoid sampling the<br />
same plots in consecutive sampling sessions, a systematic sampling technique, was used<br />
where the sampling positions are selected at regular intervals along parallel transects at equal<br />
distances ('t Mannetje 2000; Fig. 4.1). Finally the wet biomass in each plot per year (in<br />
exclosure and enclosure) was calculated by a summation of all biomass divided by the<br />
number taken in sessions.<br />
In every plot all available above-ground biomass within a 50cm × 50cm quadrate was<br />
cut off using a pair of garden shears (making a total of 1516 quadrates from 2005 until 2007).<br />
The gathered material was packed in labelled paper bags and transported to the lab where<br />
every sample was divided into several subsamples at species level. Afterwards the subsamples<br />
were dried at 65°C during a 48 hour period, making them ready to estimate forage quality<br />
parameters.<br />
The subsamples with a dry mass of at least 5gr were ground through a 0.8mm screen.<br />
Afterwards the following forage quality parameters were determined using a Near- Infrared<br />
Spectroscopy procedure (NIRS) (cf. Birth & Hecht 1987): percentage of Crude Protein (CP),<br />
Neutral Detergent Fibre (NDF) and Acid Detergent Fibre (ADF). A calibration line to<br />
interpret the NIRS results was constructed, using wet analyses of 10% of the samples; CP% of<br />
the samples was determined using the Kjeldahl technique (AOAC 1990), NDF% was
determined based on the van Soest and Wine (1968) procedure. Cell walls were analysed<br />
using an ANKOM-220 fibre analyzer (ANKOM Technol. Crop. Fairport, NY) apparatus<br />
using the method described by van Soest et al. (1991; 1994) by sequentially adding neutral<br />
detergent (for NDF) and acid detergent (for ADF).<br />
Fig. 4.1. Sampling method of the exclosures and enclosures: letters A, B, C, D and E indicate the<br />
location of the replicas; boxes represent the cut 50cm × 50cm quadrates and the labels t1, t2… indicate<br />
the sampling session (e.g. every quadrate with label t1 was cut in the first session).<br />
4.3.4 Data analysis<br />
Community composition was assessed by a detrended correspondence analysis (DCA),<br />
using CANOCO for windows 4.5 (Lepš & Šmilauer 2005). Since axes 1 (eigenvalue = 0.98)<br />
and 2 (eigenvalue = 0.58) explained a large proportion of the variation, only scores on the first<br />
two axes were used as a measure for plant community species composition. The scores on<br />
DCA-1, DCA-2, total cover, species richness and the cover of dominant salt-marsh species<br />
were transformed into log10(x+1) to meet the normal distribution. Consecutively, the scores<br />
on DCA-1, DCA-2, total cover, species richness and the cover of dominant salt-marsh species<br />
were compared between grazed and ungrazed plots using repeated measurements General<br />
Linear Models (GLM) with grazing as a between-subject factor and year as a within-subject<br />
83
factor was applied. In case of significant interaction between grazing and year, parameters<br />
were tested year by year using the t-test. The impact of grazing is expected to be put into<br />
evidence by a significant interaction between year and grazing factor, i.e. no impact of<br />
grazing at the beginning of experiment in 2005, and significant impact two years later (2007).<br />
84<br />
Biomass and forage quality parameters collected in May, June and July 2005 were<br />
compared by t-tests between exclosure and enclosure areas as a basal point (in case no<br />
significant difference was shown between exclosure and enclosure areas, grazed and ungrazed<br />
sampling started at the same plots, half of them with grazing and half of them without<br />
grazing).<br />
The data collected from August 2005 until November 2007 was used to detect the<br />
influence of sheep grazing on biomass and forage quality parameters. Repeated measurement<br />
GLM was used to compare the biomass and forage quality parameters between grazed and<br />
ungrazed plots with grazing as the between-subject factor and year as the within-subject<br />
factor. The impact of grazing is expected to have a non significant effect of both the<br />
interaction between year and the year factor combined with a significant effect on the grazing<br />
factor, i.e. significant impact of grazing at the end of 2005 as well as two years later.<br />
In all cases, the data were transformed into log10(x+1). Finally, GLM and LSD were<br />
also used to compare the forage quality parameters among different salt-marsh species.<br />
4.4 Results<br />
4.4.1 The effect of grazing on species richness, total cover and plant community<br />
composition<br />
Grazing had a positive influence on species richness in the high zone (Table 4.1, Fig.<br />
4.1A). Species richness did not show a significant difference in 2005 between grazed and<br />
ungrazed areas while a significant difference was detected in 2007 (t= 8.99, df= 4 and
p
Table 4.1. The result of repeated measurements to study the effect of grazing on species richness, total<br />
cover, composition and dominant individual species cover.<br />
Year Grazing Grazing × Year<br />
Vegetation parameter Zone<br />
df F p-value df F p -value df F p -value<br />
Species richness ( per Floodmark 1 0.77 0.40 1 0.08 0.78 1 12.55 0.00<br />
4m²) High 1 38.54 0.00 1 0.43 0.53 1 7.43 0.02<br />
Intermediate 1 1.67 0.23 1 0.03 0.87 1 0.66 0.43<br />
Low 1 4.08 0.05 1 0.17 0.67 1 0.81 0.37<br />
Total cover (%) Floodmark 1 13.77 0.00 1 0.01 0.95 1 0.52 0.48<br />
High 1 10.46 0.01 1 1.79 0.22 1 0.83 0.38<br />
Intermediate 1 22.67 0.00 1 2.09 0.19 1 1.25 0.29<br />
Low 1 0.04 0.85 1 0.96 0.35 1 0.54 0.48<br />
DCA1 Floodmark 1 5.29 0.05 1 0.15 0.70 1 0.73 0.41<br />
High 1 7.33 0.40 1 1.04 0.33 1 0.40 0.54<br />
Intermediate 1 0.18 0.67 1 1.62 0.23 1 2.11 0.18<br />
Low 1 164.90 0.00 1 1.69 0.22 1 0.48 0.50<br />
DCA2 Floodmark 1 0.14 0.71 1 1.32 0.28 1 0.48 0.50<br />
High 1 3.42 0.10 1 0.33 0.57 1 0.81 0.39<br />
Intermediate 1 7.24 0.02 1 0.02 0.88 1 11.62 0.00<br />
Low 1 21.25 0.00 1 1.26 0.29 1 1.19 0.31<br />
Elymus athericus High 1 3.60 0.05 1 0.11 0.75 1 0.81 0.39<br />
Limonium vulgare Intermediate 1 1.01 0.34 1 1.20 0.30 1 1.64 0.23<br />
Salicornia europaea Low 1 13.14 0.00 1 0.92 0.36 1 0.01 0.91<br />
86
Species richness<br />
Total cover(%)<br />
1.6<br />
1.4<br />
1.2<br />
1<br />
0.8<br />
0.6<br />
0.4<br />
0.2<br />
0<br />
2.5<br />
2<br />
1.5<br />
1<br />
0.5<br />
0<br />
A<br />
a a a<br />
b<br />
a a<br />
Floodmark zone High zone Intermediate<br />
zone<br />
B<br />
a<br />
b<br />
a<br />
a<br />
b<br />
a<br />
a<br />
a<br />
b a<br />
a<br />
a<br />
a<br />
b<br />
b<br />
Low zone<br />
2005<br />
2007<br />
Floodmark zone High zone Intermediate zone Low zone<br />
b<br />
a<br />
a<br />
2005 grazed<br />
2005 ungrazed<br />
2007 grazed<br />
2007 ungrazed<br />
87
88<br />
Cover(%)<br />
2.5<br />
2<br />
1.5<br />
1<br />
0.5<br />
0<br />
C<br />
a<br />
b<br />
a<br />
a a<br />
2005<br />
2007<br />
Elymus athericus Limonium vulgare Salicornia europaea<br />
Fig. 4.1. Changes in species richness (A), total cover (B) and dominant species cover (C) by sheep<br />
grazing and time at different zones. Different successive letters indicate significant differences (at<br />
p
Table 4.2. Comparisons between exclosure and enclosure areas at the beginning of the study for<br />
biomass and forage quality parameters (the data collected during May, June and July 2005 were used).<br />
Quality parameters and Biomass Zone df t p-value<br />
Biomass (gr) Floodmark 8 1.46 0.65<br />
High 8 -2.02 0.08<br />
Intermediate 8 -0.45 0.66<br />
Low 8 1.27 0.23<br />
CP (%) Floodmark 8 1.63 0.16<br />
High 8 1.78 0.13<br />
Intermediate 8 1.45 0.20<br />
Low 8 -0.25 0.81<br />
NDF (%) Floodmark 8 -0.16 0.87<br />
High 8 -1.40 0.22<br />
Intermediate 8 -0.89 0.40<br />
Low 8 0.78 0.45<br />
ADF (%) Floodmark 8 -0.52 0.62<br />
High 8 -1.42 0.21<br />
Intermediate 8 -1.74 0.14<br />
Low 8 1.99 0.10<br />
Table 4.3. The results of repeated measurements on the effect of sheep grazing on biomass and forage<br />
quality parameters.<br />
Biomass and<br />
Year Grazing Grazing × Year<br />
quality parameters Zone<br />
df F p-value df F p-value df F p-value<br />
Biomass (gr) Floodmark 1 11.72 0.00 1 0.14 0.71 1 0.29 0.60<br />
High zone 1 0.50 0.83 1 0.01 0.92 1 3.13 0.11<br />
Intermediate zone 1 14.37 0.00 1 3.57 0.09 1 0.98 0.35<br />
Low zone 1 3.26 0.12 1 0.33 0.01 1 0.01 0.29<br />
CP (%) Floodmark 1 33.43 0.00 1 0.38 0.55 1 3.28 0.12<br />
High zone 1 14.21 0.00 1 4.80 0.07 1 0.71 0.43<br />
Intermediate zone 1 17.53 0.00 1 0.06 0.82 1 7.33 0.09<br />
Low zone 1 5.15 0.05 1 100.9 0.00 1 0.37 0.56<br />
NDF (%) Floodmark 1 2.88 0.14 1 1.72 0.23 1 0.19 0.67<br />
High zone 1 3.13 0.13 1 2.36 0.17 1 0.08 0.80<br />
Intermediate zone 1 16.01 0.00 1 0.15 0.71 1 0.11 0.74<br />
Low zone 1 0.40 0.54 1 13.13 0.07 1 0.68 0.43<br />
ADF (%) Floodmark 1 10.32 0.02 1 0.44 0.52 1 0.00 0.94<br />
High zone 1 62.54 0.00 1 1.20 0.31 1 0.06 0.80<br />
Intermediate zone 1 22.03 0.00 1 0.99 0.34 1 0.29 0.60<br />
Low zone 1 0.60 0.46 1 105.2 0.00 1 1.26 0.29<br />
89
90<br />
2.5<br />
2<br />
1.5<br />
1<br />
0.5<br />
0<br />
a<br />
b<br />
a<br />
b<br />
Grazed<br />
Ungrazed<br />
Biomass(gr) CP% NDF% ADF%<br />
Fig. 4.2. The effect of sheep grazing on biomass and quality parameters in the low zone dominated by<br />
Salicornia europaea. Different successive letters indicate significant differences (at p
4.5 Discussion<br />
The results show that sheep grazing has a positive effect on species richness in the<br />
Elymus athericus-dominated zone: whereas the species richness decreased in ungrazed plots,<br />
it remained high in the grazed plots. As sheep grazing does not appear to have an effect on the<br />
cover and biomass of Elymus athericus, it is likely that sheep increase the plant richness by<br />
trampling and creating small gaps or by dispersing seeds to the Elymus athericus zone rather<br />
than by grazing. Indeed sheep packing closely together in the high zone when the tide came in<br />
was often observed. Sheep are more selective than cattle in grazing (Hafer 1975; Hodgson et<br />
al. 1995) and prefer plant species which are generally short and not stemmy and have leaves<br />
of low dry matter (i.e. succulents), low tensile strength, and high crude protein content<br />
(Vallentine 2001). Our results show that Elymus athericus has the lowest quality among the<br />
(more dominant) species present. In addition, sheep prefer to graze forbs rather than grasses<br />
(Arthur et al. 2000). The decreasing species richness in the floodmark zone might be a result<br />
of selective grazing on some species. Selective grazing by sheep could eradicate some species<br />
from the floodmark zone. In the floodmark zone the seeds of some palatable species such as<br />
Atriplex spp. and Chenopodium spp. reach the driftline and germinate. The seedlings may be<br />
grazed by sheep intensively, consequently decreasing species richness.<br />
Species composition in our plots changed between 2005 and 2007, but sheep grazing<br />
had no apparent effect on that natural succession. In contrast, it has been proven that grazing<br />
prevents the successional changes in plant composition that would otherwise occur as a result<br />
of continuous sedimentation in natural salt-marshes (Bockelmann & Neuhaus 1999). An<br />
eight-year permanent plot study showed that successional outcomes on the permanent plots<br />
depended on grazing intensity (Kleyer et al. 2003). In some studies, herbivory by insects<br />
accelerated plant species replacement (Brown 1990) whereas in others it retarded succession<br />
(Brown 1990; Davidson 1993). In addition, the cessation of grazing allows an accelerated<br />
91
succession leading to rapid vegetation change (Kiehl et al. 1996). Our results might be<br />
attributed to the short time period of the study; differences may not be visible yet after only<br />
three years of grazing. In previous studies, the areas were grazed for longer periods, e.g. 5<br />
years in the Kiehl et al. (1996) study, 6 years in the Jensen (1985) study and even longer in<br />
other studies (e.g. Bouchard et al. 2003).<br />
92<br />
Sheep grazing also had no significant effect on common species cover. Previous studies,<br />
however, showed that grazing could have a significant influence on cover of these species.<br />
Tessier et al. (2003) and Jensen (1985) found that in grazed conditions, vegetation was<br />
dominated by a short Puccinellia maritima stand in the lower and middle marshes.<br />
Concerning the response of annual species to grazing, results differ between investigations.<br />
According to Jensen (1985) and Kiehl et al. (1996), grazing largely promoted Salicornia<br />
europaea due to the creation of open space for seedling establishment, but it also damaged<br />
plants as a result of trampling. In contrast, Tessier et al. (2003) showed that the cover of<br />
Salicornia europaea was higher after cessation of grazing.<br />
In contrast to our results, in which total cover was not influenced by grazing, Jensen<br />
(1985) showed that six years without grazing caused a marked increase in total cover and a<br />
dramatic reduction of the amount of bare ground while total cover did not change in the<br />
grazed area. The short duration and low pressure of grazing (ca. 1 sheep/ha) in the<br />
IJzermonding area could explain the different outcomes.<br />
In general, grazing causes rapid turnover of plant material as plants produce fresh new<br />
leaves or tillers of a higher quality compared to the old leaves and reduces the standing dead<br />
and litter biomass (Fox et al. 1998; Mayhew & Houston 1999). Defoliation by intensive<br />
grazing is a method of improving or prolonging forage quality and palatability by delaying<br />
maturity, removal of old growth and stimulating re-growth (Valentine 2001). It seems that in<br />
this study late grazing periods (from August onwards) could not stimulate the re-growth of
species and refresh leaves and stems leading to higher quality. In this study, we observed<br />
either no effect on forage quality (intermediate, high and floodmark zone) or the reverse effect<br />
in the Salicornia-dominated zone, where the quality is lowered by grazing. To increase the<br />
forage quality, grazing would need to begin earlier in the growing season when the period of<br />
spring and early summer growth is not yet finished. For instance, Salicornia is not showing<br />
any re-growth anymore near the end of the growing season in August, when sheep are<br />
introduced in the area. A higher stocking rate might further increase general forage quality.<br />
Indeed, in the model developed by Hutchings & Gordon (2001), and the field data gathered by<br />
Arnold (1964), sheep have lower performance at low stocking rates as the probability of<br />
encountering previously grazed stands is lower under these circumstances. It was found that<br />
animals (birds) at higher densities keep the plants in a high quality by repeated defoliation and<br />
thus facilitate each other (Bos et al. 2002). A higher forage quality could be of management<br />
importance for two reasons: herbivorous, macrophyte eating bird species (like several duck<br />
and goose species) might profit from a higher forage quality, while general sheep<br />
performance would be higher as well. In that case, it can be recommended to the manager that<br />
the intensity of grazing should be increased and start earlier in the season. The results on<br />
biomass show that sheep graze more in the lower zones. In the low zone, sheep were grazing<br />
ca. 13% of primary production. Using 50:50 (take half and leave half) rule of Heady and<br />
Child (1994) suggests that intensity of grazing should increase three folds. Milotic et al.<br />
(2008) calculated that the grazing capacity of the study site, according to total available<br />
digestible energy, varies between 15 ewes in winter and ca. 60 ewes in summer.<br />
As shown here and elsewhere unhampered natural succession in new salt-marsh leads to<br />
a dominance of clonal species such as Elymus athericus, eventually leading to a monospecific<br />
vegetation with a low animal diversity (e.g. Leendertse 1995). On the other hand, previous<br />
studies showed that cattle grazing could prevent the massive expansion of Elymus athericus<br />
93
(van Wijnen et al. 1997). In addition, Schröder et al. (2002) showed that the cessation of<br />
sheep grazing enhanced the cover of the latter grass species. Therefore, the introduction of<br />
grazing to the salt-marsh seems to be a useful management tool to control the expansion of<br />
Elymus athericus and to increase plant and animal diversity. To eliminate the expansion of<br />
Elymus athericus, it is recommended to increase the intensity of grazing. Grazing intensity<br />
should be increased rather by cattle or mixed grazing (cattle and sheep). The increasing<br />
grazing intensity by sheep alone is expected to concentrate on other species that have a higher<br />
forage quality.<br />
4.6 Conclusion<br />
94<br />
A period of three years grazing with low intensity had different effects on different<br />
zones. Although the highest intensity of grazing occurs on the more succulent and protein rich<br />
plants of the lower zone, species richness was also decreased by grazing in the floodmark<br />
zone indicating the attractiveness of this zone for sheep. Indeed, the risk of over-grazing in the<br />
floodmark and other zones should be taken into account before making the decision to<br />
increase sheep number.
Chapter 5 Environmentally determined spatial patterns of<br />
annual plants in early salt-marsh succession versus<br />
stochastic distribution in old salt-marsh conditions 4<br />
<strong>Erfanzadeh</strong> R., Pétillon J., Maelfait J.-P. & Hoffmann M.<br />
4 This chapter was submitted for publication in Belgian Journal of Botany on 21 th of January <strong>2009</strong>.<br />
Field data were sampled by the first author
5.1 Abstract<br />
96<br />
It is generally accepted that in terrestrial ecosystems the occurrence and abundance of<br />
plant species in late succession stages can be well predicted from prevailing soil conditions<br />
whereas in early succession their presence is much more influenced by chance events (e.g.<br />
propagule availability). In other words late successional vegetation stages would be<br />
deterministically structured, while early succession stages would be of a more stochastic<br />
nature.<br />
To test this hypothesis, we compared the effect of abiotic environmental factors on<br />
vegetation composition and probability of occurrence of single species in two adjacent salt-<br />
marshes, differing in age (successional stage). A new salt-marsh of about 14ha was created in<br />
2002 by removing a several meters thick layer of sand and slurry which was deposited on the<br />
major part of the salt-marsh along the IJzer estuary in the 1960s. From 2002 onwards, primary<br />
colonization started on that sterile substrate by hydrochoric seed dispersal, induced by tidal<br />
water currents from an adjacent 4ha old salt-marsh and the latter remained untouched as salt-<br />
marsh for more than two hundred years. Between mid August and the end of September 2005,<br />
three years after the start of the colonization in the new salt-marsh, vegetation and three<br />
abiotic environmental factors (soil texture, salinity and elevation) were described in a set of<br />
155 plots (2m × 2m), distributed over the new and the old salt-marsh.<br />
In contrast to the general rule for terrestrial ecosystems, the vegetation composition of<br />
the early succession stage of the new salt-marsh appears to be at least as much determined by<br />
the combined effect of the measured abiotic factors as that of the old salt-marsh. As revealed<br />
by logistic regression the presence/absence of perennial species as well as annual species of<br />
the young salt-marsh can be well predicted by the measured abiotic environment. For the old<br />
salt-marsh, this also holds for the perennials, but not for the annuals. The stochastic
appearance of gaps in the perennial vegetation cover appears to be important for the<br />
establishment of annuals in the older salt-marsh.<br />
Key words: Early and late successional stages, Soil characteristics, Salt-marsh, Succession<br />
97
5.2 Introduction<br />
98<br />
One of the main aims of plant ecology is trying to understand the causes for patterns in<br />
plant distribution. Plants that persist in any particular site must be in equilibrium with their<br />
environment (Burrows 1990). In salt-marsh habitat, the spatial distribution of individual<br />
species is usually linked to the concept of succession, i.e. the replacement of plant species in<br />
an orderly sequence by colonization and population development (Clements 1916; Odum<br />
1969; Chapman 1976; Glenn-Lewin et al. 1992). It is assumed that, on emerging salt-marshes,<br />
after an initial colonization phase, the substrate becomes more stable and sediments are<br />
trapped by the vegetation. This will lead to a change in topography, decreasing the inundation<br />
frequency with salt water, and allowing other species to colonize the marsh which would<br />
eventually result in a mature and stable climax ecosystem (Odum 1971). However, the<br />
dynamic of salt-marsh vegetation does not always seem to follow a deterministic succession<br />
scheme and many other (stochastic) factors influence it (de Leeuw et al. 1993). Salt-marsh<br />
vegetation dynamics can therefore be considered to be quite complex and the spatial and<br />
temporal patterns of halophytes and their interactions with multiple biotic and abiotic factors<br />
in their own environment remain largely unknown (Silvestri & Marani 2004). To elucidate the<br />
underlying reasons for species distribution in salt-marshes, most investigators have relied on<br />
correlations between plant distributions and soil properties (e.g. Gray & Bunce 1972). An<br />
important inference of this approach is that the set of physical conditions associated with each<br />
species represents the preferred or optimal habitat of that species (Vince & Snow 1984).<br />
Chance events or historical factors, such as variation in the weather, disturbance<br />
intensity, colonization potential and seed availability are generally considered to be more<br />
important in determining spatial patterns and temporal changes at early succession stages,<br />
whereas the importance of site characteristics, such as soil factors, usually increases with<br />
succession age. This generalisation has been proven valid for several terrestrial habitats
(Christensen & Peet 1984; McClanaham 1986; Tsuyuzaki 1989; McLendon & Redente 1990;<br />
Myster & Picket 1990; Leps & Rejmannek 1991; Leps et al. 2000). Therefore, it can be<br />
expected that the relationship between environmental factors and vegetation distribution is<br />
stronger in older stages of succession than at the start of it. Hence, the predictability of<br />
occurrence of a species using soil factors is expected to be higher in old stages than in initial<br />
stages.<br />
The aim of this study was to compare the relative influence of abiotic environmental<br />
factors on the vegetation composition and on the probability of occurrence of individual<br />
species between a young and an old salt-marsh. An unique opportunity to test this was<br />
brought by a large-scale nature restoration project along the Belgian coast, that led to the<br />
creation of a new salt-marsh adjacent to an old one. Abiotic environmental factors considered<br />
for the present study were soil salinity (estimated by electric conductivity), sediment texture<br />
and elevation (as a surrogate factor for inundation frequency: Hoffmann et al. 2006c).<br />
The hypothesis we test here is that there would be less correlation between abiotic<br />
environmental factors and vegetation distribution in the new salt-marsh, since here<br />
colonization potential and stochastic factors are expected to be dominant over environmental<br />
differentiation (Leps et al. 2000), while this correlation is expected to be higher in the old salt<br />
mash, where time has allowed all locations to be potentially colonized by all halophyte<br />
diaspores present in the area.<br />
5.3 Material and Methods<br />
5.3.1 Study area and vegetation<br />
The study was conducted in the estuary of the river IJzer, situated along the Belgian<br />
coast. After a large-scale nature restoration project, in which large amounts of sand and slurry<br />
were removed between 1999 and 2002, primary succession on the newly created intertidal<br />
99
area started in 2002, when part of the newly created marsh was already suitable for<br />
colonization. The surface of the new salt-marsh is approximately 14ha (Hoffmann 2006b).<br />
During our survey, dominant plant species were Salicornia europaea (total cover about 12%)<br />
and Suaeda maritima (11%).<br />
100<br />
Adjacent to the developing salt-marsh, lays an old salt-marsh of ca. 4ha that remained<br />
intact for centuries (see Hoffmann et al. 1996, 2006a for an overview of consecutive<br />
topographic maps; the earliest cartographic evidence dates from 1779 on the De Ferraris<br />
maps). Dominant plant species were Elymus athericus (average cover about 35%), Limonium<br />
vulgare (7.5%). Between mid August and the end of September 2005, three years after the<br />
start of the succession in the new salt-marsh, vegetation composition was estimated in a large<br />
set of permanent plots, each 2m × 2m large in both new and old salt-marshes. Plant species<br />
cover was estimated using the decimal scale for permanent quadrates developed by Londo<br />
(1976). In total, 155 relevés were sampled: 95 in the newly created salt-marsh and 60 relevés<br />
in the old salt-marsh.<br />
In each relevé, three soil samples of the upper 5cm layer were collected. The three soil<br />
samples were pooled per plot and transferred to the laboratory for chemical analyses.<br />
The elevation of relevés was measured using a 'total station' (Leica TC1600). The<br />
reference used is the Belgian Lambert '72 projection for x-y and 'Tweede Algemene<br />
Waterpassing' (T.A.W.) for elevation. Reference points from the NGI (National Geographical<br />
Institute) that were present in the neighbourhood were used as a starting point for the<br />
measurements.<br />
5.3.2 Soil analysis<br />
After shaking 5gr of soil in 50mm distilled water for two hours, the electric conductivity<br />
(EC) was measured with a WTW Inolab EC meter level 1. Soil texture was determined with a<br />
Coulter LS Particle Size Analyzer. The instrument calculated mean, median, and the
percentages of particle diameter of more than 16 and 63µm of each sample. As the correlation<br />
among these particle percentages was very high and previous studies used the median particle<br />
size in their research (Langlois et al. 2003; Jigorel 2000), we also used the median particle<br />
size (D50) as main soil texture characteristic.<br />
5.3.3 Data analysis<br />
First, a detrended correspondence analysis (DCA) with Hill’s scaling was carried out to<br />
calculate the length of the axis for old and new salt-marsh separately. As the length of the<br />
gradient was more than 5 in both new and old salt-marshes (6.26 and 5.09, respectively),<br />
unimodal constrained methods were further used. Canonical correspondence analysis (CCA)<br />
was used for both kinds of salt-marshes separately. CCA enables an evaluation of the relative<br />
influence of the environment on the composition of the community and provides a<br />
distribution-free Monte Carlo test of significance (Pyšek & Lepš 1991). In all analyses, the<br />
number of permutations was 499 and centring by species and no standardization by samples<br />
was chosen as options. After the CCA analysis, the conditional and marginal effects were<br />
estimated (Lepš & Smilauer 2003), a procedure that enables attributing the explained<br />
variability to particular variables. Both edaphic factors and elevation were introduced as<br />
explanatory variables. These analyses were done using CANOCO for Windows (ter Braak &<br />
Smilauer 1998).<br />
The probability of occurrence (absence-presence) of the more prominent species<br />
(Packham & Willis 1997) common in both old and new salt-marshes (Salicornia europaea,<br />
Suaeda maritima, Spergularia spp., Limonium vulgare, Puccinellia maritima and Elymus<br />
athericus) was correlated with the environmental variables using forward stepwise binary<br />
logistic regression (Hosmer & Lemeshow 2000). Spearman’s coefficient was used to test the<br />
correlation among independent variables. As the correlation among independent variables was<br />
101
high and highly significant (see Table 5.1), the environmental variables were introduced to<br />
PCA and the scores of PCA1, PCA2 and PCA3 were used as independent variables.<br />
Table 5.1. Correlation among environmental variables in the new (first row) and old (second row)<br />
salt-marshes.<br />
Environmental variables EC (µs/cm) Elevation (m) Texture (µm)<br />
EC (µs/cm) __<br />
-0.67** -0.51**<br />
-0.34** -0.86**<br />
Elevation (m) __ __<br />
0.52**<br />
0.31*<br />
5.4 Results<br />
5.4.1 Composition and environmental factors<br />
102<br />
A high value of species-environment correlation on the first axis in CCA revealed that<br />
the three variables are main determinants of species variation in our data set in both new and<br />
old salt-marshes (Table 5.2; the same trend was observed by DCA).<br />
Table 5.2. The results of CCA in the new and old salt-marshes.<br />
Salt-marsh Axes 1 2 3 4<br />
New<br />
Eigenvalues 0.74 0.17 0.11<br />
Species-environment correlation 0.93 0.60 0.45<br />
Cumulative percentage variance of species data 9.50 11.60 13.60<br />
Cumulative percentage<br />
environment relation<br />
variance of species – 72.50 88.80 100.00<br />
Old<br />
Sum of all eigenvalues 7.79<br />
Sum of all canonical eigenvalues 1.10<br />
Eigenvalues 0.64 0.23 0.11<br />
Species-environment correlation 0.85 0.66 0.46<br />
Cumulative percentage variance of species data 17.50 19.80 22.20<br />
Cumulative percentage variance of species –<br />
environment relation<br />
65.60 89.30 100.00<br />
Sum of all eigenvalues 4.40<br />
Sum of all canonical eigenvalues 0.98
0.8<br />
Axis 2<br />
-0.6<br />
1.0<br />
Axis 2<br />
EC<br />
A<br />
Parastri<br />
Agrostol<br />
Salieuro Atrilitt<br />
Puccmari<br />
Saliproc<br />
PlancoroCarearen<br />
Atripros<br />
Erigcana<br />
Suaemari<br />
Elymathe Seduacre<br />
Spermari Poaannu<br />
Cirsarve<br />
Salskali<br />
Texture<br />
Holclana<br />
Elevation<br />
-1.0 Axis 1<br />
1.5<br />
B<br />
Elevation<br />
Astetrip<br />
Trigmari<br />
Puccmari<br />
Limovulg<br />
Elymathe<br />
Suaemari<br />
Spermedi<br />
Spermari<br />
Texture<br />
Salieuro<br />
Spartown<br />
Saliproc<br />
-1.5<br />
-1.0 Axis 1<br />
1.0<br />
Fig. 5.1. CCA-Ordination biplot of analysis in the new salt-marsh (A) and old salt-marsh (B) (the<br />
arrows show the environmental variables). The highest weight species were shown according to the<br />
highest cover over all the samples. (Agrostol=Agrostis stolonifera, Astetrip=Aster tripolium,<br />
Atrilitt=Atriplex littoralis, Atripros=Atriplex prosterata, Carearen=Carex arenaria, Cirsarve=Cirsium<br />
arvensis, Elymathe=Elymus athericus, Erigcana=Erigeron canadensis, Holclana=Holcus lanatus,<br />
Limovulg=Limonium vulgare, Parastri=Parapholis strigosa, Plancoro=Plantago coronopus,<br />
Poaannu=Poa annua, Puccmari=Puccinellia maritima, Salieuro=Salicornia europaea,<br />
Saliproc=Salicornia procumbens, Salskali=Salsola kali, Spartown=Spartina townsendii,<br />
Spermari=Spergularia marina, Spermedi=Spergularia media, Suaemari=Suaeda maritima,<br />
Trigmari=Triglochin maritimum).<br />
EC<br />
103
104<br />
Although the percentage of species variance explained by the environmental variables<br />
was higher in the old than in the new salt-marsh (17.5% compared to 9.5%), the<br />
environmental variables had a significant effect on composition distribution in both old and<br />
new salt-marshes (Table 5.3; Fig. 5.1). Nevertheless, the effect of EC was not significant in<br />
the old salt-marsh contrary to the new salt-marsh.<br />
Table 5.3. Marginal and conditional effects obtained from the summary of forward selection in new<br />
and old salt-marsh.<br />
Salt-marsh Environmental<br />
variables<br />
Marginal effects Conditional effects<br />
Lambda Lambda p-value F<br />
New<br />
Old<br />
Elevation (m) 0.70 0.70 0.00 9.12<br />
EC (µs/cm) 0.56 0.19 0.00 2.58<br />
Texture (µm) 0.30 0.13 0.02 1.69<br />
Elevation (m) 0.60 0.60 0.00 9.14<br />
EC (µs/cm) 0.20 0.11 0.08 1.72<br />
Texture (µm) 0.23 0.27 0.00 4.38<br />
5.4.2 Independent variables and PCA axes<br />
For both young and old salt-marshes, PCA1 can be considered as an indicator of soil<br />
salinity and to a lesser extent texture, while PCA2 and PCA3 can be considered as indicators<br />
of texture and elevation, respectively (Table 5.4).<br />
Table 5.4. Correlation between components and environmental factors in the old and new salt-marsh.<br />
Salt-marsh Environmental variables PCA1 PCA2 PCA3<br />
New EC (µs/cm) 1.00 0.00 0.00<br />
Elevation (m) 0.02 -0.14 -0.98<br />
Texture (µm) -0.45 0.90 0.00<br />
Old EC (µs/cm) 1.00 0.00 0.00<br />
Elevation (m) 0.09 0.12 -0.99<br />
Texture (µm) -0.79 -0.62 0.00
5.4.3 The results of logistic regression<br />
Environmental variables affected the probability of species occurrence in both old and<br />
new salt-marshes at different levels. In the new salt-marsh, the occurrences of Salicornia<br />
europaea, Elyums athericus and Suaeda maritima were significantly affected by PCA1 (Table<br />
5.5). The occurrence of Spergularia marina was significantly affected by PCA2 and to a<br />
lesser extent by PCA1. The occurrence of Limonium vulgare was significantly affected by<br />
PCA3. There was no significant correlation between the occurrence of Puccinellia maritima<br />
and PCA axes.<br />
In the old salt-marsh, there was no significant correlation between the occurrences of<br />
annual species and PCA axes. There was a significant correlation between the occurrences of<br />
Elymus athericus and between Puccinellia maritima and PCA3. The occurrence of Limonium<br />
vulgare was affected by PCA2 (Table 5.5).<br />
Table 5.5. Variables in the equation calculated by logistic regression (only significant variables at the<br />
0.05- significance level are shown).<br />
Salt-marsh<br />
Species<br />
B SE Wald df Sig.<br />
New Salicornia europaea<br />
Environmental variables<br />
PCA1 2.09 0.34 38.38 1
5.5 Discussion<br />
106<br />
Not surprisingly, salinity and texture were strongly correlated with elevation. As<br />
inundation frequency is strongly correlated with elevation, elevation can be considered as a<br />
surrogate for inundation frequency (Hoffmann et al. 1996). Elevation largely determines the<br />
frequency and duration of tidal flooding (Packham & Willis 1997). It was proven that in salt-<br />
marshes with a regular inundation frequency, a range of abiotic factors vary in association<br />
with this tidal inundation, such as salinity (de Leeuw et al. 1991; Rozema & van Diggelen<br />
1991), sediment texture (Othman 1980; Thomson et al. 1991), immersion duration (Ranwell<br />
et al. 1964), soil redox potential (Armstrong et al. 1985; Groenendijk et al. 1987), disturbance<br />
in the form of burial by debris (Brewer et al. 1998) and nutrient levels ( Levine et al. 1998;<br />
van Wijnen & Bakker 1999).<br />
It appears that in our salt-marsh patches, deterministic factors are important in both<br />
early and late successional stages. This is confirmed by a highly significant correlation<br />
between species composition and abiotic conditions in both new and old salt-marshes and the<br />
significant effect of abiotic conditions on occurrences of most species in old and new salt-<br />
marshes. This is in contrast with previous studies in terrestrial habitats. Leps (2000) stated<br />
that environmental determination of plant community composition increased with<br />
successional age. He alleged that the relationship between species and the most important<br />
environmental factor, soil texture, was non-significant in the early years but significant in<br />
later years and species composition in the early stages of succession was mainly influenced by<br />
stochastic factors, i.e. seed availability. Similar observations have been made by Osbornova et<br />
al. (1990), McClanahan (1986), Tsuyuzaki (1989), McLendon & Redente (1990), Myster &<br />
Picket (1990), and Leps (1991). They showed that the availability of propagules is usually<br />
more important in early stages of succession while site characteristics are more important in<br />
late succession stages. Nevertheless, in salt-marsh habitats with a daily inundation, the
propagules disperse themselves very quickly (if the propagules exist). The power of tidal<br />
water in seed dispersal of different species between different elevations is well known (e.g.<br />
Huiskes et al. 1995; Chang et al. 2007). This dispersal by tidal current can occur in both new<br />
and old salt-marshes. In salt-marsh habitats, the effect of stochastic factors (e.g. seed<br />
availability) in distribution and patterns of species is thus less pronounced than in terrestrial<br />
habitats in the early succession stages.<br />
The composition and distribution of plant communities along the elevation gradient of a<br />
salt-marsh is related to the ability of individual species to tolerate environmental conditions.<br />
In the new salt-marsh, the distribution of almost all single species was affected by and<br />
distributed according to abiotic factors and salinity might be the most important of these<br />
factors. Indeed, Huckle et al. (2000) showed that salinity and water logging had highly<br />
significant effects on growth of some salt-marsh species. Silvestri et al. (2005) stated that at<br />
lower elevations, soil water salinity tends to increase due to progressively more frequent<br />
flooding of the marsh and associated enhanced salt inputs. Consequently, the dependence of<br />
soil salinity on elevation may thus partly explain the distribution of species along the<br />
elevation gradient. Brereton (1971) proved that salinity and water-logging affected both the<br />
distribution of species in a pioneer marsh dominated by Salicornia europaea and Puccinellia<br />
maritima.<br />
In the new salt-marsh Salicornia europaea had the highest positive correlation with EC.<br />
This confirms findings of Ungar (1998), who stated that this species was the angiosperm that<br />
was able to grow at the most extreme end of the salinity gradient. Hoffmann et al. (2006c)<br />
stated that Salicornia europaea would be replaced by Elymus athericus in the new salt-marsh<br />
because in the old salt-marsh Elymus athericus occurs at the same elevation as Salicornia<br />
europaea in the new salt-marsh. We expect, however, that the salinity level will prevent the<br />
expansion of Elymus athericus into the most silty and most saline parts of the Salicornia<br />
107
europaea zone as long as the elevation level does not increase. The two species show indeed a<br />
pronounced difference in Ellenberg’s salinity index (7 for Elymus athericus versus 10 for<br />
Salicornia europaea).<br />
108<br />
Suaeda maritima was comparatively less affected by salinity than Salicornia europaea.<br />
Silvestri and Marani (2004) also stated that growth of Suaeda maritima was stimulated at<br />
lower salinity levels then Salicornia europaea; the latter reached maximum biomass<br />
production and growth in more saline conditions. In the case of Suaeda maritima dominated<br />
vegetations, it is more likely that in due time, these will be invaded more and more and in the<br />
end dominated by Elymus athericus. The latter indeed shows quite similar environmental<br />
conditions to those of Suaeda maritima (Fig. 5.1) and is the more competitive species of both.<br />
In the old salt-marsh, perennial species were affected by environmental conditions but<br />
the distribution of annual species might be affected by other factors. It seems that biotic<br />
factors, particularly competition with perennial species, prevented to distribute these annuals<br />
species according to their favoured environmental conditions. Annual species in the old salt-<br />
marsh might germinate in the stochastically appearing vegetation gaps, unrelated to the<br />
abiotic factors, where competition with perennials did not prevent the colonization. Indeed,<br />
seed germination, cover and biomass of annuals were shown to increase after removal of<br />
perennials (Elisson 1987; Gray & Scott 1977) and in the absence of perennials (Packham &<br />
Willis 1977; Tessier et al. 2000). Bockelmann et al. (2002) stressed that plant distribution in<br />
old salt-marsh is a consequence of various interacting factors of which abiotic factors are only<br />
a part. Biotic factors like competition between species and local habitat adaptation within<br />
species are equally crucial for annual species. The fate of annual seedlings largely depends on<br />
the permeability of the perennial canopy for light. Thus, disturbance resulting in bare patches<br />
inside the perennial vegetation seemed essential for the development of annual species<br />
(Tessier et al. 2000).
5.6 Conclusion<br />
Vegetation analyses indicate that diaspores of the annual colonizing species are present<br />
ad libitum in the newly created marsh area, but that abiotic factors determine whether they<br />
can germinate and establish a local population. Environmental rather than biotic<br />
determination of appearance also holds for perennials in old salt-marsh conditions, but not so<br />
for annuals. An interesting next step in understanding vegetation succession in salt-marsh<br />
conditions is the development of models that predict the occurrence of annuals in a context of<br />
perennials. As far as expectations on vegetation development in salt-marsh restoration sites is<br />
concerned, it seems that further succession beyond a pioneer stage of Salicornia and/or<br />
Suaeda maritima dominated vegetation will depend on all three environmental variables<br />
measured in this study. The most silty, saline and frequently inundated sites might continue to<br />
be dominated by Salicornia spp. for a relatively long time; the more sandy, less saline and<br />
more elevated sites, initially dominated by Suaeda maritima, might quickly evolve into<br />
Elymus athericus dominated vegetation. The speed of this succession sere entirely depends on<br />
the diaspore dispersal capacity of the late successional species and of the evolution of the<br />
textural quality of the accreting sediments. Whether the Elymus-stage in succession would<br />
further evolve into a Phragmites australis dominated stage, as is the case in more brackish<br />
salt-marsh environments such as the mid parts of the Scheldt-estuary (Hoffmann 1993)<br />
remains an open question; within the study area, it seems a possible successional climax in the<br />
least silty, least saline environments, since at the most elevated sites of the old salt-marshes,<br />
indeed Phragmites dominates or starts to dominate the vegetation. Once secondary<br />
disturbance, like grazing, is introduced, succession pathways might change significantly, with<br />
more probable dominance of grazing-tolerant grassland vegetation, dominated by Puccinellia<br />
maritima (see chapter 4).<br />
109
110
Chapter 6 The effect of successional stage and salinity on the<br />
vertical distribution of seeds in salt-marsh soils 5<br />
<strong>Erfanzadeh</strong> R., Hendrickx F., Maelfait J.-P., Hoffmann M.<br />
5 th<br />
This chapter was submitted for publication in Flora on 11 of February <strong>2009</strong>.<br />
Field data were sampled by the first author.
6.1 Abstract<br />
112<br />
Seed bank density and similarity between seed bank and above-ground vegetation along<br />
depth were compared between two salt-marshes different in age. In addition, the effect of<br />
salinity on the variation in seed bank density and similarity between seed bank and above-<br />
ground vegetation along depth was investigated. The study was conducted in an euhaline salt-<br />
marsh that contained both old and newly created habitats. In addition, two other old salt-<br />
marshes were selected to study the effect of salinity on the distribution pattern of seed bank<br />
and similarity between seed bank and above-ground vegetation at different soil depths. One of<br />
them was mesohaline, the other euhaline.<br />
Ten plots of 2m × 2m were situated in the new salt-marsh (existing since 2002) and 80<br />
plots in the three old salt-marshes. Soil samples were collected at three different depths (0-<br />
5cm, 5-10cm and 10-15cm) in spring 2006. After washing by fresh water, the soil samples<br />
were spread in the greenhouse to allow viable seeds to germinate. Germination experiments<br />
lasted 6 months and all seedlings were identified and removed after identification. Above-<br />
ground vegetation composition was determined during the growing season in all plots.<br />
Viable seed density was calculated for each plot and for the three different depths; the<br />
similarity between seed bank and floristic composition of the above-ground vegetation was<br />
calculated. A general linear model was used to investigate the effect of soil depth, age and<br />
salinity of the salt-marsh on density and similarity between seed bank and above-ground<br />
vegetation.<br />
The results showed that seed density decreased with depth in all salt-marshes<br />
irrespective of their age and soil salinity.<br />
Seed density and similarity between seed bank and above-ground vegetation were<br />
higher in the new salt-marsh than in the old one in the same study area. This is because in<br />
young as well as in old successional stages, the seed bank was mostly composed of new
colonizers, while most perennial species were absent from the soil seed bank, although they<br />
were dominant in the above-ground vegetation of the old salt-marsh.<br />
The characteristics of the seed bank of a mesohaline salt-marsh were found not to be<br />
fundamentally different from that of both euhaline salt-marshes.<br />
Key words: Succession, Seed bank, Salinity, Salt-marsh, Vegetation, Mesohaline, Euhaline<br />
113
6.2 Introduction<br />
114<br />
The persistence of seeds is a fundamental aspect of plant biology. It plays a key role in<br />
the conservation and restoration of plant communities and is important for the potential<br />
response of plant species to changing land use and climate (Thompson et al. 1997). Seed<br />
banks are crucial for the restoration of plant communities (Bossuyt et al. 2005), the recovery<br />
of endangered plant species and the conservation of genetic diversity (Wolters & Bakker<br />
2002).<br />
The stage of succession (age) is an important factor, which may significantly affect seed<br />
bank characteristics (density, composition and similarity with above-ground vegetation). The<br />
seed bank richness and density declined from initial to terminal successional stages in fallow<br />
land (a habitat heavily anthropogenically influenced) in which the number of species in the<br />
seed bank decreased over the course of succession from 38 to 25 (Falinska 1999). Succession<br />
in semi-natural grassy or meadow communities tends to show other types of change (Donelan<br />
& Thompson 1980; Patridge 1989; Milberg 1995). Chambers (1995) found in an alpine herb<br />
field that for late successional stages the seed bank was dominated by species producing less<br />
persistent seeds. In sandy dune slack habitat, Bossuyt & Hermy (2004) found that similarity<br />
between vegetation and the 0-5cm layer in the seed bank increased with increasing slack age.<br />
Similarity between vegetation and the deeper soil layer was much lower and showed no<br />
significant correlation with age. In addition, they stated that during the course of succession<br />
there is a sharp increase in seed density with time and that the seed longevity index decreases<br />
during succession. Seed bank composition followed above-ground vegetation in time. As far<br />
as we know, the seed bank characteristics of young versus old salt-marshes have not been yet<br />
compared in detail.<br />
The knowledge of vertical distribution of seed density in soil and the ability to predict<br />
the vertical distribution and emergence of viable seeds can be vital for vegetation restoration
(Espinar et al. 2005). The density of soil seed banks is normally highest at the soil surface and<br />
declines monotonically with depth. This pattern is assumed to reflect regular seed input at the<br />
surface and a more or less gradual decline in viability as seeds move vertically down the soil<br />
profile. Sometimes, for a variety of reason, peak density occurs below the surface or the<br />
density of soil seed bank remains constant along the soil depth gradient. For instance, Espinar<br />
et al. (2005) found that the total seed density at a depth of 15cm is higher at more shallow soil<br />
depths in the non-tidal part of the Doñana salt-marsh (southwest Spain), due to seasonal<br />
disturbance processes (soil cracking during the dry season).<br />
In salt-marsh habitat, salinity is a determining factor for seed germination (Adam 1990).<br />
Increasing soil salinity decreased the proportion of germinating seeds and slowed down or<br />
delayed the seed germination and many seeds remained dormant due to low water potentials<br />
under high salinity levels (Ungar 1962; Chapman 1974; Noe & Zedler 2000; Tobe et al. 2000;<br />
Ungar 2001; Rubio-Casal et al. 2003; Qu et al. 2007). Therefore, it can be hypothesized that<br />
higher salinity gives seeds a higher chance and opportunity to penetrate deeper. Consequently,<br />
in high salinity habitat the decrease of seed density with soil depth is expected to be lower<br />
than in a less saline habitat.<br />
It can also be expected that the similarity between seed bank and vegetation (hereafter<br />
called similarity) in higher salinity condition remains constant with depth while in less saline<br />
conditions, it decreases with depth. Similarity between seed bank and above-ground<br />
vegetation and seed density has frequently been investigated in salt-marsh habitat in the past.<br />
Grazing for example has been proven to be an important factor influencing the above-<br />
mentioned seed bank characteristics, although the conclusions are often contradictory (Ungar<br />
& Woodel 1993; Ungar & Woodell 1996; Erkkila & Heli 1998; Chang et al. 2001). Study on<br />
the variation of seed density and similarity was not investigated yet in relation to different<br />
degrees of salinity. Hereafter we compare euhaline and mesohaline salt-marsh in that respect.<br />
115
116<br />
Our study area consists of three salt-marshes with different environmental conditions.<br />
Saeftinghe is a mesohaline salt-marsh and the other two salt-marshes are euhaline<br />
(IJzermonding and Zwin). In addition, the IJzermonding consists of both old and recently<br />
created salt-marsh habitats. We tested the following two hypotheses: 1- the seed bank in both<br />
old and new salt-marshes is composed of early successional species, since early successional<br />
species tend to form persistent seed banks and late successional species tend to show a more<br />
transient seed bank (e.g. Bossuyt & Hermy, 2004), 2- in mesohaline salt-marsh, seed density<br />
and similarity with above-ground vegetation decrease stronger with depth as compared with<br />
euhaline salt-marsh, where a more constant seed bank density is expected, due to better<br />
preservation circumstances in more saline environment, combined with the worse germination<br />
conditions in the latter environment.<br />
6.3 Material and Methods<br />
6.3.1 Study areas<br />
Soil cores were sampled at three salt-marsh sites, the mesohaline salt-marsh<br />
‘Verdronken Land van Saeftinghe’ in the Netherlands (further on called: Saeftinghe) with a<br />
west-east salt gradient of 5.5 – 8psu of the river water along the Scheldt estuary, and the<br />
euhaline salt-marshes IJzermonding and Zwin (salinity>15psu) in Belgium. All sites are<br />
protected as nature reserves. Although mesohaline and euhaline salt-marshes are also different<br />
in size, management regime (grazed and ungrazed), landscape (estuary and coastline salt-<br />
marsh) and dominant plant species, using relatively seed characteristic along depth decreased<br />
the effect of these environmental conditions (covariates) on the results. In addition, there is no<br />
previous research and pre-assumption that showed these environmental factors could affect on<br />
vertical distribution of seeds.
The area of IJzermonding has recently (2002) been increased during a large-scale<br />
restoration project by creation of a new salt-marsh. Large amounts of sand and slurry were<br />
removed in the period 2000-2002 (hereafter called ‘new’ salt-marsh). In other parts of the<br />
IJzermonding, two smaller salt-marsh relicts remained intact for centuries (hereafter called<br />
‘old salt-marsh’) (see Fig. 1.4).<br />
6.3.2 Data collection<br />
Data were collected in 90 plots (2m × 2m), 50 of which were established in the<br />
Saeftinghe, 26 in the IJzermonding (10 in the new and 16 in the old salt-marsh) and 14 in the<br />
Zwin. Seed bank composition was assessed by seedling germination under greenhouse<br />
conditions. Soil samples were collected in March 2006 when natural stratification had already<br />
taken place in the field. With an auger with a diameter of 3cm, an average of 25 soil cores<br />
were collected at random up to a depth of 15cm in each plot. These samples were divided in<br />
three subsamples (0-5cm, 5-10cm and 10-15cm) and the sub-samples were then pooled per<br />
soil layer for each plot. This resulted in an average of 0.88 litre soil sample in each plot for<br />
each layer, which exceeds the recommended 0.8 litre soil necessary to determine the species<br />
composition of the seed bank (Hutchings 1986). The methodology of Ter Heerdt et al. (1996)<br />
was used to concentrate the soil seed bank samples, which were washed through a coarse<br />
(2mm mesh width) and a fine (0.18mm mesh width) sieve. The first sieve removes most roots<br />
and coarse vegetative parts. The high water pressure together with finger pressure was used to<br />
make sure that all seeds were able to cross through the first sieve. The second sieve withholds<br />
all of seeds while the majority of silty soil material is washed out. The concentrated samples<br />
were then spread in a thin layer (maximum 0.4cm thick) in 40cm × 40cm trays filled with<br />
sterilized potting soil. In March 2006, the trays were randomly placed on shelves with a<br />
natural light regime and were kept moist by regular rain water spraying. Air temperature<br />
varied between 14°C and 25°C. 24 control trays, filled with the same sterilized potting soil<br />
117
were also placed randomly on the shelves to test for possible greenhouse and potting soil<br />
contamination.<br />
118<br />
Seedlings were identified as soon as possible after germination, counted and removed<br />
or, if they could not be identified immediately, transplanted to pots to allow further growth<br />
and identification.<br />
After 6 months, when no further seedlings germinated, the trays were left to dry for two<br />
weeks. This allowed the samples to be crumbled to expose deeper buried seeds to the light.<br />
After watering the samples for another 3 weeks and changing the light into a light regime of 8<br />
hour dark/16 hour light, no new seedlings emerged. Nevertheless, the residual soil was<br />
checked for remaining seeds by viewing small random samples taking from trays under a<br />
microscope and probing seeds with a needle in order to distinguish between firm and empty<br />
seeds. Since, the number of seeds that remained in the investigated soil samples was very low,<br />
this procedure was not repeated for all trays.<br />
Above-ground vegetation composition was determined during the growing season of<br />
2006 by estimating the cover of all vascular plant species with a decimal scale (Londo 1976)<br />
in the 90 plot (2m × 2m), used earlier for the soil seed bank sampling.<br />
6.3.3 Data analysis<br />
Seedling counts were recalculated to germinable seed density expressed per m² for each<br />
5cm soil depth layer and for each species separately. Similarity between the species<br />
composition of the above-ground vegetation and the soil seed bank was assessed with the<br />
quantitative Czekanowski similarity index (Kent & Coker 1995) in each depth separately.<br />
Seed density was transformed to log10(x +1) to meet the normal distribution. General<br />
linear model and post-hoc tests were used to compare the seed density and similarity between<br />
new and old salt-marsh for IJzermonding data. Seed density and similarity were introduced as
dependent variables while, depth categories (0-5cm, 5-10cm and 10-15cm) and age (old and<br />
new) were introduced as fixed factors. An interaction between depth and age was also<br />
considered in the model. Furthermore, the data were divided into two groups: Zwin and<br />
IJzermonding as euhaline plots and Saeftinghe as mesohaline plots. Seed density and<br />
similarity were introduced as dependent variables and depth and salinity (euhaline and<br />
mesohaline) as fixed factors. Interactions between fixed factors were also entered in the<br />
model.<br />
In addition, an analysis was performed to compare the seed density and similarity<br />
among three salt-marshes. In this analysis, the data collected in Zwin, Saefinghe and the old<br />
salt-marsh in IJzermonding were used. Again seed density and similarity were introduced as<br />
dependent variable and depth and different salt-marshes as fixed factors. Interaction between<br />
fixed factors were also entered the model. In all analyses, the impact of depth is assumed to be<br />
put into evidence by a significant interaction between depth and salt-marsh factors (old and<br />
new; euhaline and mesohaline).<br />
6.4 Results<br />
6.4.1 Seed bank properties and succession stage<br />
Seed densities in old and new salt-marshes at IJzermonding were significantly different,<br />
respectively 3656 seeds/m² and 6604 seeds/m² (df= 1, F= 2.84 and p= 0.04). In both old and<br />
new salt-marshes, the seed density was highest in the upper layer. The interaction between<br />
depth and age was not significant (df= 2, F= 2.11 and p= 0.13) (Fig. 6.1).<br />
Similarity in the new salt-marsh was higher than in the old salt-marsh (df= 1, F= 13.74<br />
and p
Seed density(m²)<br />
Seed density(m²)<br />
120<br />
5<br />
4.5<br />
4<br />
3.5<br />
3<br />
2.5<br />
2<br />
1.5<br />
1<br />
0.5<br />
0<br />
5<br />
4.5<br />
4<br />
3.5<br />
3<br />
2.5<br />
2<br />
1.5<br />
1<br />
0.5<br />
0<br />
A<br />
B<br />
a<br />
b<br />
0-5cm 5-10cm 10-15cm<br />
a<br />
Old New<br />
b<br />
c<br />
0-5cm<br />
Old<br />
New<br />
5-10cm<br />
10-15cm<br />
Fig. 6.1. The variation of seed density according to depths (A) and succession stages (B) at<br />
IJzermonding (Y axis shows the log10(x +1) seed density/m²). Different successive letters indicate<br />
significant differences (at p
Similarity(%)<br />
Similarity(%)<br />
40<br />
35<br />
30<br />
25<br />
20<br />
15<br />
10<br />
5<br />
0<br />
40<br />
35<br />
30<br />
25<br />
20<br />
15<br />
10<br />
5<br />
0<br />
B<br />
A<br />
a<br />
a<br />
0-5cm 5-10cm 10-15cm<br />
a<br />
Old New<br />
b<br />
a<br />
Old<br />
New<br />
0-5cm<br />
5-10cm<br />
10-15cm<br />
Fig. 6.2. The variation of similarity according to depths (A) and succession stages (B) at<br />
IJzermonding. Different successive letters indicate significant differences (at p
122<br />
Plant species in the above-ground vegetation and seed bank of old and new salt-marsh at<br />
the IJzermonding are compared in Table 6.1 (only typical salt-marsh species with Ellenberg<br />
salinity index higher than 3 and Juncus bufonius were shown). Species not found in the<br />
vegetation relevés of the plots and only sparsely represented in the whole area are Artemisia<br />
maritima, Atriplex littoralis, Chenopodium rubrum, Juncus bufonius, Juncus gerardii and<br />
Plantago maritima. The dominant species of the standing vegetation of the old salt-marsh are<br />
the perennial species Elymus athericus, Limonium vulgare and Spartina townsendii. They are<br />
absent or nearly absent in the seed banks of new and old salt-marshes. Dominant in the<br />
vegetation of the new salt-marsh are the annuals Salicornia spp., Suaeda maritima and<br />
Spergularia spp. They are all well represented in all local seed banks.<br />
Table 6.1. Relative abundance of salt-marsh species in seed bank and vegetation in new and old saltmarshes<br />
in IJzermonding. SEll shows salinity Ellenberg index value. Species which are expected to<br />
appear in salt-marshes (Ellenberg index>3, Ellenberg 1991) are shown (see Appendix F for all<br />
species) 6<br />
Species<br />
New<br />
Seed bank<br />
Old<br />
above-ground vegetation<br />
S Ell 0-5cm 5-10cm 10-15cm Total 0-5cm 5-10cm 10-15cm Total New Old<br />
Aster tripolium 8 0.06 0.00 0.00 0.05 0.14 0.15 0.00 0.13 0.00 0.54<br />
Atriplex littoralis 7 0.84 0.55 0.00 0.73 0.81 1.09 0.36 0.84 0.00 0.00<br />
Elymus athericus 6 0.00 0.00 0.00 0.00 0.00 0.00 0.00 0.00 10.37 55.82<br />
Glaux maritima 7 0.00 0.61 0.00 0.08 1.28 0.20 0.00 0.88 0.00 0.22<br />
Halimione portulacoides 8 0.00 0.00 0.00 0.00 0.00 0.00 0.00 0.00 0.37 0.33<br />
Juncus bufonius agg. 0 0.26 0.61 4.16 0.60 4.19 1.92 6.80 3.91 0.00 0.00<br />
Limonium vulgare 8 0.00 0.00 0.00 0.00 0.21 0.16 0.00 0.17 3.33 12.19<br />
Parapholis strigosa 5 0.00 0.00 0.00 0.00 0.00 0.00 0.00 0.00 7.41 0.11<br />
Puccinellia maritima 8 0.00 0.00 0.00 0.00 0.31 0.16 0.00 0.24 1.85 4.57<br />
Sagina maritima 4 0.00 0.00 0.60 0.04 0.00 0.00 0.00 0.00 0.00 0.00<br />
Salicornia spp. 9 55.36 39.38 39.43 51.96 35.40 49.74 50.99 40.56 13.70 2.94<br />
Spartina townsendii 8 0.00 0.00 0.00 0.00 0.00 0.00 0.00 0.00 0.00 8.81<br />
Spergularia spp. 8 11.18 1.77 11.32 9.87 26.34 26.41 20.96 25.79 8.15 1.85<br />
Suaeda maritima 8 3.20 3.29 1.06 3.05 5.38 2.24 2.97 4.36 36.30 0.98<br />
Triglochin maritimum 8 0.00 0.00 0.51 0.04 3.65 6.57 3.42 4.35 0.00 0.22<br />
6 The Ellenberg indicator value of 3 was chosen as threshold for salt-marsh species, because of the general<br />
description given by Ellenberg (1992): S= 3: species indicative of (at least) β-mesohaline conditions; S= 2,<br />
meaning ‘from oligohaline conditions’, cannot be considered as typical of salt-marsh conditions anymore.
Seed density(m²)<br />
Seed density(m²)<br />
6<br />
5<br />
4<br />
3<br />
2<br />
1<br />
0<br />
6<br />
5<br />
4<br />
3<br />
2<br />
1<br />
0<br />
A1<br />
A2<br />
a<br />
b<br />
0-5cm 5-10cm 10-15cm<br />
a<br />
Euhaline Mesohaline<br />
b<br />
c<br />
Euhaline<br />
Mesohaline<br />
0-5cm<br />
5-10cm<br />
10-15cm<br />
Fig. 6.3. The variation of seed density in different depths (A1) in euhaline and mesohaline saltmarshes<br />
(A2) (Y axis shows the log10(x+1) seed density/m²). Different successive letters indicate<br />
significant differences (at p
6.4.2 Seed bank properties and salinity<br />
Seed density was significantly different in two euhaline and mesohaline salt-marshes (df= 1,<br />
F= 32.19 and p
Table 6.2. Relative abundance of species in seed bank and above-ground vegetation in the old saltmarshes<br />
(Saeftinghe and Zwin). SEll shows salinity Ellenberg index. Species which are expected to<br />
appear in salt-marshes (Ellenberg index>3, Ellenberg 1991) and Juncus bufonius are shown (see<br />
Appendix G for all species)<br />
Seed bank<br />
Above-ground<br />
Species<br />
Saeftinghe<br />
Zwin<br />
vegetation<br />
SEll 0-5cm 5-10cm 10-15cm Total 0-5cm 5-10cm 10-15cm Total Saeftinghe Zwin<br />
Aster tripolium 8 0.00 0.28 0.05 0.07 0.32 0.05 0.00 0.46 3.82 4.05<br />
Atriplex littoralis<br />
Chenopodium<br />
7 0.00 0.01 0.00 0.00 0.00 0.00 0.00 0.00 0.05 0.00<br />
glaucum 3 0.03 0.08 0.00 0.04 0.10 0.00 1.34 0.12 0.00 0.00<br />
Elymus athericus 6 0.00 0.00 0.00 0.00 0.00 0.00 0.00 0.00 10.43 14.76<br />
Glaux maritima 7 0.90 3.37 1.76 1.55 5.08 3.21 10.54 4.30 3.55 0.71<br />
Halimione<br />
portulacoides<br />
8<br />
0.00 0.00 0.00 0.00 0.00 0.04 0.00 0.02 0.00 53.81<br />
Juncus bufonius agg. 0 62.69 39.31 33.30 55.08 47.19 78.56 57.24 66.99 0.00 0.00<br />
Juncus gerardii 7 9.44 6.95 6.29 8.63 11.98 7.78 10.41 9.32 3.71 0.12<br />
Limonium vulgare 8 0.00 0.00 0.00 0.00 0.00 0.00 0.00 0.00 0.00 5.48<br />
Parapholis strigosa 5 0.00 0.00 0.00 0.00 0.00 0.00 0.00 0.00 0.44 0.00<br />
Puccinellia maritima 8 0.01 0.07 0.08 0.03 0.19 0.00 0.00 0.06 9.77 2.38<br />
Salicornia spp. 9 6.13 11.84 17.30 8.26 6.15 0.59 0.77 2.40 6.11 2.14<br />
Spartina townsendii 8 0.00 0.00 0.00 0.00 0.00 0.00 0.00 0.00 15.34 0.83<br />
Spergularia spp. 8 7.14 24.78 25.35 12.61 14.30 1.29 4.56 5.72 2.73 2.38<br />
Suaeda maritima 8 0.00 0.02 0.00 0.00 0.64 0.10 0.39 0.29 0.98 4.64<br />
Triglochin maritimum 8 0.22 0.70 1.66 0.43 0.00 0.05 0.00 0.03 1.04 0.00<br />
125
Seed density(m²)<br />
Seed density(m²)<br />
126<br />
6<br />
5<br />
4<br />
3<br />
2<br />
1<br />
0<br />
6<br />
5<br />
4<br />
3<br />
2<br />
1<br />
0<br />
A<br />
B<br />
a<br />
b<br />
0-5cm 5-10cm 10-15cm<br />
a b b<br />
IJzermonding Saeftinghe Zwin<br />
c<br />
IJzermonding<br />
Saeftinghe<br />
Zwin<br />
0-5cm<br />
5-10cm<br />
10-15cm<br />
Fig. 6.4. The variation of seed density according to depths (A) and salt-marsh (B). Y axis shows the<br />
log10(x+1) seed density/m². Different successive letters indicate significant differences (at p
As shown in Table 6.2, Saeftinghe and Zwin have as common difference with<br />
IJzermonding with the massive presence of Juncus spp. in their seed banks. The dominant<br />
perennials for Saeftinghe (Elymus athericus, Puccinellia maritima and Spartina townsendii)<br />
and for Zwin (Elymus athericus, Halimione portulacoides and Limonium vulgare) are absent<br />
or nearly absent in the respective seed banks. The annuals Chenopodium rubrum, Salicornia<br />
spp. and Spergularia spp. occur in high number in the seed banks, and are not present or<br />
relatively sparse in above-ground vegetation. Only typical salt-marsh species with Ellenberg<br />
salinity index higher than 3 and Juncus bufonius were shown in Table 6.2.<br />
6.5 Discussion<br />
There was a pronounced difference between the seed density in the new and old salt-<br />
marsh of the IJzermonding nature reserve. Since seed bank density is the result of the balance<br />
between seed input and output (Fenner 1985), the high seed density in the first successional<br />
stages can be attributed to a high seed input by most pioneer species (e.g. Salicornia spp.,<br />
Suaeda maritima and Spergularia spp.) and to a low seed output by seed decay i.e. a high<br />
longevity of these species. Pioneer species are known to produce high densities of seeds<br />
(Davy et al. 2001; Wolters & Bakker 2002), that remain viable for a long period (Thompson<br />
et al. 1997). Similar patterns were found in grass and heathland communities, where there was<br />
a decrease in total seed density with increasing age (Bossuyt & Hermy 2003). Remarkably,<br />
seed density was higher during early stage for the three different soil layers. If the seeds are<br />
persistent enough, they will also become incorporated in the deeper soil layer (Thompson et<br />
al. 1997; Grandin 2001).<br />
Despite the dominance of Suaeda maritima in the vegetation of the recently created salt-<br />
marsh, the seed of this species was not dominant in the soil. Since seed production per<br />
individual plant of Suaeda is higher than of Salicornia plants (see chapter 2, Table 2.4) and<br />
most probably also of individual Spergularia plants (not counted though), we can indirectly<br />
127
conclude that Suaeda seeds are most probably less persistent than Salicornia and Spergularia<br />
seeds. Early germination is a possible cause for its low abundance in the soil (Tessier et al.<br />
2000).<br />
128<br />
Three distinct relationships between vegetation and soil seed bank can be recognized<br />
along vegetation succession in relation to underlying ecological processes of community<br />
assembly (Chang et al. 2005): 1) the seed bank composition varies with the established<br />
vegetation along vegetation succession seres, 2) the seed bank composition remains rather<br />
constant and is composed of early successional species that produce many seeds that persist<br />
along the succession sere, and 3) the seed bank composition remains constant but contains a<br />
matrix of species found in the different stages. Results of this study mainly coincide with the<br />
second relationship, in which colonizing species of the early successional stage i.e. Salicornia<br />
spp., Suaeda maritima and Spergularia spp. produced many persistent seeds. In late<br />
successional stages the seed bank mostly consisted of the same species as in the early<br />
succession stages, despite of perennial dominance (e.g. Elymus athericus) in above-ground<br />
vegetation. A study on the seed bank in IJzermonding of old salt-marsh in 2001-02<br />
(Stichelmans 2002 cit. in Hoffmann & Stichelmans 2006) also showed that Salicornia spp.<br />
Spergularia spp. Chenopodium rubrum, Atriplex prostrata and Suaeda maritima were<br />
dominant in the seed bank. They remained dominant after five years. Although frequently<br />
found in this former seed bank analysis of the old marsh at the same study site (Stichelmans<br />
2002 cit. In Hoffmann & Stichelmans 2006), we did not detect any seedlings of Sagina<br />
apetala and few for S. maritima this time. Our results are in accordance with studies of<br />
primary succession in an uplifted seashore (Grandin 2001) and of secondary succession in<br />
species-rich meadows (Kalamees & Zobel 1998) and old fields (Lavoral et al. 1993), on<br />
which the seed bank composition is mostly composed of early successional species. In
contrast, some authors demonstrated that the seed bank of early successional stages<br />
disappeared as species disappeared in the vegetation (Bossuyt & Hermy 2004).<br />
While in early successional stages new colonizers become to a large extent incorporated<br />
in the seed bank leading to a relatively high similarity between seed bank and above-ground<br />
vegetation, in the late successional stage most dominant species have very transient seed bank<br />
or no seed input (e.g. Elymus athericus and Spartina towsendii; see chapter 2). Immediate<br />
germination (Tessier et al. 2000), absence of seed production due to pathogen infection<br />
(Chang et al. 2005; the results of this study) and pollen limitation (Bertness & Shumway<br />
1992), might explain the absence of seeds of a particular species in the seed bank.<br />
Furthermore, seeds of some species (e.g. Elymus athericus) are relatively large and heavy and<br />
remain attached to bracts after detachment from the spike. Due to their relatively large size,<br />
seeds of these species are unlikely to percolate downwards through the soil; they readily<br />
germinate in the soil or become concentrated in the driftline (Peart 1984; Thompson et al.<br />
1994; Chang et al. 2005).<br />
As a consequence of the above discussed differences in seed production and longevity,<br />
our results also showed that similarity between seed bank composition and standing<br />
vegetation decreased during succession.<br />
Although salinity can promote seed dormancy (Tobe et al. 2000) and give seed a higher<br />
chance to penetrate into soil deeper and deeper, but two salt-marshes (euhaline and<br />
mesohaline) are the same in vertical seed distribution with highest densities in topsoil. This<br />
pattern indicates the general rules of seed distribution in which regular seed input at the<br />
surface by seed rain increase the number of seeds in the top soil; as the seeds penetrate in<br />
deeper soil layers, they probably lose part of their viability. Espinar et al. (2005) showed that<br />
seeds of some salt-marsh species suffer a rapid loss of viability when buried e.g. Scirpus<br />
maritimus.<br />
129
130<br />
Both the similarity between standing vegetation and seed bank composition and seed<br />
density show a similar pattern: both decrease with increasing soil depth. The decreasing<br />
similarity with increasing depth could be related to decreasing seed density with depth. This<br />
result is in accordance with previous studies in terrestrial habitats (e.g. Bossuyt & Hermy<br />
2004). However, the similarity between seed bank and above-ground vegetation in the three<br />
salt-marshes was different. The lower similarity in the Zwin and IJzermonding (old) was<br />
mainly caused by the dominance of Halimione portulacoides and Elymus athericus in the<br />
vegetation, species that were never found in the seed bank.<br />
Seed density in Saeftinghe and the Zwin was significantly higher than at the<br />
IJzermonding. Juncus bufonius had the highest seed density in the greenhouse and the highest<br />
density of emerging seeds were found in samples from Saeftinghe and the Zwin, indicating<br />
that the high seed density is probably due to the high abundance of Juncus bufonius.<br />
Juncus bufonius was the most abundant species in the seed bank. This species has been<br />
reported as dominant representative in the seed bank of many, environmentally quite diverse<br />
terrestrial ecosystems in and outside Europe (e.g. in alkaline marsh vegetation: Vyvey 1983;<br />
as an non-indigenous species in temperate rain forest: Sem et al. 1996; coastal subarctic<br />
ecosystems: Staniforth et al. 1998; forest: Devlaeminck et al. 2005; dry acidic dune<br />
grasslands: Bossuyt et al. 2007); it is one of the most abundant seed bank species in Baltic<br />
seashore meadows (Erikkila & Heli 1998). In a Mediterranean salt-marsh Juncus bufonius<br />
produced a large number of seeds that persist in the soil seed bank with a mean density of<br />
5083 seeds/m² at a depth of 0-10cm (Marañón 1998). This species is 17 th in frequency<br />
appearance in NW European studies on seed banks (Thompson et al. 1997). Juncus bufonius<br />
is a weedy, widely distributed and low salt tolerant annual species (the Ellenberg index for<br />
salinity is 0; the Ellenberg index for salinity for the closely related, hard to distinguish Juncus<br />
ambiguus is 4; on the salt-marshes we might be dealing with the latter species in most cases;
seedlings of both can not be distinguished though). Probably, salinity prevents the appearance<br />
of this species in the vegetation (Marañón 1998). This is apparently also the case for the other<br />
species only sparsely present in the standing vegetation but abundant in the seed bank<br />
(Atriplex littoralis, Chenopodium rubrum and Juncus gerardii). When seeds of species of low<br />
to moderate salt tolerance are dispersed into a region of high salinity, the salt concentration of<br />
the soil will prevent the germination of the seeds and hence their establishment in the<br />
vegetation (Shumway & Bertness 1992). Therefore, seeds of Juncus bufonius can remain<br />
viable in the soil and seed density may increase in time. After washing the soil by fresh water<br />
in the laboratory and watering by fresh water in the greenhouse, this species appears<br />
abundantly.<br />
The three investigated seed banks of old salt-marshes do not fundamentally differ from<br />
each other. The mesohaline has the same vertical profile as both euhaline seed banks. In all<br />
three the dominant salt-marsh plant seeds are of annuals; these of perennials are largely<br />
lacking.<br />
6.6 Conclusion<br />
The age of salt-marsh could affect on density and composition of seeds buried in soil.<br />
We have provided evidence that seed bank of young as well as old salt-marsh is composed of<br />
seeds of new colonizers (cf. hypothesis 1). This explains the very low similarity between seed<br />
bank and above-ground vegetation in that habitat, particularly in its late successional stage.<br />
This implies that restoration is possible from a long-term persistent seed bank if the target<br />
species would be pioneer colonizers. Late successional species largely need to colonize from<br />
(often sparsely present; see chapter 2) seed sources in surrounding salt-marshes or by<br />
vegetative propagules, such as rhizome parts.<br />
In salt-marsh habitats, salinity is not able to change (or inverse) the monotonically<br />
distribution of seeds along depth. The characteristics of the seed bank of the mesohaline salt-<br />
131
marsh were found not to be fundamentally different from that of both euhaline salt-marshes<br />
(cf. hypothesis 2).<br />
132
Chapter 7 General conclusions
134<br />
Permanent plots in this study gave detailed information about changes in species<br />
composition at a particular site during a relatively short period. The process of dispersal,<br />
establishment and colonization of most species was successful, and took place very quickly.<br />
Although viable seed availability was an important constraint for the appearance of some<br />
species in early colonization, most target species present in the local species pool, had<br />
colonized the new intertidal area in 2007, only five years after creation of (part of) the new<br />
salt-marsh; the similarity between restoration site and adjacent reference site drastically<br />
increased from 2003 to 2007, indicating that the restoration project was very successful in<br />
these early salt-marsh developmental years. However, after colonization, different species<br />
showed different patterns in space and time. Some of them decreased, most increased in<br />
abundance. Two main factors could be important in spatio-temporal succession and,<br />
decreasing and increasing of species abundance in time in the restoration site: inundation<br />
frequency (or elevation) and sheep grazing. Elevation was one of the most important indirect<br />
ecological factors affecting plant succession. Some species are well known to show expansion<br />
at higher elevation, e.g. Elymus athericus (Bakker 1989). It means that these species will<br />
expand if sedimentation remains dominant over erosion in future. The data on sedimentation<br />
(Provoost, unpublished) showed that in most parts of the area, sedimentation is still and rather<br />
constantly taking place in the newly created salt-marsh. On the other hand our data showed<br />
that Puccinellia maritima is expanding intensively. Puccinellia maritima has been identified<br />
as a key species in the process of trapping and stabilising sediment on European marshes<br />
(Andresen et al. 1990; Langlois et al. 2003). Therefore it can be expected that the percentage<br />
cover of high salt-marsh species will further increase by mere clonal growth of individuals<br />
and further enhanced by sedimentation, e.g. Elymus athericus. Elymus athericus is one of the<br />
main dominants at the older stages of a West European salt-marsh (Bakker 1989; van Wijnen<br />
& Bakker 1997). So far, there have been no indications that other species will replace Elymus
athericus when salt-marshes become older (van Wijnen et al. 1997), although in the study<br />
area several individuals of Phragmites australis have established along the higher edges of<br />
old as well as newly created salt-marsh. However, the limited salt tolerance level of this<br />
species should prevent further colonization of this very competitive species. As a result, future<br />
vegetation development will probably depend on the sediment accretion. At high-elevated<br />
sandy or even silty sites a future dominance of Elymus athericus can be expected (cf. Bakker<br />
1989; Bakker et al. 1997). Whether spreading of potential dominant species such as Atriplex<br />
portulacoides at lower elevation (cf. Jensen 1985) will occur in the lower salt-marsh is<br />
uncertain, since this species is very sensitive to grazing (Schröder et al. 2002) and did so far<br />
not spread in any part of the restoration site. In our study area, Salicornia procumbens<br />
appeared in 2005 for the first time and consecutively strongly increased later. It can be<br />
expected that it will become a dominant species in the pioneer zone, replacing the currently<br />
dominant species, Salicornia europaea.<br />
The very low density grazing and the short term of sheep grazing did not indicate a clear<br />
impact on species succession, other studies indicate that grazing and trampling are important<br />
biotic factors in intensively grazed salt-marshes; possibly, grazer effects can only be<br />
significant at the longer run and with higher density grazing (Jensen 1985; Bakker 1989;<br />
Kiehl 1997). However, for more accurate conclusions about sheep grazing and its effect on<br />
plant succession, grazing should be further prolonged at the restoration site.<br />
Studies of succession showed that communities, habitats and ecosystems were not static<br />
but constantly change in response to disturbance, environmental change, and their own<br />
internal dynamics (Molles 2005). The relationship between different parts of a habitat,<br />
community or ecosystem could be affected by the age of the successional stages (Molles<br />
2005). Differences in determination of vegetation development by the same abiotic factors<br />
135
(soil and elevation), and between vegetation and seed bank in two different ages of salt-marsh<br />
(early primary and late primary) proved this hypothesis.<br />
7.1 Constraints on species colonization<br />
136<br />
It has repeatedly been demonstrated that variation in the arrival time of species at a<br />
successional site can have a major effect on the pattern and outcome of succession (e.g. Drake<br />
1991; Huston 1994), indicating the importance of studies on factors which affect arrival time<br />
of different species. The practice of creating salt-marshes on a new substrate provides an<br />
excellent opportunity to study plant colonization and subsequent development of vegetation.<br />
Insight into the process of salt-marsh development is extremely important in guiding the<br />
design, implementation and evaluation of salt-marsh restoration schemes and for determining<br />
the appropriate management strategies (Hoffmann et al. 2005). However, colonization and<br />
subsequent development are different for each salt-marsh restoration, since biotic and abiotic<br />
factors, influencing successional stages from beginning until climax, are site specific.<br />
Three species are well known as pioneers: Salicornia europaea, Suaeda maritima and<br />
Spartina townsendii. In addition, some species are known as relatively low salt-marsh species<br />
i.e. Puccinellia maritima, Halimione portulacoides, Aster tripolium, Spergularia spp.<br />
Triglochin maritimum, Limonium vulgare and Plantago maritima (Beeftink 1965; 1966;<br />
1977). For the restoration of salt-marsh vegetation after creation of intertidal circumstances,<br />
relatively rapid colonization may be expected from pioneer and low marsh species, provided<br />
they are present in a nearby source area (Wolters et al. 2005). We expected these pioneer and<br />
low marsh species to appear in the newly created salt-marsh as initial colonizers, since all<br />
were present in the local species pool. However, most species appeared during the first year,<br />
and even after five years some salt-marsh species that are present in the local species pool<br />
remained absent from the newly created intertidal area. Wolters et al. (2008) demonstrated<br />
that salinity was the most important factor determining the kind of initial colonizers, while
according to Dausse et al. (2008) it would be seed dispersal and consecutive seed rain. We<br />
concluded that, besides these two factors, seed production is also an important constraint in<br />
colonization of salt-marsh habitats and the sequence of species establishment. Most perennial<br />
salt-marsh species are clonal species that spread mainly, some even solely by asexual<br />
propagules. This can be concluded from the fact that they appear neither in the seed bank (of<br />
neither old nor new salt-marsh) nor in the above-ground vegetation early in the primary<br />
succession. Seedling recruitment by salt-marsh perennials, that do produce generative<br />
propagules (e.g. Aster tripolium, Artemisia maritima, …), can be further constrained by low<br />
propagule supply due to insect predation (Louda 1983; Louda 1989) and disease (Bertness et<br />
al. 1987; Bertness & Shumway 1992). In this study we found that fungi could limit the<br />
production of perennials in salt-marsh habitat. Therefore, perennials appear later in<br />
comparison with species that produce a lot of viable seeds. Additionally, some perennial<br />
species might produce less viable seeds, because of their hybrid nature e.g. Spartina<br />
townsendii, a polyploid, hybrid species, that is known to produce only small quantities of<br />
viable seeds (Lambinon et al. 1998). For perennial species sexual processes play a minor role<br />
and their dynamics are maintained primarily by clonal growth (see also Shumway & Bertness<br />
1992).<br />
Although some species produced a lot of seeds, these seeds were probably not viable or<br />
they did not disperse well since they were not observed in both vegetation and seed bank in<br />
the newly created salt-marsh. A few empirical studies were conducted on seed dispersal in<br />
salt-marshes, indicating that the species composition of plant communities is potentially<br />
constrained by dispersal (Rand 2000; Wolters et al. 2005a). However, more studies are<br />
needed on dispersal ability of these species into newly created salt-marsh as dispersal<br />
constraints (species-specific traits, storage effects, landscape ecology and history) may<br />
influence community assembly per se (Belyea & Lancaster 1999).<br />
137
138<br />
In literature it is generally assumed that early succession in salt-marsh conditions is<br />
dominated by facilitation. This mechanism assumes that only certain “early-successional<br />
species” are able to colonize the site in the conditions that occur immediately after the<br />
perturbation, and that they consecutively change the environment in such a way that late<br />
successional species are able to establish in a later phase. They “facilitate” late successional<br />
species, and generally decrease themselves, because they have changed the environment to<br />
less optimal conditions. However, in the particular case of the newly created salt-marsh of the<br />
IJzermonding, we have no clear indications that this mechanisms is at hand here. It rather<br />
appears that colonization simply depends on available propagules, rather than on<br />
environmental suitability. For instance, it can be expected that Elymus athericus is perfectly<br />
able to establish and grow on most sites in the newly created marsh, but simply did not do so,<br />
because it has no or hardly any propagules present in the area. This implies that during early<br />
succession of the newly created salt-marsh, the tolerance mechanism is working. This<br />
mechanism assumes that species appearing later are probably those that simply arrived later.<br />
The sequence of species is determined solely by their life-history characteristics (annuals<br />
compared with perennials). In contrast to the early species, the propagules of the later ones are<br />
dispersed more slowly (MacArthur & Connell 1966; Farrell 1991). In our study area, some<br />
species (e.g. Salicornia europaea and Suaeda maritima) colonized earlier since they can<br />
produce many seeds. While some species particularly perennials (e.g. Elymus athericus)<br />
appeared later. These species are those that produce no or less seeds and the propagules are<br />
dispersed slowly, probably being mainly heavy vegetative parts (rhizomes) of the plant.<br />
7.2 The effect of inundation frequency on vegetation succession<br />
Directional non-replacement succession in harsh salt-marsh conditions occurs when a<br />
few species are able to invade, survive and succeed in slow expansion without eliminating or<br />
replacing each other. The restoration site still has free space available for further expansion.
Species replacement takes place due to modification of the habitat (facilitation) and there is<br />
no competition (see also Bernhardt & Koch 2003). Initially, allogenic succession occurs more<br />
than autogenic succession.<br />
This study revealed a rapid development of vegetation on exposed sediments after the<br />
creation of a new salt-marsh habitat (restoration site). The succession was probably facilitated<br />
by rapid vegetative spread of some clonal salt-marsh species at lower inundation frequencies<br />
and rapid spread of some annuals in higher inundation frequency zones. We concluded that<br />
the distribution of plant species in the early stages of succession is highly constrained by<br />
inundation frequency.<br />
In our study area, the vegetation remains dynamic after 6 years and it is considered to be<br />
in equilibrium with the new environmental gradient. However, annual changes as measured<br />
by permanent plots and mapping of vegetation zones will have to be further monitored.<br />
7.3 Grazing and succession<br />
Natural succession in the absence of livestock grazing of salt-marshes leads to declining<br />
suitability since species and community diversity decrease and forage quality and feeding<br />
value decline (Bos et al. 2005). Vegetation composition and diversity is strongly related to the<br />
management of salt-marshes, for example grazing by large herbivores (Bakker 1989). Since<br />
the cessation of livestock grazing in large areas leads to a strong progress of the vegetation<br />
into late successional stage, Esselink (2000) proposed that the areas must be kept under<br />
livestock grazing, so that the grazing by large herbivores can maintain the marsh vegetation at<br />
a younger successional stage. Grazing by hares has been shown to retard vegetation<br />
succession (van der Wal et al. 2000b) and herbivory by geese slowed down succession by<br />
retarding the establishment and spread of late successional species in the low salt-marsh. Our<br />
observations indicate that the current intensity of sheep grazing is not suited to maintain the<br />
IJzermonding salt-marsh in a young successional stage. Although until now no species have<br />
139
ecome extinct, some palatable and sensitive species to sheep grazing are prone to extinction<br />
in the future as they are drastically grazed by sheep. Some species such as Atriplex spp. and<br />
Chenopodium spp. were grazed so intense that all leafs and green stems were lost before the<br />
end of the growing season. Low stocking rate probably results in selection for the more<br />
palatable and nutritive plant species, resulting in an uneven pattern of grazed and ungrazed<br />
patches (Bakker 1985). Elymus athericus has the lowest forage quality, indicating it might<br />
never be grazed at the current grazer density (see also Milotic et al. 2008). However, the<br />
expansion of this species should be hampered, since it increased its cover and occurrence<br />
drastically. Although the increase of sheep grazing would decrease the patch selection, it may<br />
be dangerous for some of the above mentioned species. Introducing other grazers could be<br />
useful to save these species and to decrease the expansion of strong competitor species, like<br />
Elymus athericus.<br />
7.4 Relationship between soil characteristic and vegetation in different<br />
140<br />
stages<br />
A major challenge in the restoration of salt-marshes is to identify which factors are<br />
important in salt-marsh development. For example, Keddy (2000) suggested salinity as most<br />
important factor, determining the species composition of salt-marsh communities, while Criel<br />
et al. (1999) concluded that salinity together with inundation frequency were the most<br />
important determinants in the brackish salt-marsh estuary of the river Scheldt. When<br />
considering salinity as an abiotic factor, species can be screened and then ranked in relation to<br />
a single trait: salinity tolerance. Consequently, if the salinity level of a local site is known, it is<br />
possible to predict which species from the species pool could potentially become established.<br />
In our salt-marsh habitats, the degree to which abiotic factors determine vegetation<br />
composition is at least as high in early as in late successional stages. In early colonization the
absence/occurrence of perennial as well as annual plants appears to be highly determined by<br />
abiotic environmental factors. This also holds for perennials, but not for annuals in old salt-<br />
marsh. The occurrence of these annuals in the old salt-marsh appears to be limited by<br />
competition from the established perennials. Gaps in that perennial vegetation cover are<br />
needed for annuals to germinate and grow. This explains why their occurrence is not so much<br />
determined by the abiotic (soil) environment, but rather by stochastically created gaps.<br />
In contrast to other terrestrial habitats, assembly of species on new substrate in salt-<br />
marsh habitats is not stochastic. It is rather a deterministic process in which species with high<br />
seed production and salt tolerance start the colonization and facilitate the germination of later<br />
species by creating good sedimentation conditions. In addition, having an old salt-marsh<br />
adjacent to new substrate decreases the stochasticity in vegetation development. Stochastic<br />
factors act mostly in more isolated sites (del Moral 1999). If a site is sufficiently isolated,<br />
limited dispersal produces initially variable vegetation with a very weak correlation between<br />
environmental factors and species composition.<br />
7.5 Seed bank and succession<br />
The variation of seed bank density with age in salt-marsh habitats is different from that<br />
of other terrestrial habitats, in which a low density was found initially that rose with time (e.g.<br />
Flinska 1999; Bossuyt & Hermy 2004). In our study area the density of seeds appears to<br />
decrease with time. This is most probably caused by the difference in seed longevity and seed<br />
production between species of early and late successional stages. Most initial colonizers have<br />
more persistent seeds in comparison with plants of later stages. In general, seed bank<br />
accumulation in salt-marshes is low (Morzaria-Luna & Zedler 2007). Most restoration<br />
programs from seed bank did not succeed (Wolters et al. 2005); as well early as late<br />
successional species do not appear from the seed bank (Wolters & Bakker 2002). This implies<br />
that initial colonizers possibly have equally persistent seeds as species with low relative seed<br />
141
production, but their massive production of small seeds lead to a well represented in the soil<br />
of old salt-marshes. This is in opposition to the conclusions of Thompson et al (1997), who<br />
state that pioneer species generally have long persistent seeds.<br />
142<br />
About similarity of standing vegetation and seed bank, three possible relationships are<br />
proposed: the similarity between the vegetation and soil seed bank is, i) relatively high and<br />
does not consistently increase or decrease with age, ii) increases or decreases as the<br />
communities age and, iii) is relatively low and does not consistently increase or decrease with<br />
age (Chang et al. 2006). The relationship between the vegetation and soil seed bank for the<br />
salt-marsh communities of the IJzermonding most closely resembles the second proposed<br />
relationship, thus that standing vegetation does not reflect the below-ground seeds in late<br />
successional stages. Conversely, in early primary succession, vegetation is more reliable to<br />
predict below-ground seed bank. We have provided evidence that the seed bank during the<br />
whole succession is mostly composed of seeds of new colonizers. This explains the very low<br />
similarity between seed bank and above-ground vegetation in salt-marsh habitat in the late<br />
successional stage.<br />
Plant species that were formerly recorded from the above-ground vegetation in the area,<br />
but that disappeared during the last decades (Armeria maritima, Juncus maritimus, Halimione<br />
pedunculata, Carex extensa, Oenanthe peucedanifolia: Pire 1862; Goetghebeur 1976) were<br />
not found back in the seed bank. Some of these species are among the most interesting and<br />
rare species of European saline habitats (Hoffmann et al. 2005). The recovery of these species<br />
from the local seed bank will be virtually impossible in the future.<br />
7.6 Management implications<br />
Conservation management usually concentrates on decreasing abundance and cover of<br />
dominant, highly competitive graminoids using several approaches like introducing large<br />
herbivores and mowing (Hoffmann et al. 2005). In the studied salt-marshes, Elymus athericus
characterized as a late-successional salt-marsh species has become so dominant in the higher<br />
parts of the old salt-marsh that it can be considered as problematic. Our results showed that<br />
sheep grazing at the present low intensity had no significant negative effect on the expansion<br />
of this species. As sheep grazing appears to induce opposing selection on palatable species,<br />
any increasing intensity of sheep grazing should be made cautiously, since the larger number<br />
of animals might shift to the more palatable species like Limonium vulgare, Triglochin<br />
maritimum or Plantago maritima. However, introducing another herbivore, characterized as a<br />
bulk-feeder rather than as a selective feeder and that consequently is known to preferentially<br />
use this competitive species could be useful for hampering the expansion of this species and it<br />
may also facilitate sheep to graze more on Elymus athericus as well. Studies in feeding<br />
ecology of introduced ungulates (Konik and Shetland pony, donkey and Scottish highland<br />
cattle) in coastal dune grassland showed that all are grass-eaters consuming a high amount of<br />
competitive plant species (Hoffmann et al. 2005, Lamoot et al. 2005). Bakker (1985) stated<br />
that the cover of Elymus athericus on salt-marshes in the Netherlands decreased due to cattle<br />
grazing. Therefore, it can be recommended to introduce cattle into the area (single or mixed<br />
with sheep). It may also be a useful tool to hamper the expansion of competitive species of<br />
surrounding dune grasslands, such as Phragmites australis, Calamagrostis epigejos and<br />
Arrhenatherum elatius.<br />
A management option that also would decrease the dominance of Elymus athericus and<br />
increase diversity is the construction of creeks to enhance tidal flooding of the interior parts,<br />
increasing water-logging rates and improving the colonization of early successional species.<br />
Additive effects of machinery practices to create the channels and dig out soil will also<br />
counteract the expansion of Elymus athericus. This possibility to create a pioneer low salt-<br />
marsh substrate should not be ignored.<br />
143
144<br />
Grazing in the entire year might promote the forage quality of several species. In<br />
addition, the rate of consumption of Elymus athericus might be increased as at the beginning<br />
of the growth season, the palatability of this species is higher (Vallentine 2001). Although<br />
early grazing in the growing season may be harmful for some sensitive species, it should be<br />
considered as a management option.<br />
As the above mentioned valuable species that were present at the IJzermonding salt-<br />
marsh did not appear in the seed bank in the past, the re-appearance of these species in the<br />
area may take several years. The absence of nearby source populations makes that<br />
reintroduction by sowing or planting might be considered as a management option (cf.<br />
Wolters et al. 2008).<br />
7.7 Lines of future research<br />
1- Our results show that populations and plant communities are still dynamic in the<br />
relatively early stages of salt-marsh succession. Future monitoring is therefore necessary to<br />
learn about and to document long-term vegetation succession. This is also needed to evaluate<br />
nature restoration success in the long run.<br />
2- Moving from a more or less descriptive pattern study towards a more mechanistic<br />
research level is the main line of thinking for future research. In that spirit, i) investigating the<br />
mechanism of seed dispersal, and more specifically loss and retention processes of the<br />
viability of seeds during dispersal would be meaningful, ii) study on possible long-distance<br />
dispersal, possible dispersal of seeds from regional species pools would be valuable.<br />
Focussing on the particular situation of the IJzer estuary, the effects of local and artificial<br />
levee-like structures between the newly created salt-marsh and the southern part (O2) of the<br />
old salt-marsh is of particular importance. Study on the mechanism of seed dispersal and the<br />
transportation of seed from this part of old salt-marsh to the newly created salt-marshes is
necessary, and may elucidate why some species have not appeared in the restoration site, yet,<br />
although present in O2, iii) further study on post dispersal factors is recommended.<br />
3- Although we could detect already some effects of sheep grazing on a few vegetation<br />
zones and on particular plant species, further monitoring is needed to analyze all effects of<br />
sheep grazing on vegetation, especially in communities dominated by palatable species, such<br />
as Atriplex spp. and Chenopodium spp..<br />
4- Study on the impact of herbivores other than sheep and at fluctuating densities and<br />
combinations during different seasons would also be of great scientific interest. Finally, scale-<br />
related phenomena of grazing impact would be of great management interest and in the study<br />
of vegetation succession under grazing in general. Unfortunately the salt-marsh environment<br />
of the IJzer estuary is too small to study these spatial and temporal processes and interactions.<br />
The Verdonken Land Van Saeftinghe would be a good alternative to study these processes<br />
together. The Zwin area also has some potentials in this sense, certainly when the recently<br />
planned expansion of the salt-marsh area is combined with grazing management.<br />
145
146
References<br />
Adam, P. 1990. Saltmarsh <strong>Ecology</strong>. Cambridge University Press, Cambridge, UK, 461 p.<br />
Adam, P. 2002. Salt-marshes in a time of change. Environmental Conservation 29: 39-61.<br />
Andresen, H. Bakker, J.P., Brongers, M., Heydemann, B. & Irmler, U. 1990. Long-term<br />
changes of salt-marsh communities by cattle grazing. Vegetatio 89: 137-148.<br />
Anderson, C.E. 1974. A review of structures of several North Carolina salt-marsh plants. In:<br />
Reimold, R.J. & Queen, W.H. (eds.) <strong>Ecology</strong> of halophytes. pp. 307-344. Academic<br />
press, New York, USA.<br />
AOAC, 1990. Official methods of analysis, 15 th ed. Association of Official Analytical<br />
Chemists, Washington D.C., USA, 746 p.<br />
Armstrong, W., Wright, E.J., Lythe, S. & Gaynard. T.J. 1985. Plant zonation and the effects<br />
of the spring-neap tidal cycle on soil aeration in a Humber salt-marsh. Journal of<br />
<strong>Ecology</strong> 73: 323-339.<br />
Arnold, G.W. 1964. Some principles in the investigation of selective grazing. Proceeding of<br />
Australian Society of Animal Production 5: 258-265.<br />
Arthur, C.M., Hagerman, A.E. & Robbins, C.T. 2000. Physiological strategies of<br />
mammalian herbivores against plant defences. In: Palo, R.T. & Robbins, C.T. (eds.)<br />
Plant defences against mammalian herbivory. pp. 103-114. CRC press, Inc. Florida,<br />
USA.<br />
Austin, M.P. 1981. Permanent quadrates: An interface for theory and practice. Vegetatio 46:<br />
1-10.<br />
Bakker, C., Blair, J.M. & Knapp, A.K. 2003. Does resource availability, resource<br />
heterogeneity or species turnover mediate change in plant species richness in grazed<br />
grassland? Oecologia 137: 385-391.<br />
147
Bakker, E.S. & Olff, H. 2003. The impact of different-sized herbivores on recruitment<br />
148<br />
opportunities for subordinate herbs in grasslands. Journal of Vegetation Science 14:<br />
465-474.<br />
Bakker, J.P. 1985. The impact of grazing on plant communities, plant populations and soil<br />
conditions on salt-marshes. Vegetatio 62: 391–398.<br />
Bakker, J.P. 1989. Nature management by grazing and cutting. Kluwer Academic<br />
Publishers, Dodrecht.<br />
Bakker, J.P. 1998. The impact of grazing on plant communities. In: Wallis, M.F., Bakker,<br />
J.P. & VanWieren SE (eds.) Grazing and Conservation Management. pp. 137-184.<br />
Kluwer Academic Publishers, Dordrecht.<br />
Bakker, J.P. 2005. Vegetation conservation, management and restoration: In: van der<br />
Maarel, E (eds.) Vegetation ecology. pp. 308-331. Blackwell Science Ltd, Malden,<br />
USA.<br />
Bakker, J.P., Bos, D. & Vries, Y.D. 2003. To graze or not to graze, that is the question. In:<br />
Essink, K., van Leeuwe, M., Kellerman A. & Wolff, W.J. (eds.) Proceedings of the<br />
10th International Scientific Wadden Symposium. pp. 67-88. Ministry of Agriculture,<br />
Nature Management and Fisheries, Den Haag, The Netherlands.<br />
Bakker, J.P., Esselink, P. & Dijkema, K.S. 1997a. Salt-marsh management for nature<br />
conservation, the value of long-term experiments. Wadden Sea News Letters 1: 19-24.<br />
Bakker, J.P., Esselink, P., Dijkema, K.S., van Duin, W.E. & De Jong, D.J. 2002. Restoration<br />
of salt-marshes in the Netherlands. Hydrobiologia 478: 29-51.<br />
Bakker, J.P., Olff, H., Willems, J.H. & Zobel, M. 1996. Why do we need permanent plots in<br />
the study of long-term vegetation dynamics? Journal of Vegetation Science 7: 147-<br />
155.
Bakker, J.P., Poschlod, P., Strykstra, R.J., Bekker, R.M. & Thompson K. 1996. Seed banks<br />
and seed dispersal: important topics in restoration ecology. Acta Botanica Neerlandica<br />
45: 461-490.<br />
Bakker, J.P. & Ruyter, J.C. 1981. Effects of five years of grazing on a salt-marsh vegetation.<br />
Vegetatio 44: 81-100.<br />
Beeftink, W.G. 1962. Conspectus of the phanerogamic salt plant communities in the<br />
Netherlands. Biologisch Jaarboek Dodonaea 30: 325-362.<br />
Beeftink, W.G. 1965. De zoutvegetatie van ZW-Nederland beschouwd in Europees verband.<br />
Wageningen, Veenman, Doct. Verh. LH Wageningen, 167p.<br />
Beeftink, W.G. 1966. Vegetation and habitat of the salt-marshes and beach plains in the<br />
south-western part of the Netherlands. Wentia 15: 83-108.<br />
Beeftink, W.G. 1977. The coastal salt-marshes of Western and Northern Europe: an<br />
ecological and phytosociological approach. In: Chapman, V.J. (eds.) Ecosystems of the<br />
World 1. Wet coastal ecosystems. pp. 109-155. Elsevier.<br />
Begon, M., Harper. J.L. & Townsend, C.R. 1990. <strong>Ecology</strong>, individuals, populations and<br />
communities. Blackwell scientific publications. Londan, UK.<br />
Bekker, R.M., Bakker, J.P., Grandin, U., Kalamees, R., Milberg, P., Poschlod, P.,<br />
Thompson, K. & Willems, J.H. 1998. Seed size, shape and vertical distribution in the<br />
soil: indicators of seed longevity. Functional <strong>Ecology</strong> 12: 834-842.<br />
Belyea, L.R. & Lancaster, J. 1999. Assembly rules within a contingent ecology. Oikos 86:<br />
402-416.<br />
Bernhardt, K.G. & Koch, M. 2003. Restoration of a salt-marsh system: temporal change of<br />
plant species diversity and composition. Basic and Applied <strong>Ecology</strong> 4: 441-451.<br />
Bertness, M.D. & Shumway, S.W. 1992. Consumer driven pollen limitation of seed<br />
production in marsh grasses. American Journal of Botany 79: 288-293.<br />
149
Bertness, M.D., Wise C. & Ellison A.M. 1987. Consumer pressure and seed set in a salt-<br />
150<br />
marsh perennial plant community. Oecologia 71: 190–200.<br />
Birth, G.S., Hecht, H.G. 1987. The physics of near-infrared reflectance. In: Williams, P. &<br />
Norris, K. (eds.) Near-infrared Technology in the Agricultural and Food Industries.<br />
pp. 1-15. American Association of Cereal Chemists, St. Paul, MN.<br />
Bockelmann, A.C., Bakker, J.P., Neuhaus, R., Lage, J. 2002. The relation between<br />
vegetation zonation, elevation and inundation frequency in a Wadden Sea salt-marsh.<br />
Aquatic Botany 73: 211–221.<br />
Bockelmann, A.C. & Neuhaus. R. 1999. Competitive exclusion of Elymus athericus from a<br />
high-stress habitat in a European salt-marsh. Journal of <strong>Ecology</strong> 87:503-513.<br />
Boorman, L.A. 1967. Limonium vulgare Mill. and L. humile Mill. Journal of <strong>Ecology</strong> 55:<br />
221–232<br />
Bos, D., Bakker, J.P., de Vries, Y. & van Liesshout, S. 2002. Long-term vegetation changes<br />
in experimentally grazed and ungrazed back-barrier marshes in the Wadden Sea.<br />
Applied Vegetation Science 5: 45-54.<br />
Bos D, Loonen M.J., Stock, M., Hofeditz, F., Van Der Graaf, A.J. & Bakker, J.P. 2005.<br />
Utilisation of Wadden Sea salt-marshes by geese in relation to livestock grazing.<br />
Journal of Nature Conservation 13:1–15.<br />
Bossuyt, B., Cosyns, E. & Hoffmann, M. 2007. The role of soil seed banks in the restoration<br />
of dry acidic dune grassland after burning of Ulex europaea scrub. Applied Vegetation<br />
Science 10: 131-138.<br />
Bossuyt, B. & Hermy, M. 2003. The potential of soil seed banks in the ecological restoration<br />
of grassland and heathland communities. Belgian Journal of Botany 136: 23-34<br />
Bossuyt, B. & Hermy, M. 2004. Seed bank assembly follows vegetation succession in dune<br />
slacks. Journal of Vegetation Science 15: 449-456.
Bossuyt, B., Stichelmans, E. & Hoffmann, M. 2005. The importance of seed bank<br />
knowledge for the restoration of coastal plant communities - a case study of salt-<br />
marshes and dune slacks at the Belgian coast. In: Herrier, J.-L. Mees J. Salman A.<br />
Seys J. Van Nieuwenhuyse H. & Dobbelaere I. (eds.) Proceedings ‘Dunes and<br />
Estuaries 2005’ - International Conference on Nature Restoration Practices in<br />
European Coastal Habitats. pp. 269-278. Koksijde, Belgium, 19-23 September 2005,<br />
269-278. Oostende, VLIZ Special Publication 19.<br />
Bossuyt, B., Van Wichelen, J. & Hoffmann, M. 2007. Predicting future community<br />
composition from random soil seed bank sampling - evidence from a drained lake<br />
bottom. Journal of Vegetation Science 18: 443-450.<br />
Bouchard, V., Tessier, M., Digaire, F., Vivier, J.P., Valéry, L., Gloaguen, J.C. & Lefeuvre,<br />
J.C. 2003. Sheep grazing as management tool in Western European salt-marshes.<br />
Comptes Rendus Biologies 326: 148-157.<br />
Brereton, A.J. 1971. The structure of species populations in the initial stages of salt-marsh<br />
succession. Journal of <strong>Ecology</strong> 59: 321-338.<br />
Brewer, J.S., Levine, J.M. & Bertness, M.D. 1998. Interactive effects of elevation and burial<br />
with wrack on plant community structure in some Rhode Island salt-marshes. Journal<br />
of <strong>Ecology</strong> 86: 125-136.<br />
Brown, V.K. 1990. Insect herbivory and its effect on plant succession. In: Burdon, J.J. &<br />
Leather, S.R. (eds.) Pests, pathogens and plant communities. pp. 275–288. Blackwell,<br />
Oxford.<br />
Brys, R., Jacquemyn, H., Endels, P., De Blust, G. & Hermy, M. 2005. Effect of habitat<br />
deterioration on population dynamics and extinction risks in a previously common<br />
perennial. Conservation Biology 19: 1633-1643.<br />
151
Burrows, C.J. 1990. Processes of vegetation change. The Academic Division of Unwin<br />
152<br />
Hyman Ltd, London, UK.<br />
Caley, M.J. & Schluter, D. 1997. The relationship between local and regional diversity.<br />
<strong>Ecology</strong> 78: 70-80.<br />
Castellanos, E.M., Figueroa, M.E. & Davy, A.J. 1994. Nucleation and facilitation in<br />
saltmarsh succession: interactions between Spartina maritima and Arthrocnemum<br />
perenne. Journal of <strong>Ecology</strong> 82: 239-248.<br />
Castermans, E., 2007. Seed characteristics vary with population age in isolated Aster<br />
tripolium populations. MSc. Thesis, <strong>Gent</strong> Univerity.<br />
Chambers, J.C. 1995. Disturbance, life history, and seed fates in alpine herbfield<br />
communities. American Journal of Botany 82: 421–433.<br />
Chang, E.R. 2006. The role of dispersal constraints in the assembly of salt-marsh<br />
communities. Ph.D. Thesis, University of Groningen, the Netherlands.<br />
Chang, E.R., Jefferies, R.L. & Carleton T.J. 2001. Relationship between vegetation and soil<br />
seed banks in an arctic coastal marsh. Journal of <strong>Ecology</strong> 89: 367-384.<br />
Chang, E.R., Veeneklaas, R.M. & Bakker, J.P. 2007. Seed dynamics linked to variability in<br />
movement of tidal water. Journal of Vegetation Science 18: 253-262.<br />
Chang, E.R., Wolters, M., Bakker, J.P. 2005. Relationship between the vegetation and soil<br />
seed bank in a coastal salt-marsh: predicting constraints in community assembly,<br />
second chapter of Ph.D. thesis. University of Groningen, the Netherlands.<br />
Chapman, V.J. 1974. Salt-marshes and Salt Deserts of the World. Verlag Von J. Cramer,<br />
Lehre. Germany.<br />
Chapman, V.J. 1976. Coastal Vegetation. 2 nd edition. Pergamon Press, Oxford, 292 p.<br />
Christensen, N.L. & Peet, R. 1984. Convergence during secondary forest succession.<br />
Journal of <strong>Ecology</strong> 72: 25-36.
Clements, F.E. 1916. Plant Succession: An Analysis of the Development of Vegetation.<br />
Carnegie Institution of Washington, Washington, DC, 512 p.<br />
Clements, F.E. 1936. Nature and structure of the climax. Journal of <strong>Ecology</strong> 24:252-284.<br />
Connell, J.H. & Slatyer, R.O. 1977. Mechanisms of succession in natural communities and<br />
their role in community stability and organization. The American Naturalist 111:<br />
1119-1144.<br />
Cooper, A. 1982. The effects of salinity and water-logging on the growth and cation uptake<br />
of salt-marsh plants. New Phytologist 90: 263-275.<br />
Costa, C.S.B., Marangoni, J.C. & Azevedo, A.M.G. 2003. Plant zonation in irregularly<br />
flooded salt-marshes: relative importance of stress tolerance and biological<br />
interactions. Journal of <strong>Ecology</strong> 91: 951-965.<br />
Criel, B., Muylaert, W., Hoffmann, M., De Loose, L. & Meire, P. 1999.<br />
Vegetatiemodellering van de buitendijkse gebieden langs de Zeeschelde, 77p.<br />
<strong>Universiteit</strong> <strong>Gent</strong> + Instituut voor Natuurbehoud, <strong>Ghent</strong> & Brussels.<br />
Dalby, D.H. 1963. Seed dispersal in Salicornia pusilla. Nature 199: 197-198.<br />
Dalling, J.W., Swaine, M.D., Garwood, N.C. 1995. Effect of soil depth on seedling<br />
emergence in tropical soil seed-bank investigations. Functional <strong>Ecology</strong> 9:119-121.<br />
Dausse, A., Bonis, A., Bouzillé, J.B. & Lefeuvre, J.C. 2008. Seed dispersal in a polder after<br />
partial tidal restoration: implications for salt-marsh restoration. Applied Vegetation<br />
Science 11: 3-12.<br />
Davidson, D.W. 1993. The effects of herbivory and granivory on terrestrial plant succession.<br />
Oikos 68: 23-35.<br />
Davy, A.J., Bishop, G.F., Costa, C.S.B. 2001. Salicornia L. Biological Flora of the British<br />
Isles. Journal of <strong>Ecology</strong> 89: 681-707.<br />
153
de Leeuw, J. 1992. Dynamics of salt-marsh vegetation. Ph.D. thesis, University of<br />
154<br />
Groningen, the Netherlands.<br />
de Leeuw, J., de Munck, W., Olff, H. & Bakker, J.P. 1993. Does zonation reflect the<br />
succession of salt-marsh vegetation? A comparison of an estuarine and a coastal bar<br />
island marsh in the Netherlands. Acta Botanica Neerlandica 42: 435-445.<br />
de Leeuw, J., Van den Dool, A., de Munck., W., Nieuwenhuize, J. & Beeftink, W.G. 1991.<br />
Factors influencing the soil salinity regime along an intertidal gradient. Estuarine<br />
Coastal and Shelf Science 32: 87- 97.<br />
del Moral, R. 1999. Plant Succession on Pumice at Mount St. Helens, Washington.<br />
American Midland Naturalist 141: 101-114.<br />
del Moral, R. 2007. Limits to convergence of vegetation during early primary succession.<br />
Journal of Vegetation Science 18:479-488.<br />
del Moral, R. & Lacher, I.L. 2005. Vegetation patterns 25 years after the eruption of Mount<br />
St. Helens, Washington, USA. American Journal of Botany 92:1948-1956.<br />
del Moral R., Wood, D.M. & Titus, J.H. 2005. Proximity, microsites, and biotic interactions<br />
during early primary succession. In: V.H., Dale, Swanson, F.J. & Crisafulli C.M.<br />
(eds.) Ecological recovery after the 1980 eruptions of Mount St. Helens. pp. 93–109.<br />
Springer-Verlag, New York, New York, USA.<br />
Devlaeminck, R., Bossuyt, B. & Hermy, M. 2005. Inflow of seeds through the forest edge:<br />
evidence from seed bank and vegetation patterns. Plant <strong>Ecology</strong> 176:1–17.<br />
Devlaeminck, R., Bossuyt, B. & Hermy, M. 2005. Seed dispersal from a forest into adjacent<br />
cropland. Agriculture Ecosystems and Environment 107: 57-64.<br />
Dierschke, J. & Bairlein, F. 2004. Habitat selection of wintering passerines in salt-marshes<br />
of the German Wadden Sea. Journal of Ornithology 145: 48-58.
Dijkema, K. S. 1987. Changes in salt-marsh area in the Netherlands Wadden Sea after 1600.<br />
In: Huiskes, A.H.L., Blom C.W.P.M.& Rozema, J.(eds.) Vegetation between land and<br />
sea. pp. 42-49. Dr. W. Junk Publishers, Dordrecht.<br />
Donelan, M. & Thompson, K. 1980. Distribution of buried viable seeds along a successional<br />
series. Biological Conservation 17: 297-311.<br />
Doody, J.P. 1992. The conservation of British saltmarshes. In: Allen, J.R.L. & Pye, K. (eds.)<br />
Saltmarshes: Morphodynamics, conservation and engineering significance. pp. 80-<br />
114. Cambridge University Press, Cambridge.<br />
Doody, J.P., Johnston, C. & Smith, B. 1993. Directory of the North Sea coastal margin. Joint<br />
Nature Conservation Committee, Peterborough, UK.<br />
Drake, J.A. 1991. Community-assembly mechanics and the structure of an experimental<br />
species ensemble. The American Naturalist 137: 1–26.<br />
Drury, W.H. & Nisbet, I.C.T. 1973. Succession. Journal of the Arnold Arboretum 54: 331-<br />
368.<br />
Duke, J.A. 1983. Handbook of Energy Crops. unpublished.<br />
Duvigneaud, J. & Lambinon, J. 1963. Flore et vegetation halophiles de la rive droite de<br />
l’estuaire de l’IJzer entre Lombartzijde et Nieuport. Lejeunia n.s., 1760p.<br />
Edwards, K.R. & Proffitt, C.E. 2003. Comparison of wetland structural characteristics<br />
between created and natural salt-marshes in southwest Louisiana, USA. Wetlands 23:<br />
344-356.<br />
Eertman, R.H.M., Kornman, B.A., Stikvoort, E. & Verbeek, H. 2002. Restoration of the<br />
Sieperda tidal marsh in the Scheldt estuary, The Netherlands. Restoration <strong>Ecology</strong> 10:<br />
438–449.<br />
Egan, T.P. & Ungar, I.A. 2000. Similarity between seed banks and above-ground vegetation<br />
along a salinity gradient. Journal of Vegetation Science 11: 189-194.<br />
155
Egler, F.E. 1954. Vegetation science concepts. I. Initial floristic composition, a factor in old-<br />
156<br />
field vegetation development. Vegetatio 4: 412-417.<br />
Eilers, H.P. 1979. Production ecology in an Oregon coastal salt-marsh. Estuaries and<br />
Coastal Marine Science 8: 399-410.<br />
Eilertsen, O., Okland, R.H., Okland, T. & Pedersen, O. 1990. Data manipulation and<br />
gradient length estimation in DCA ordination. Journal of Vegetation Science 1: 261-<br />
270.<br />
Ellenberg, H., Weber, H.E., Düll, R., Wirth, V., Werner, W. & Paulißen, D. 1991.<br />
Zeigerwerte von Pflanzen in Mitteleuropa. Scripta Geobotanica 18: 1-248.<br />
Ellison, A.M. 1987. Effects of competition, disturbance and herbivory on Salicornia<br />
europaea. <strong>Ecology</strong> 68:576-586.<br />
Erkkilä, J.B. & Heli, M. 1998. Seed banks of grazed and ungrazed Baltic seashore meadows.<br />
Journal of Vegetation Science 9: 395-408.<br />
Espinar, J.L., Thompson, K. & García, L.V. 2005. Timing of seed dispersal generates a<br />
bimodal seed bank depth distribution. American Journal of Botany 92: 1759-1763<br />
Esselink, P. 2000. Nature management of coastal marshes. Interactions between<br />
anthropogenic influences and natural dynamics. Ph.D. Thesis, University of<br />
Groningen, the Netherlands.<br />
Esselink, P., Fresco, L.F.M., Dijkema, K.S. 2002. Vegetation change in a man-made salt-<br />
marsh affected by a reduction in both grazing and drainage. Applied Vegetation<br />
Science 5: 17-32.<br />
Eviner, V.T. & Hawkes, C.V. 2008. Embracing variability in the application of plant–soil<br />
interactions to the restoration of communities and ecosystems. Restoration <strong>Ecology</strong><br />
16: 713-729.
Falinska, K. 1999. Seed bank dynamics in abandoned meadows during a 20-year period in<br />
the Bialowieza National Park. Journal of <strong>Ecology</strong> 87: 461-475.<br />
Falinski, J.B. 1988. Succession, regeneration and fluctuation in the Bialowieza Forest (NE<br />
Poland). Vegetatio 77: 115–128.<br />
Farrell, T.M. 1991. Models and Mechanisms of Succession: An example from a Rocky<br />
Intertidal Community. Ecological Monographs 61: 95-113.<br />
Fenner, M. 1985. Seed ecology. Chapman & Hall, London, UK.<br />
Fenner, M. 1987. Seedlings. New Phytologist 106: 35–47.<br />
Ferreira, J., Bustamante, M., Garcia-Montiel, D., Caylor, K. & Davidson, E. 2007. Spatial<br />
variation in vegetation structure coupled to plant available water determined by two-<br />
dimensional soil resistivity profiling in a Brazilian savanna. Oecologia 153: 417-430.<br />
Fox, A.D., Kristiansen, J.N., Stroud, D.A. & Boyd, H. 1998. The effects of simulated spring<br />
goose grazing on the growth rate and protein content of Phleum pratense leaves.<br />
Oecologia 116: 154-159.<br />
Fremout, A. 2002. Overview of the tide observations along the Belgian coast: period 1991-<br />
2000 for Nieuwpoort, Oostende and Zeebrugge (Overzicht van de tijwaarnemingen<br />
langs de Belgische kust: periode 1991-2000 voor Nieuwpoort, Oostende en<br />
Zeebrugge). Ministerie van de Vlaamse Gemeenschap, Afdeling Waterwegen Kust:<br />
Oostende, Belgium. 38, bijlagen p.<br />
Frenzen, P.M., Krasny, M. E. & Rigney, L.P. 1988. Thirty-three years of plant succession on<br />
the Katuz Creek mudflow, Mount Rainier National Park, Washington. Canadian<br />
Journal of Botany 66: 130-137.<br />
Funk, D.W., Noel, L.E. & Freeman, A.H. 2004. Environmental gradient, plant distribution,<br />
and species richness in arctic salt-marsh near Prudhoe Bay, Alaska. Wetlands <strong>Ecology</strong><br />
and Management 12: 215-233.<br />
157
Garbutt, A. & Wolters, M. 2008. The natural regeneration of salt-marsh on formerly<br />
158<br />
reclaimed land. Applied Vegetation Science 11: 335-344<br />
Gibson, C.W.D. & Brown, V.K. 1992. Grazing and vegetation change: deflected or modified<br />
succession? Journal of Applied <strong>Ecology</strong> 29: 120-131.<br />
Glenn-Lewin, D.C., Peet, R.K., Veblen, T.T. 1992. Plant Succession: Theory and<br />
Prediction. Chapman and Hall, London, UK, 352 p.<br />
Glenn-Lewin, D.C. & van der Maarel, E. 1992. Patterns and processes of vegetation<br />
dynamics. In: Glenn-Lewin, D.C., Peet, R.K., Veblen, T.T. (eds.) Plant Succession:<br />
Theory and Prediction. pp. 10-44. Chapman and Hall, London, UK.<br />
Goetghebeur, P. 1976. De vegetatie van de slikken en de schorren langs de IJzermonding te<br />
Nieuwpoort( Prov. West-Vlaanderen, Belgie) van 1900 tot Heden. Biologisch<br />
Jaarboek, Dodonaea 44: 163-177.<br />
Goodwin, P., Mehta, A. J. & Zedler, J. B. 2001. Tidal wetland restoration: An introduction.<br />
Journal of Coastal Research 27: 1-3.<br />
Gotelli, N.J. & McCabe, D.J. 2002. Species co-occurrence: a meta-analysis of J.M.<br />
Diamond’s assembly rules model. <strong>Ecology</strong> 83: 2091–2096.<br />
Gough, L. & Grace, J.B. 1998. Herbivore effects on plant species density at varying<br />
productivity levels. <strong>Ecology</strong> 79: 1586-1594.<br />
Grandin, U. 2001. Short-term and long-term variation in seed bank/vegetation relations<br />
along an environmental and successional gradient. Ecography 24: 731-741.<br />
Gray, A.J. 1992. Saltmarsh plant ecology: zonation and succession revisited. In: Allen,<br />
J.R.L. & Pye, K. (eds.) Saltmarshes: Morphodynamics, Conservation and Engineering<br />
Significance. pp. 63–79. Cambridge University Press, Cambridge, UK.<br />
Gray, A.J., Benham, P.E.M. & Raybould, A.F. 1990. Spartina anglica: the evolutionary and<br />
ecological background. In: Gray, A.J. & Benham, P.E.M. (eds.) Spartina anglica – a
esearch review. pp. 5-10. Institute of Terrestrial <strong>Ecology</strong> Research publication.<br />
HMSO, London, UK.<br />
Gray A.J. & Bunce R.G.H. 1972. The ecology of Morecambe Bay. VI. Soils and vegetation<br />
of the salt-marshes: a multivariate approach. Journal of Applied <strong>Ecology</strong> 9: 221–34.<br />
Gray, A.J. & Scott, R. 1977. Biological flora of the British isles: Puccinellia maritima<br />
(Huds.) Parl. (Poa maritima Huds., Glyceria maritima (Huds.) Wahlb.) Journal of<br />
<strong>Ecology</strong> 65: 699-716.<br />
Gray, A.J. & Scott, R. 1977. The ecology of Morecambe Bay. VII. The distribution of<br />
Puccinellia maritima, Festuca rubra and Agrostis stolonifera in the salt-marshes.<br />
Journal of Applied <strong>Ecology</strong> 14: 229-241.<br />
Grime, J.P. 1979. Plant strategies and vegetation processes. Wiley, New York, USA.<br />
Grime, J.P. 2001. Plant strategies, vegetation processes, and ecosystem Properties. 2 nd<br />
edition. John Wiley & Sons, New York, USA.<br />
Grime J.P., Hodgson J.G., Hunt R. 1988. Comparative Plant <strong>Ecology</strong>, Unwin Hyman Ltd,<br />
London, UK.<br />
Groenendijk, A.M., Spieksma, J.G.J. & Vink-Lievaart, M.A. 1987. Growth and interactions<br />
of salt-marsh species under different flooding regimes. In: Huiskes, A.H.L., Blom,<br />
C.W.P.M.& Rozema, J. (eds.) Vegetation between Land and Sea. pp. 236-258. Dr. W.<br />
Junk Publishers, Dordrecht. the Netherlands.<br />
Grootjans, A.P., Everts, H., Bruin, K. & Fresco, L. 2001. Restoration of wet dune slacks on<br />
the Dutch Wadden Sea Islands: Recolonization after large scale sod cutting.<br />
Restoration <strong>Ecology</strong> 9: 137-146.<br />
Grubb, P.J. 1977. The maintenance of species richness in plant communities. The<br />
importance of regeneration niche. Biology Reviews 52: 107–145.<br />
Hafer, E.SE 1975. The Behavior of Domestic Animals. Bailliire, Tindall & Casell, London.<br />
159
Harper, J.L. 1961. Approaches to the study of plant competition. Symposia of the Society for<br />
160<br />
Experimental Biology 15: 1-39.<br />
Heady, H.F., & Child, R.D. 1994. Rangeland ecology & management. Westview Press, Inc.,<br />
Colorado, USA.<br />
Heinze, C., Kiehl, K. & Neuhaus, R. 1999. Vegetation succession over 30 years in the<br />
ungrazed salt-marsh of Suderhafen/Nordstrand. Senckenberiana maritima 29: 63-66.<br />
Hellström, K., Huhta, A.P., Rautio, P., Toumi, J., Oksanen, J.& Laine, K. 2003. Use of<br />
sheep grazing in the restoration of semi-natural meadows in northern Finland. Applied<br />
Vegetation Science 6: 45-52.<br />
Herrier, J.L., Mees, A., Salman, A., Seys, J., Van Nieuwenhuyse, H. & Dobbelaere, I. 2005.<br />
Integrated monitoring of nature restoration along ecotones, the example of the IJzer<br />
Estuary. Proceedings ‘Dunes and Estuaries’. International Conference on Nature<br />
Restoration Practices in European Coastal Habitats. pp. 191-208. Koksijde, Belgium.<br />
Heydemann, B. 1960. Die biozönotische Entwicklung vom Vorland zum Koog.<br />
Vergleichend-ökologische Untersuchungen an der Nordseeküste. Teil 1. Spinnen<br />
(Aranea). Akademie der Wissenschaften und der Literatur. Abhandlungen der<br />
Mathematisch-aturwissenschaftlichenKlasse. Jahrgang, Nr. 11. Wiesbaden, Germany.<br />
Heydemann, B. 1962. Die biozönotische Entwicklung vom Vorland zum Koog.<br />
Vergleichend-ökologische Untersuchungen an der Nordseeküste. Teil 2. Käfer.<br />
Akademie der Wissenschaften und der Literatur. Abhandlungen der Mathematisch-<br />
Naturwissenschaftlichen Klasse. Jahrgang 1962, Nr. 11. Wiesbaden, Germany.<br />
Hill, M.O. 1979. TWINSPAN a fortran program for arranging multivariate data in a ordered<br />
two-way by classificution of the individuals and attributes. Microcomputer Power,<br />
Ithaca, New York. 90 p.
Hillebrand, H. & Blenckner, T. 2002. Regional and local impact on species diversity- from<br />
pattern to process. Oecologia 132: 479-491.<br />
Hocquette, M. 1927. Etude sur la végétation et la flore du littoral de la Mer du Nord de<br />
Nieuport à Sangatte. Archives de botanique, Tome I (1927) Mémoires, 4, 179 p.<br />
Hodgson, J., Clark, D.A. & Mitchell, R.J. 1995. Foraging behavior in grazing animals and<br />
its impact on plant communities. In: Fahey, G.C.J., Collins, M. & Mertens, D.R. (eds.)<br />
Forage quality, evaluation and utilization. pp. 796-827. Madison (Wis.): American<br />
society of agronomy.<br />
Hoffmann, M. 1993. Vegetatiekundig-ecologisch onderzoek van de buitendijkse gebieden<br />
langs de Zeeschelde met vegetatiekartering. 223p. <strong>Gent</strong>, <strong>Universiteit</strong> <strong>Gent</strong> i.o.v.<br />
Instituut voor Natuurbehoud en Rijkswaterstaat, Directie Zeeland.<br />
Hoffmann, M., Hoys, M., Monbaliu, J. & Sas, M. 1996. Ecologisch streefbeeld en<br />
natuurherstelplan voor het integraal kustreservaat ”De IJzermonding“ te Nieuwpoort-<br />
Lombardsijde met civieltechnische realisatiemogelijkheden. <strong>Gent</strong>, <strong>Universiteit</strong> <strong>Gent</strong>,<br />
i.o.v. Aminal, Afd. Natuur.<br />
Hoffmann, M., Adam, S., Baert, L., Bonte, D. Chavatte, N., Claus, R., De Belder, W., De<br />
Fré, B. Degraer, S., De Groote, D., Dekononck, W., Desender, K., Devos, K.,<br />
Engledow, H., Grootaert, P., Hardies, N., Leliaert, F. Maelfait, J.P., Monbaliu, J.,<br />
Pollet, M., Provoost, S., Stichelmans, E., Toorman, E., Van Nieuwenhuyse, H.,<br />
Vercruysse, E., Vincx, M. & Wittoeck, J. 2005. Integrated monitoring of nature<br />
restoration along ecotones, the example of the IJzer Estuary. In: Herrier, J.L., Mees, J.,<br />
Salman, A., Seys, J. Van Nieuwenhuyse, H. & Dobbelaere (eds.) Proceedings of<br />
Dunes and Estuaries. pp. 191-208. Koksijde, Belgium.<br />
161
Hoffmann, M. 2006a. 5. De natuurherstelwerken. In: Hoffmann M. (eds.) Monitoring<br />
162<br />
Natuurherstel IJzermonding 2001-2005. pp. 39-43. <strong>Gent</strong>, <strong>Universiteit</strong> <strong>Gent</strong> i.o.v.<br />
Agentschap voor Natuur en Bos, Cel Kustzonebeheer.<br />
Hoffmann, M. 2006b. Beheerplan VNR De IJzermonding, Brussel, Instituut voor<br />
Natuurbehoud, i.o.v. Agentschap voor Natuur en Bos, Cel Kustzonebeheer, 154p.<br />
Hoffmann, M., Hardies, N., De Fré, B. & Van Nieuwenhuyse, H. 2006a. 11. Biologische<br />
responsvariabelen: vegetatie. In: Hoffmann M. (eds.), Monitoring Natuurherstel<br />
IJzermonding 2001-2005. pp. 121-237. <strong>Gent</strong>, <strong>Universiteit</strong> <strong>Gent</strong> i.o.v. Agentschap voor<br />
Natuur en Bos, Cel Kustzonebeheer.<br />
Hoffmann, M., Herrier, J.L., Leten, M. & Van Nieuwenhuyse, H. 2006b. Beheerplan VNR<br />
De IJzermonding. Brussel, Instituut voor Natuurbehoud i.o.v. Aminal, Afd. Natuur,<br />
154p.<br />
Hoffmann, M., Herrier, J.L., Leten, M. & Van Nieuwenhuyse, H. 2006c. Monitoring<br />
Natuurherstel IJzermonding 2001-2005. <strong>Universiteit</strong> <strong>Gent</strong> en Katholieke <strong>Universiteit</strong><br />
Leuven, Belgium.<br />
Hoffmann, M. & Stichelmans, E. 2006. 9. Monitoring condities; de zaadbank. In Hoffmann<br />
M. (eds.) Monitoring Natuurherstel IJzermonding 2001-2005. pp. 107-113. <strong>Gent</strong>,<br />
<strong>Universiteit</strong> <strong>Gent</strong> i.o.v. Agentschap voor Natuur en Bos, Cel Kustzonebeheer.<br />
Hölzel, N. & Otte, A. 2003. Restoration of a species-rich flood-meadow by topsoil removal<br />
and plant material transfer. Applied Vegetation Science 6: 131–140.<br />
Hosmer, D.W., Lemeshow, S. 2000. Applied logistic regression. John Wiley & Sons, Inc.,<br />
USA. 2 nd edition.<br />
Howe, H.F. & Wesley, L.C. 1988. Ecological relationships of plants and animals. Oxford<br />
University Press, New York, USA. 273 pp.
Huckle, J.M., Potter, J.A. & Marrs, R.H. 2000. Influence of environmental factors on the<br />
growth and interactions between salt-marsh plants: effects of salinity, sediment and<br />
water-logging. Journal of <strong>Ecology</strong> 88: 492–505.<br />
Huiskes, A.H.L., Koutstaal, B.P., Herman, P.M.J., Beeftink, W.G., Markusse, M.M. & de<br />
Munck, W. 1995. Seed dispersal of halophytes in tidal salt-marshes. Journal of<br />
<strong>Ecology</strong> 83: 559-567.<br />
Huisman, J., Olff, H. & Fresco, L.F.M. 1993. A hierarchical set of models for species<br />
response analysis. Journal of Vegetation Science 4: 37-46.<br />
Hülber, K., Ertl, S., Gottfried, M., Reiter, K. & Grabherr, G. 2005. Gourmets or gourmands?<br />
Diet selection by large ungulates in high-alpine plant communities and possible<br />
impacts on plant propagation. Basic and Applied <strong>Ecology</strong> 6: 1-10.<br />
Hupp, J.W., White, R.G., Sedinger, J.S. and Robertson, D.G. 1996. Forage digestibility and<br />
intake by lesser snow geese: effects of dominance and resource heterogeneity.<br />
Oecologia 108: 232-240.<br />
Huston, M.A. 1994. Biology diversity: the coexistence of species on changing landscapes.<br />
Cambridge University Press, Cambridge.<br />
Huston, M. & Smith, T. 1987. Plant succession: life history and competition. The American<br />
Naturalist 130: 168-198.<br />
Hutchings, M.J. 1986. Plant Population Biology: in Methods in Plant <strong>Ecology</strong>, 2 nd edition.<br />
P.D. Moore and S.B. Chapman, Oxford, Blackwell, UK.<br />
Hutchings, N.J. & Gordon, I.J. 2001. A dynamic model of herbivore- plant interactions on<br />
grassland. Ecological Modelling 136: 209-222.<br />
Isaacson, A. & Magnel, L. 1929. Compte rendu de l’herborisation générale sur le littoral<br />
belge en 1929. Bulletin de la Société Royale de Botanique de Belgique 62: 171-177.<br />
163
Janssen, J.A.M. & Schaminée, J.H.J. 2003. Europese Natuur in Nederland – Habitattypen.<br />
164<br />
KNNV Uitgeverij, Utrecht, the Netherlands.<br />
Jensen, A. 1985. The effect of cattle and sheep grazing on salt-marsh vegetation at<br />
Skallingen, Denmark. Vegetatio 60: 37-48.<br />
Jigorel, A. 2000. Sediment dynamics. Eurossan Final Report. Program ‘Environment and<br />
Climate, GD XII/D1, sub program “Functioning of Ecosystem”. Work program PL<br />
970655, August 2000.<br />
Jonathan, M.H., Rob, H.M. & Jacqueline, A.P. 2002. Interspecific and intraspecific<br />
interactions between salt-marsh plants: integrating the effects of environmental factors<br />
and density on plant performance. Oikos 96: 307–319.<br />
Kahmen, S. & Poschlod, P. 2004. Plant functional trait responses to grassland succession<br />
over 25 years. Journal of Vegetation Science 15: 21–32.<br />
Kalamees, R. & Zobel, M. 1998. Soil seed bank composition in different successional stages<br />
of a species rich wooded meadow in Laelatu, Western Estonia. Acta Oecologica 19:<br />
175-180.<br />
Kalliola, R., Salo, J., Puhakka, M. & Rajasilta, M. 1991. New Site Formation and<br />
Colonizing Vegetation in Primary Succession on the Western Amazon Floodplains.<br />
Journal of <strong>Ecology</strong> 79: 877-901.<br />
Keddy, P.A. 2000. Wetland <strong>Ecology</strong>: Principles and Conservation. Cambridge University<br />
Press, Cambridge, UK.<br />
Keddy, P.A. & Reznicek, A.A. 1986. Great Lakes vegetation dynamics: the role of<br />
fluctuating water levels and buried seeds. Journal of Great Lakes Research 12: 25 36.<br />
Kent, M. & Coker, P. 1995. Vegetation Description and Analysis, a Practical Approach.<br />
John Wiley & sons, New York, USA.
Kiehl, K. 1997. Vegetationsmuster in Vorlandsalzwiesen in Abhängigkeit von Beweidung<br />
und abiotischen Standortfaktoren. Mitteilungen der AG Geobotanik Schleswig-<br />
Holstein u. Hamburg, Germany.<br />
Kiehl, K., Eischeid, I., Gettner, S. & Walter, J. 1996. Impact of different sheep grazing<br />
intensities on salt-marsh vegetation in northern Germany. Journal of Vegetation<br />
Science 7: 99-106.<br />
Kiehl, K., Gettner, S., Heinze, C. & Stock, M. 2000. Langfristige Vegetationsveränderungen<br />
im Vorland der hamburger hallig und ihre Bedeutung für herbivore Vögel. In: M.<br />
Stock & K. Kiehl (eds.). Die Salzwiesen der Hamburger Hallig. Schriftenreihe des<br />
Nationalparks Schleswig- Holsteinisches Wattenmeer 11: 66-73.<br />
Kiehl, K., Schroder, H. & Stock, M. 2007. Long-term vegetation dynamics after land-use<br />
change in Wadden Sea salt-marshes. Restoration of Coastal Ecosystems, Coastline<br />
Reports 7: 17-24.<br />
Kiehl, K. & Wagner, C. 2006. Effect of hay transfer on long-term establishment of<br />
vegetation and grasshoppers on former arable fields. Restoration <strong>Ecology</strong> 14:157–166.<br />
King, S. E. & Lester, J. N. 1995. Pollution Economics. The value of salt-marshes as a sea<br />
defence. Marine Pollution Bulletin 30: 180-189.<br />
Kirmer, A., Tischew, S., Ozinga, W.A., von Lampe, M., Baasch, A. & van Groenendael,<br />
J.M. 2008. Importance of regional species pools and functional traits in colonization<br />
processes: predicting re-colonization after large-scale destruction of ecosystems.<br />
Journal of Applied <strong>Ecology</strong> 45: 1523–1530<br />
Kleyer, M., Feddersen, H. & Bockholt, R. 2003. Secondary succession on a high salt-marsh<br />
at different grazing intensities. Journal of Coastal Conservation 9: 123-134.<br />
165
Klotzli, F. & Grootjans, A.P. 2001. Restoration of natural and semi-natural wetland<br />
166<br />
ecosystems in Central Europe: Progress and predictability. Restoration <strong>Ecology</strong> 9:<br />
209-219.<br />
Knevel, I.C., Bekker, R.M., Bakker, J.P. & Kleyer, M. 2003. Life-history traits of the NW<br />
European flora: the LEDA database. Journal of Vegetation Science 14: 611–614.<br />
Koutstaal, B.P., Markusse, M. M. & de Munck, W. 1987. Aspects of seed dispersal by tidal<br />
movements. In: Huiskes, A.H.L., Blom, C.W.P.M. & Rozema, J. (eds.) Vegetation<br />
between land and sea: structure and processes. pp. 226-233. Dr W. Junk Publishers,<br />
Dordrecht, the Netherlands.<br />
Laffaille, P., Lefeuvre, J.C. & Feunteun, E. 2000. Impact of sheep grazing on juvenile sea<br />
bass, Dicentrarchus labrax L., in tidal salt-marshes. Biological Conservation 96: 271-<br />
277.<br />
Laffaille, P., Pétillon, J., Parlier, E., Valéry, L., Aubert, C., Ysnel, F., Radureau, A.,<br />
Feunteun, E. & Lefeuvre, J.C. 2005. Does the invasive plant Elymus athericus modify<br />
fish diet in tidal salt-marshes? Estuarine, Coastal and Shelf Science 65: 739-746.<br />
Lambinon, J., De Langhe, J.-E., Delvosalle, L. & Duvigneaud, J. 1998. Flora van België,<br />
het Groothertogdom Luxemburg, Noord-Frankrijk en de aangrenzende gebieden<br />
(Pteridofyten en Spermatofyten). Nationale Plantentuin van Belgie, Meise, Belgie,<br />
1091 p.<br />
Lamoot, I., Callebaut, J., Degezelle, T., Demeulenaere, E., Laquière, J., Vandenberghe, C. &<br />
Hoffmann, M. 2004. Eliminative behaviour of free-ranging horses: do they show<br />
latrine behaviour or do they defecate where they graze? Applied Animal Behaviour<br />
Science 86: 105-121.<br />
Lamoot, I., Meert, C. & Hoffmann, M. 2005a. Habitat use of ponies and cattle foraging<br />
together in a coastal dune area. Biological Conservation 122: 523–536.
Lamoot, I., Vandenberghe, C., Bauwens D. & Hoffmann, M. 2005b. Grazing behaviour of<br />
free-ranging donkeys and Shetland ponies in different reproductive states. Journal of<br />
Ethology 23: 19–27.<br />
Langlois, E., Bonis, A. & Bouzille, J.B. 2003. Sediment and plant dynamics in salt-marshes<br />
pioneer zone: Puccinellia maritima as a key species? Estuarine, Coastal and Shelf<br />
Science 56: 239-249.<br />
Lavorel, S., Debussche, M., Lebreton, J.D. & Lepart, J. 1993. Seasonal patterns in the seed<br />
bank of Mediterranean old-field. Oikos 67: 114-128.<br />
Leendertse, P.C. 1995. Impact of nutrients and heavy metals on salt-marsh vegetation in the<br />
Wadden Sea. <strong>PhD</strong> Thesis, University of Amsterdam, Amsterdam, the Netherlands.<br />
Leendertse, P.C., Roozen, A.J.M. & Rozema, J. 1997. Long-term changes (1953-90) in the<br />
salt-marsh vegetation at the Boschplaat on Terschelling in relation to sedimentation<br />
and flooding. Plant <strong>Ecology</strong> 132: 49-58.<br />
Lefeuvre, J.C., Bouchard, V., Feunteun, E., Grare, S., Laffaille, P. & Radureau, A. 2000.<br />
European salt-marshes diversity and functioning: the case study of the Mont Saint-<br />
Michel bay, France. Wetland <strong>Ecology</strong> and Management 8: 147–161.<br />
Leishman, M.R. 1999. How well do plant traits correlate with establishment ability?<br />
Evidence from a study of 16 calcareous grassland species. New Phytologist 141: 487-<br />
496.<br />
Lepš, J., Michálek, J., Rauch, O. & Uhlík, P. 2000. Early succession on plots with the upper<br />
soil horizon removed. Journal of Vegetation Science 11: 259-264.<br />
Lepš, J. & Rejmánek, M. 1991. Convergence or divergence: what should we expect from<br />
vegetation succession? Oikos 62: 261-264.<br />
Lepš, J. & Šmilauer, P. 2005. Multivariate analysis of ecological data using CANOCO.<br />
Cambridge University Press. UK.<br />
167
Levine, J.M., Brewer, J.S. & Bertness, M.D. 1998. Nutrients, competition and plant zonation<br />
168<br />
in a New England salt-marsh. Journal of <strong>Ecology</strong> 86: 285-292.<br />
Londo, G. 1976. The decimal scale for relevés of permanent quadrates. Vegetatio 33: 61-64.<br />
Looney, P.B. & Gibson, D.J. 1995. The relationship between the soil seed bank and above-<br />
ground vegetation of a coastal barrier island. Journal of Vegetation Science 6: 825-<br />
836.<br />
Louda, S.M. 1983. Seed predation and seedling mortality in the recruitment of a shrub,<br />
Haplopappus venetus (Asteraceae), along a climatic gradient. <strong>Ecology</strong> 64: 511-521.<br />
Louda, S.M. 1989. Predation in the dynamics of seed generation. In: Leck, M.A.,<br />
Parker,V.T. & Simpson, R.L. (eds.) <strong>Ecology</strong> of Soil Seed Banks. pp. 25–51. Academic<br />
Press, New York, UK.<br />
Luken, J.O. 1990. Directing Ecological Succession. Chapman & Hall, London, UK.<br />
Major, J. & Pyott, W.T. 1966. Buried viable seeds of two California bunchgrass sites and<br />
their bearing on the definition of a flora. Vegetatio 13: 253-282.<br />
Marani, M., Belluco, E., D’Alpaos, A. Defina, A., Lanzoni, S. & Rinaldo, A. 2003. On the<br />
drainage density of tidal networks. Water Resources Research 39, 1040.<br />
Marañón, T. 1998. Soil seed bank and community dynamics in an annual-dominated<br />
Mediterranean salt-marsh. Journal of Vegetation Science 9: 371-378.<br />
Marrs, R.H., Roberts, R.D., Skeffington, R.A. & Bradshaw, A.D. 1983. Nitrogen and the<br />
development of ecosystems. In: Lee, J.A., McNeill, S. & Rorison, I.H. (eds.) Nitrogen<br />
as an Ecological factor. pp. 113- 136. Blackwell Scientific Publications, Oxford, UK.<br />
Massart, J. 1908. Les districts littoraux et alluviaux. In: Bommer, C. & Massart, J. (eds.) Les<br />
aspects de la végétation en Belgique. Bruxelles, Jardin botanique de l’Etat. 86 foto’s,<br />
30 × 40 cm.
Mayer, A.M. & Poljakoff-Mayber, A. 1982. The germination of seeds, 3 rd edition. Pergamon<br />
Press, New York, USA.<br />
Mill, L.H. & Boorman, L.A. 1967. Limonium Vulgare. Journal of <strong>Ecology</strong> 55: 221-232.<br />
Mayhew, P. & Houston, D. 1999. Effects of winter and early spring grazing by Wigeon<br />
Anas penelope on their food supply. Ibis 141: 80-84.<br />
McClanahan, T.R. 1986. The effect of seed source on primary succession in a forest<br />
ecosystem. Vegetatio 65: 175-178.<br />
McLendon, T. & Redente, E.F. 1990. Succession patterns following soil disturbance in a<br />
sagebrush steppe community. Oecologia 65: 293-300.<br />
Milberg, P. 1995. Soil seed bank after eighteen years of succession from grassland to forest.<br />
Oikos 72: 3–13.<br />
Mill, L.H. & Boorman, L.A. 1967. Limonium Vulgare. Journal of <strong>Ecology</strong> 55: 221-232.<br />
Milotic, T., Ebrahimi, A. & Hoffmann, M. 2008. The “perfect“ grazing mangament. How to<br />
choose best suited Number and species of herbivore? 6th European Conference on<br />
Ecological Restoration <strong>Ghent</strong>, Belgium, 8-12/09/2008.<br />
Möller, I., Spencer, T., French, J.R., Leggett, D.J. & Dixon, A.M. 1999. Wave<br />
transformation over salt-marshes: a field and numerical modelling study from North<br />
Norfolk, England. Estuarine,Coastal and Shelf Science 49: 411-426.<br />
Molles, M.C. 2005. <strong>Ecology</strong>, concepts and applications. 3 rd edition, the McGraw-Hill<br />
companies. USA.<br />
Morisawa, T.L. 1999. Salsola kali in: The nature conservancy wild land weeds management<br />
and research, http://tncweeds.ucdavis.edu.<br />
Morzaria-Luna, H.N. & Zedler, J.B. 2007. Does seed availability limit plant establishment<br />
during salt-marsh restoration? Estuaries 30:12-25.<br />
169
Myster, R.W. & Pickett, S.T.A. 1990. Initial conditions, history and successional pathways<br />
170<br />
in ten contrasting old fields. American Midland Naturalist 124: 231-238.<br />
Naeth, M.A., Bailey, A.W., Pluth, D.J., Chanasyk, D.S. & Hardin, R.T. 1991. Grazing<br />
impact on litter and soil organic matter in mixed prairie and fescue grassland<br />
ecosystems of Alberta. Journal of Range Management 44: 7-12.<br />
Naidoo, G., McKee, K.L. & Mendelssohn, I.A. 1992. Anatomical and Metabolic Responses<br />
to Water-logging and Salinity in Spartina alterniflora and S. patens (Poaceae).<br />
American Journal of Botany 79: 765-770<br />
Ngai, J.T. & Jefferies, R.L. 2004. Nutrient limitation of plant growth and forage quality in<br />
Arctic coastal marshes. Journal of <strong>Ecology</strong> 92: 1001–1010.<br />
Noe, G.B. & Zedler, J.B. 2000. Differential effects of four abiotic factors on the germination<br />
of salt-marsh annuals. American Journal of Botany 87: 1679-1692<br />
Noon, K.F. 1996. A model of created wetland primary succession. Landscape Urb. Plan. 34:<br />
97-123.<br />
Noy-Meir, I., Gutman, M. & Kaplan, Y. 1989. Responses of Mediterranean grassland plants<br />
to grazing and protection. Journal of <strong>Ecology</strong> 77: 290-310.<br />
Odland, A. & del Moral, R. 2002. Thirteen years of wetland vegetation succession following<br />
a permanent drawdown, Myrkdalen Lake, Norway. Plant <strong>Ecology</strong> 162: 185-198.<br />
Odum, E.P. 1969. The strategy of ecosystem development. Science 164: 262–270.<br />
Odum, E.P. 1971. Fundamentals of <strong>Ecology</strong>, 3 rd edition. Saunders, Philadelphia, PA, USA,<br />
544 p.<br />
Økland R. 1999. On the variation explained by ordination and constrained ordination axes.<br />
Journal of Vegetation Science 10: 131-136<br />
Oksanen, J. & Tonteri T. 1995. Rate of compositional turnover along gradients and total<br />
gradient length. Journal of Vegetation Science 6: 815-824.
Olff, H., Bakker, J.P. & Fresco, L.F.M. 1988. The effect of fluctuations in tidal inundation<br />
frequency on salt-marsh vegetation. Vegetatio 78: 13-19.<br />
Olff, H., de Leeuw, J., Bakker, J.P., Platerink, R.J. & van Wijnen, H.J. 1997. Vegetation<br />
succession and herbivory in a salt-marsh: changes induced by sea level rise and silt<br />
deposition along an elevational gradient. Journal of <strong>Ecology</strong> 85:799-814.<br />
Olff, H., Vera, F.W.M., Bakker, E.S., Gleichman, J.M., De Maeyer, K. & Smit, R. 1999.<br />
Shifting mosaics in grazed woodlands driven by the alternation of plant facilitation and<br />
competition. Plant Biology 1: 127-137.<br />
Osbornova, J., Kovarova, M., Leps, J. & Prach K. 1990. Succession in Abandoned Fields.<br />
Studies in Central Bohemia, Czechoslovakia. Kulver Academic Publishers, Dordrecht,<br />
the Netherlands 168 p.<br />
Othman, S.B. 1980. The distribution of salt-marsh plants and its relation to edaphic factors<br />
with particular reference to Puccinellia maritima and Spartina townsendii. Ph.D.<br />
Thesis, University of Essex, Colchester, UK.<br />
Ozinga, W.A., Bekker, R.M., Schamineé, J.H.J. & van Groenendael, J.M. 2004. Dispersal<br />
potential in plant communities depends on environmental conditions. Journal of<br />
<strong>Ecology</strong> 92: 767–777.<br />
Ozinga, W.A., Hennekens, S.M., Schaminée, J.H.J., Bekker, R.M., Prinzing, A., Bonn, S.,<br />
Poschlod, P., Tackenberg, O., Thompson, K., Bakker, J.P. & van Groenendael, J.M.<br />
2005. Assessing the relative importance of dispersal in plant communities using an<br />
ecoinformatics approach. Folia Geobotanica 40: 53–67.<br />
Ozinga, W.A. & Schaminée, J.H.J. 2005. Target species – Species of European concern. A<br />
database driven selection of plant and animal species for the implementation of the<br />
PAN European Network. Alterra report 1119. Alterra, Wageningen, the Netherlands.<br />
171
Packham, J.R. & Willis, A.J. 1997. <strong>Ecology</strong> of dunes, salt-marsh and shingle. Published by<br />
172<br />
Chapman & Hall. London. UK. 90 p.<br />
Page, R.R., da Vinha, S.G. & Agnew, A.D.Q. 1985. The reaction of some sand dune plant<br />
species to experimentally imposed environmental change: a reductionist approach to<br />
stability. Vegetatio 61: 105-114.<br />
Patridge, T.R. 1989. Soil seed banks of secondary vegetation on the Port Hills and Banks<br />
Peninsula, Canterbury, New Zealand, and their role in succession. New Zealand<br />
Journal of Botany 27: 421-435.<br />
Pavlů, V., Hejeman, M., Pavlů, L., Gaisler, J. & Nežerková, P. 2006. Effect of continuous<br />
grazing on forage quality, quantity and animal performance. Agriculture, Ecosystems<br />
and Environment 113: 349-355.<br />
Peach, M. & Zedler, J.B. 2006. How tussocks structure sedge meadow vegetation. Wetlands<br />
26: 322–335.<br />
Peart, H.M. 1984. The influence of diaspore morphology and soil surface properties on the<br />
distribution of grasses. Journal of <strong>Ecology</strong> 72: 437-453.<br />
Peco, B., Ortego, M. & Levassor, C. 1998. Similarity between seed bank and vegetation in<br />
Mediterranean grassland: a predictive model. Journal of Vegetation Science 9: 815-<br />
828.<br />
Pehrsson, O. 1988. Effects of grazing and inundation on pasture quality and seed production<br />
in a salt-marsh. Vegetatio 74: 113-124.<br />
Pétillon, J., Georges, A., Canard, A., Lefeuvre, J.C., Bakker, J.P. & Ysnel, F. 2008.<br />
Influence of abiotic factors on spider and ground beetle communities in different salt-<br />
marsh systems. Basic and Applied <strong>Ecology</strong> 9: 743-751.
Pétillon, J., Georges, A., Canard, A. & Ysnel, F. 2007. Impact of cutting and sheep-grazing<br />
on ground-active spiders and ground beetles in some intertidal salt-marshes (Western<br />
France). Animal Biodiversity and Conservation 30: 201-209.<br />
Pétillon, J., Ysnel, F., Canard, A. & Lefeuvre, J.C. 2005. Impact of an invasive plant<br />
(Elymus athericus) on the conservation value of tidal salt-marshes in western France<br />
and implications for management: responses of spider populations. Biological<br />
Conservation 126: 103-117.<br />
Petriccione, B. 2005. Short-term changes in key plant communities of Central Apennines<br />
(Italy). Acta Botanica Gallica 152: 545-561.<br />
Pickett, S.T.A. & Cadenasso, M.L. 2005. Vegetation dynamics. In: van der Maarel, E. (eds.)<br />
Vegetation ecology. pp. 172-198. Blackwell Publishing, Oxford, UK.<br />
Pickett, S.T.A., Cadenasso, M.L. & Bartha, S. 2001. Implications from the Buell-Small<br />
Succession Study for Vegetation Restoration. Applied Vegetation Science 4: 41-52.<br />
Pickett, S.T.A., Collins, S.L. & Armesto, J.J. 1987. A hierarchical consideration of causes<br />
and mechanisms of succession. Vegetatio 69: 109-114.<br />
Piedboeuf, N. & Gauthier, G. 1999. Nutritive quality of forage plants for greater snow goose<br />
goslings: when is it advantageous to feed on grazed plants? Canadian Journal of<br />
Zoology-Revue Canadienne de Zoologie 77: 1908-1918.<br />
Pierce, S.M. & Cowling, R.M. 1991. Disturbance regimes as determinants of seed banks in<br />
coastal dune vegetation of the Southeastern Cape. Journal of Vegetation Science 2:<br />
403–412.<br />
Pire, L. 1862. Premiere herborisation de la Societe Royale de Botanique de Belgique. 1:<br />
110-130.<br />
173
Poschlod, P., Tackenberg, O. & Bonn, S. 2005. Plant dispersal potential and its relation to<br />
174<br />
species frequency and co-existence. In: van der Maarel, E. (eds.) Vegetation <strong>Ecology</strong>.<br />
pp. 147-171. Blackwell Science Ltd. Malden, USA.<br />
Prach K. & Pyšek, P. 1999. How do species dominating in succession differ from others?<br />
Journal of Vegetation Science 10: 383–392.<br />
Prach, K., Pyšek, P. & Bastl, M. 2001. Spontaneous vegetation succession in human-<br />
disturbed habitats: A pattern across seres. Applied Vegetation Science 4: 83-88.<br />
Prach, K., Pyšek, P. & Smilauer, P. 1993. On the rate of succession. Oikos 66: 343-346.<br />
Price, M. & Jenkins S.H. 1986. Rodents as seed consumers and dispersers. In: Murray, D.<br />
(eds.). Seed dispersal. pp. 136-149. Academic Press, Sydney, Australia.<br />
Provoost, S., Ampe, C., Bonte, D., Cosyns, E., Hoffmann, M. 2002. <strong>Ecology</strong>, management<br />
and monitoring of dune grassland in Flanders, Belgium. In: Gomes, F.V. (eds.)<br />
Littoral 2002: 6th International Symposium Proceedings: a multi-disciplinary<br />
Symposium on Coastal Zone Research, Management and Planning. pp. 11-20. Porto,<br />
22-26 September 2002 volume 2.<br />
Pysek, P. & Leps, J. 1991. Response of a weed community to nitrogen fertilizer: a<br />
multivariate analysis. Jouirnal of Vegetation Science 2: 237-244.<br />
Pywell, R.F., Bullock, J.M., Roy, D.B., Warman, L.I.Z., Walker, K.J. & Rothery, P. 2003.<br />
Plant traits as predictors of performance in ecological restoration. Journal of Applied<br />
<strong>Ecology</strong> 40: 65–77.<br />
Qu, X.X., Huang, Z.Y., Baskin, J.M., Baskin, C.C. 2008. Effect of temperature, light and<br />
salinity on seed germination and radicle growth of the geographically widespread<br />
halophyte shrub Halocnemum strobilaceum. Annual of Botany 101: 293-299.
Ramseier, D. 2000. Why remove the topsoil for fen restoration? Influence of water table,<br />
nutrients and competitors on the establishment of four selected plant species. Bulletin<br />
of the Geobotanical Institute ETH 66: 25–35.<br />
Rand, T.A. 2000. Seed dispersal, habitat suitability and the distribution of halophytes across<br />
a salt-marsh tidal gradient. Journal of <strong>Ecology</strong> 88: 608 - 621<br />
Ranwell, D.S., Bird, E.C.F., Hubbard, J.C.E. & Stebbings, R.E. 1964. Spartina salt-marshes<br />
in southern England. V. Tidal submergence and chlorinity in Poole Harbour. Journal<br />
of <strong>Ecology</strong> 52: 627-641.<br />
Reading, C.J., Garbutt, R.A., Watts, C.W., Rothery, P., Turk, A., Yates, M., Boffey, c.<br />
Saunders J. & Wolters, M. 2008. Managed realignment at Tollesbury. R&D Technical<br />
Report FD 1922/TR. London, UK.<br />
Rehounková, K. & Prach, K. 2006. Spontaneous vegetation succession in disused gravel and<br />
pits: role of local site and landscape factors. Journal of Vegetation Science 17: 583–<br />
590.<br />
Richards, C.L., Hamrick, J.L., Donovan, L.A. & Mauricio, R. 2004. Unexpectedly high<br />
clonal diversity of two salt-marsh perennials across a severe environmental gradient.<br />
<strong>Ecology</strong> Letters 7: 1155–1162.<br />
Ridley, H.N. 1930. The dispersal of plants throughout the word. Reeve & Co., Ashford, UK.<br />
Rieley, J.O., Richards, P.W. & Bebbington, D.L. 1979. The ecological role of bryophytes in<br />
a North Wales woodland. Journal of <strong>Ecology</strong> 67: 497-527.<br />
Roozen, A.J.M. & Westhoff, V. 1985. A long-term study on salt-marsh succession using<br />
permanent plots. Vegetatio 61: 23-32.<br />
Rowcliffe, J.M., Watkinson, A.R., Sutherland, W.J. & Vickery, J.A. 1995. Cyclic winter<br />
grazing patterns in Brent geese and the regrowth of salt-marsh grass. Functional<br />
<strong>Ecology</strong> 9: 931-941.<br />
175
Rozema, J. & Blom B. 1977. Effects of salinity and inundation on the growth of Agrostis<br />
176<br />
stolonifera and Juncus gerardii. Journal of <strong>Ecology</strong> 65: 213-222.<br />
Rozema, J. & van Diggelen, D.J. 1991. A comparative study of growth and photosynthesis<br />
of four halophytes in response to salinity. Acta Oecologia 12: 673-681.<br />
Rubio-Casal, A.E., Castillo, J.M., Luque, C.J. & Figueroa, M. E. 2003. Influence of salinity<br />
on germination and seeds viability of two primary colonizers of Mediterranean salt<br />
pans. Journal of Arid Environments 53: 145–154.<br />
Ruess, R.W. & Mc Naughton, S.J. 1987. Grazing and the dynamics of nutrient and energy<br />
regulated microbial processes in the Serengeti grasslands. Oikos 49: 101-110.<br />
Rydin H. & Borgegard S.O. 1988. Plant species richness on islands over a century of<br />
primary succession: Lake Hjälmaren. Journal of <strong>Ecology</strong> 69: 916- 27.<br />
Ryser, P. 1990. Influence of gaps and neighbouring plants on seedlings establishment in<br />
limestone grassland. Experimental field studies in northern Switzerland.<br />
Veröffentlichungen des Geobot. Inst. Der ETH, Stiftung Rübel, Zürich, Switzerland.<br />
Scholten, M. & Rozema, J. 1990. The competitive ability of Spartina anglica on Dutch salt-<br />
marshes. In: Gray, A.J. & Benham, P.E.M. (eds.) Spartina angelica a Research<br />
Review. pp. 39-40. London. UK.<br />
Schröder, H.K., Kiehl, K. & Stock. M. 2002. Directional and non-directional vegetation<br />
changes in a temperate salt-marsh in relation to biotic and abiotic factors. Applied<br />
Vegetation Science 5: 33-44.<br />
Schwabe, A., Remy, D., Assmann, A., Kratochwil, A., Mährlein, A., Nobis, M., Storm, C.,<br />
Zehm, A., Schlemmer, H., Seuß, R., Bergmann, S., Eichberg, C., Menzel, U.,<br />
Persigehl, M., Zimmermann, K. & Weinert, M. 2002. Inland Sand Ecosystems:<br />
dynamics and restitution as a consequence of the use of different grazing systems. In:
Redecker, B., Finck, P., Härdtle, W., Riecken, U. & Schröder, E. (eds.): Pasture<br />
Landscapes and Nature Conservation. pp. 239-252. Springer, Heidelberg, Berlin.<br />
Sem, G. & Enright, N.J. 1996. The relationship between seed rain and the soil seed bank in a<br />
temperate rainforest stand near Auckland, New Zealand. New Zealand Journal of<br />
Botany 34: 215-226.<br />
Shiels, A.B., West, C.A., Weiss, L. Klawinski, P.D. & Walker, L.R. 2008. Soil factors<br />
predict initial plant colonization on Puerto Rican landslides. Plant <strong>Ecology</strong> 195: 165-<br />
178.<br />
Shmida, A. & Ellner, A. 1984. Coexistence of plant species with similar niches. Vegetatio<br />
58: 29-55.<br />
Shugart, H.H. & Urban, D.L. 1988. Scale, synthesis, and Ecosystem Dynamics. In:<br />
Pomeroy, L.R. & Alberts, J.J. (eds.) Concepts of ecosystem ecology. pp. 138-174.<br />
Springer-Verlag New York Inc, USA.<br />
Shumway, S.W. & Bertness, M.D. 1992. Salt stress limitation of seedling recruitment in a<br />
salt-marsh plant community. Oecologia 92: 490-497.<br />
Silvestri, S. & Marani, M. 2004. Salt-marsh vegetation and morphology: Basic physiology,<br />
modeling and remote sensing observations. In: Fagherazzi, S., Blum, L.& Marani, M.<br />
(eds.) Ecogeomorphology of tidal marshes. American Geophysical union, Coastal and<br />
Estuarine monograph series.<br />
Silvestri, S., Defina, A. & Marani M. 2005. Tidal regime, salinity and salt-marsh plant<br />
zonation. Estuarine Coastal and Shelf Science 62: 119-130.<br />
Smith, T.M. & Huston, M.A. 1989. A theory of the spatial and temporal dynamics of plant<br />
communities. Vegetatio 83: 49-69.<br />
177
Smith, T.B., Kark, S., Schneider, C.J., Wayne, R.K. & Moritz, C. 2001. Biodiversity<br />
178<br />
hotspots and beyond: the need for preserving environmental transitions. TREE 16:<br />
431-439.<br />
Smits, N.A.C., Schaminee, J.H.J. & van Duuren, L. 2002. 70 years of permanent plot<br />
research in the Netherlands. Applied Vegetation Science 5: 121–126.<br />
Southall, E.J., Dale, M.P. & Kent, M. 2003. Spatial and temporal analysis of vegetation<br />
mosaics for conservation: poor fen communities in a Cornish valley mire. Journal of<br />
Biogeography 30: 1427-1443.<br />
Staniforth, R.J., Griller, N. & Lajzerowicz, C. 1998. Soil seed banks from coastal subarctic<br />
ecosystems of Bird Cove, Hudson Bay. Ecoscience 5: 241-249.<br />
Stichelmans, E. 2002. Zaadbankanalyse in functie van natuurontwikkeling: de case-studie<br />
IJzermonding. MSc. thesis, <strong>Ghent</strong> University, Belgium<br />
Stoutjesdijk, P. & Barkman, J.J. 1992. Microclimate, vegetation and fauna. Opulus Press,<br />
Uppsala, Zweden.<br />
Stroh, M., Storm, C., Zehm, A. & Schwabe, A. 2002. Restorative grazing as a tool for<br />
directed succession with diaspore inoculation: the model of sand ecosystems.<br />
Phytocoenologia 32: 595-625.<br />
Sǜß, K. 2005, Succession versus grazing: effects on the vegetation of inland sand<br />
ecosystems. Ph.D. Thesis, Frankfurt am Main, Germany.<br />
't Mannetje L .2000. Measuring biomass of grassland vegetation. In:’t Mannetje L & Jones<br />
R.M. (eds.) Field and laboratory methods for grassland and animal production<br />
research. pp: 151-177. CABI, UK.<br />
Taddese, G., Saleem, M.A.M., Abyie, A. & Wagnew, A. 2002. Impact of grazing on plant<br />
species richness, plant biomass, plant attribute, and soil physical and hydrological
properties of vertisol in East African Highlands. Environmental Management 29: 279-<br />
289.<br />
Tahmasebi Kohyani, P., Bossuyt, B., Bonte, D. & Hoffmann, M. 2008. Grazing as a<br />
management tool in dune grassland: evidence of soil and scale dependence of the<br />
effect of large herbivores on plant diversity. Biological Conservation 141: 1687-1694.<br />
Tatyana, A.R. 2000. Seed dispersal, habitat suitability and the distribution of halophytes<br />
across a salt-marsh tidal gradient. Journal of <strong>Ecology</strong> 88: 608-621.<br />
ter Braak, C. J. F. & Smilauer, P. 1998. CANOCO Reference Manual and User's Guide to<br />
Canoco for Windows: Software for Canonical Community Ordination (version 4).<br />
Microcomputer Power, Ithaca, NY USA, 352 p.<br />
ter Heerdt, G.N.J., Verweij, G.L., Bekker, R.M. & Bakker, J.P. 1996. An improved method<br />
for seed bank analysis: seedling emergence after removing the soil soil by sieving.<br />
Functional <strong>Ecology</strong> 10: 144-151.<br />
Tessier, M., Gloaguen, J.C. & Lefeuvre, J.C. 2000. Factors affecting the population<br />
dynamics of Suaeda maritima at initial stages of development. Journal of Plant<br />
<strong>Ecology</strong> 147: 193-203.<br />
Tessier, M., Vivier, J.P., Ouin, A., Gloaguen, J.C. & Lefeuvre, C. 2003. Vegetation<br />
dynamics and plant species interactions under grazed and ungrazed condition in a<br />
western European salt-marsh. Acta Oecologica 24: 103-111.<br />
Thom, R.M., Zeigler, R. & Borde, A.B. 2002. Floristic development patterns in a restored<br />
Elk River Estuarine marsh, Grays Harbor, Washington. Restoration <strong>Ecology</strong> 10: 487-<br />
496.<br />
Thompson, J.D., McNeilly, T. & Gray, A.J. 1991. Population variation in Spartina anglica<br />
C.E. Hubbard. 111. Response to substrate variation in a glasshouse experiment. New<br />
Phytologist 117: 141-152.<br />
179
Thompson, K., Bakker, J.P. & Bekker, R.M. 1997. Soil seed bank of NW Europe:<br />
180<br />
Methodology, Density and longevity. Cambridge University Press, Cambridge<br />
Thompson, K., Green, A. & Jewels, A.M. 1994. Seeds in soil and worm casts from a neutral<br />
grassland. Functional <strong>Ecology</strong> 8: 29-35.<br />
Tilman, D. 1985. The resource-ratio hypothesis of plant succession. American Naturalist<br />
125: 827-852.<br />
Tobe K., Li, X. & Omasa, K. 2000. Seed germination and radicle growth of a halophyte.<br />
Kalidium caspicum. Annals of Botany 85:391–396.<br />
Tsuyuzaki, S. 1989. Analysis of revegetation dynamics on the volcano Usu, northern Japan,<br />
deforested by 1977–1978 eruptions. American Journal of Botany 76: 1468-1477.<br />
Turner, M.G., Baker, W.L., Peterson, C.J. & Peet, R.K. 1998. Factors influencing<br />
succession: lessons from large, infrequent natural disturbances. Ecosystems 1: 511–23.<br />
Ungar, I.A. 1962. Influence of salinity on seed germination in succulent halophytes. <strong>Ecology</strong><br />
43: 763-764.<br />
Ungar, I.A. 1998. Are biotic factors significant in influencing the distribution of halophytes<br />
in saline habitats? Botany Revision 64:176–199.<br />
Ungar, I.A. 2001. Seed banks and seed population dynamics of halophytes. Wetlands<br />
<strong>Ecology</strong> and Management 9: 499-510.<br />
Ungar, I.A., Benner, D.K. & McGraw, D.C. 1979. The distribution and growth of Salicornia<br />
europaea on an inland salt pan. Journal of <strong>Ecology</strong> 60: 329-336.<br />
Ungar, I.A. & Woodell, S.R.J. 1993. The relationship between the seed bank and species<br />
composition of plant communities in two British salt-marshes. Journal of Vegetation<br />
Science 4: 531-536.
Ungar, I.A. & Woodell, S.R.J. 1996. Similarity of seed banks to above-ground vegetation in<br />
mesohaline and unmesohaline salt-marsh community on the Gower Peninsula, South<br />
Wales. International Journal of Plant Science 157: 746-749.<br />
Urbanska, K.M. 1997. Safe sites—interface of plant population ecology and restoration<br />
ecology. In: Urbanska, K.M., Webb, N.R. & Edwards P.J. (eds.) Restoration <strong>Ecology</strong><br />
and Sustainable Development. pp. 81–110. Cambridge University Press, Cambridge,<br />
UK.<br />
Valéry, L., Bouchard, V. & Lefeuvre, J.C. 2004. Impact of the invasive native species<br />
Elymus athericus on carbon pools in a salt-marsh. Wetlands 24: 268-276.<br />
Vallentine, J.F. 2001. Grazing management. 2 nd edition. Academic press, California, USA,<br />
pp. 261-302.<br />
van den Black, E. 1994. Vegetatiekurdige en ecologische studie van de slikken en schorren<br />
in het Zwin (Knokke- Heist, West- Vlaanderen), MSc. Thesis, <strong>Ghent</strong> University,<br />
Belgium.<br />
van der Valk, A.G. 1981. Succession in wetlands: a Gleasonian approach. Journal of<br />
<strong>Ecology</strong> 62: 688-696.<br />
van der Valk, A.G. 1992. Establishment, colonization and persistence. In: Glenn-Lewin,<br />
D.C., Peet, R.K. & Veblen, T.T. (eds.) Plant succession, theory and prediction. pp.<br />
60-102. Chapman & Hall, UK.<br />
van der Wal, R., van Lieshout, S., Bos, D. & Drent, R.H. 2000. Are spring staging brent<br />
geese evicted by vegetation succession? Ecography 23: 60-69.<br />
van der Wal, R., van Wijnen, H., van Wieren, S., Beucher, O. & Bos, D. 2000b. On<br />
facilitation between herbivores: how Brent geese profit from brown hares. <strong>Ecology</strong> 81:<br />
969–980.<br />
181
van Leeuwen, C.G. 1966. A relation theoretical approach to pattern and process in<br />
182<br />
vegetation. Wentia 15:25-46.<br />
van Soest, P.J. 1994. Nutritional ecology of the ruminant. Cornell University Press. Ithaca<br />
(NY).<br />
van Soest, P.J., Robertson, J.B. & Lewis, B.A. 1991. Methods for dietary fiber, neutral<br />
detergent fiber, and nonstarch polysaccharides in relation to animal nutrition. Journal<br />
of Dairy Science 74: 3583-3597.<br />
van Soest, P.J. & Wine, R.H. 1968. The determination of lignin and cellulose in acid<br />
detergent fiber with permanganate. Journal of the Association of Official Analytical<br />
Chemists 51: 780-787.<br />
van Wijnen, H.J. & Bakker, J.P. 1999. Nitrogen and phosphorus limitation in a coastal<br />
barrier salt-marsh: the implications for vegetation succession. Journal of <strong>Ecology</strong> 87:<br />
265-272<br />
van Wijnen, H.J., Bakker, J.P. & de Vries, Y. 1997. Twenty years of salt-marsh succession<br />
on a Dutch coastal barrier island. Journal of Coastal Conservation 3: 9-18.<br />
Vanhecke, L., Charlier, G. & Verelst, L. 1981. Landschappen in Vlaanderen vroeger en nu.<br />
Van groene armoede naar grijze overvloed. Meise, Nat. Plantentuin van België, 140<br />
pp., 60 foto’s.<br />
Varty, A.K. & Zedler, J.B. 2008. How Waterlogged Microsites Help an Annual Plant Persist<br />
Among Salt-marsh Perennials. Estuaries and Coasts 31: 300-312.<br />
Vince, S.W. & Snow, A. 1984. Plant zonation in an Alaska salt-marsh: II. An expiremental<br />
study of the role of edaphic conditions. Journal of <strong>Ecology</strong> 72: 669-684.<br />
Visser, E.J.W., Colmer, T.D., Blom, C.W.P.M. & Voesenek, L.A.C.J. 2000. Changes in<br />
growth, porosity, and radial oxygen loss from adventitious roots of selected mono- and
dicotyledonous wetland species with contrasting types of aerenchyma. Plant, Cell &<br />
Environment 23: 1237–1245.<br />
Vitousek, P.M. & Walker, L.R. 1987. Colonization, succession and resource availability:<br />
Ecosystem-level interactions. In: Gray, A.J., Crawley, M.J. & Edwards P.J. (eds.)<br />
Colonization, succession and stability. pp. 207-223. Blackwell, Oxford, UK.<br />
Vyvey, Q. 1983. Study of the seed bank in Schoeno-Juncetum subnodulosi all-1922 and in<br />
Molinietum caeruleae all-1922. Acta Botanica Neerlandica 32: 246-247.<br />
Walker, L.R., Bellingham, P.J. & Peltzer, D.A. 2006. Plant characteristics are poor<br />
predictors of microsite colonization during the first two years of primary succession.<br />
Journal of Vegetation Science 17: 397-406.<br />
Wassenaar, T.D., Ferreira, S.M. & van Aarde, R.J. 2007. Flagging aberrant sites and<br />
assemblages in restoration projects. Restoration <strong>Ecology</strong> 15: 68–76.<br />
Watson, E.V. 1981. British Mosses and Liverworts. 3 rd edition. Cambridge University Press,<br />
Cambridge.<br />
West, D.C., Shugart, H.H. & Botkin, D.B. 1981. Forest Succession: Concepts and<br />
Application. Springer, Berlin, Germany.<br />
Westhoff, V., Hobohm, C. & Schaminée, J.H.J. 1993. Rote Liste der Pflanzengesellschaften<br />
des Naturraumes Wattenmeer unter Berücksichtigung der ungefärdeten<br />
Vegetationseinheiten. Tuexenia 13: 109-140.<br />
Westhoff, V. & van Oosten, M.F. 1991. De plantengroei van de Waddeneilanden. Uitgeverij<br />
KNNV, Utrecht.<br />
Whittaker, R.H. 1975. Communities and Ecosystems. MacMillan, New York, USA.<br />
Wiegleb, G. & Felinks, B. 2001. Primary succession in post-mining landscapes of Lower<br />
Lusatia - chance or necessity. Ecological Engineering 17: 199–217.<br />
183
Wijnen, H.J.V. & Bakker, J.P. 1999. Nitrogen and phosphorus limitation in a coastal barrier<br />
184<br />
salt-marsh: the implications for vegetation succession. Journal of <strong>Ecology</strong> 87: 265-<br />
272.<br />
Willson, M.F. 1983. Natural history of Actaea rubra: fruit dimorphism and fruit/seed<br />
predation. Bulletin of the Torrey Botanical Club 110: 298–303.<br />
Willson, M.F. & Traveset, A. 2000. The ecology of seed dispersal: In: Fenner, M. (eds.)<br />
Seeds, the ecology of regeneration in plant communities. pp. 85-110. CABI<br />
Publishing, Oxon, UK.<br />
Wolters, H.E. 2006. Restoration of salt-marshes. <strong>PhD</strong> Thesis, University of Groningen, the<br />
Netherlands.<br />
Wolters, M. & Bakker, J.P. 2002. Soil seed bank and driftline composition along a<br />
successional gradient on a temperate salt-marsh. Applied Vegetation Science 5:55-62<br />
Wolters, M., Garbutt, A. & Bakker, J.P. 2005a. Plant colonization after managed<br />
realignment: the relative importance of diaspore dispersal. Journal of Applied <strong>Ecology</strong><br />
42: 770-777.<br />
Wolters, M., Garbutt, A. & Bakker, J.P. 2005b. Salt-marsh restoration: evaluating the<br />
success of de-embankments in north-west Europe. Biological Conservation 123: 249-<br />
268.<br />
Wolters, M., Garbutt, A., Bekker, R.M., Bakker, J.P. & Carey, P.D. 2008. Restoration of<br />
salt-marsh vegetation in relation to site suitability, species pool and dispersal traits.<br />
Journal of Applied <strong>Ecology</strong> 45: 904-912.<br />
Wood, D.M. & del Moral, R. 1987. Mechanisms of early primary succession in subalpine<br />
habitats on Mount St. Helens. <strong>Ecology</strong> 68: 780-790.<br />
Woodell, S.R.J. 1985. Salinity and seed germination patterns in coastal plants. Plant<br />
<strong>Ecology</strong> 61: 223-229.
Ysebaert, T., Meininger, P.L., Meire, P., Devos, K., Berrevoets, C.M., Strucker, R.C.W. &<br />
Kuijken, E. 2000. Waterbird communities along the estuarine salinity gradient of the<br />
Schelde estuary, NW-Europe. Biodiversity and Conservation 9: 1275-1296.<br />
Zammit, C. & Westoby, M. 1988. Pre-dispersal seed losses and the survival of seeds and<br />
seedlings of two serotinous Banksia shrubs in burnt and unburnt heath. Journal of<br />
<strong>Ecology</strong> 76: 200–214<br />
Zedler, J.B. & Callaway, J.C. 1999. Tracking wetland restoration: do mitigation sites follow<br />
desired trajectories. Restoration <strong>Ecology</strong> 7: 69-73.<br />
Zobel, M. 1997. The relative role of species pools in determining plant species richness: an<br />
alternative explanation of species coexistence. Trends in <strong>Ecology</strong> & Evolution 12:<br />
266–269.<br />
Zobel, M., van der Maarel, E. & Dupré, C. 1998. Species pool: the concepts, its<br />
determination and significance for community restoration. Applied Vegetation Science<br />
1: 55–56.<br />
185
186
Summary<br />
Plant succession is the change in species composition or three-dimensional architecture<br />
of the plant cover of a specified place through time or the changes observed in an ecological<br />
community, following a perturbation that opens up a relatively large space. Vegetation<br />
succession has temporal and spatial aspects and results from many causes and processes,<br />
particularly the colonization, growth and mortality of organisms under particular<br />
environmental conditions. Successional vegetation processes are an important aspect in<br />
ecological restoration, because they determine the final success, and hence, the type and<br />
timing of restoration measures. Therefore, vegetation succession and its study should be taken<br />
into account in virtually every restoration program. Beside the importance of vegetation<br />
succession studies in restoration programs, newly (by man or naturally) created substrates<br />
offer us unique opportunities to study plant succession fundamentally, in which salt-marshes<br />
are a remarkable habitat. The main objective of this study is to investigate on the<br />
characteristics of new colonizers in a newly created salt-marsh and the effect of the most<br />
important abiotic (inundation frequency, salinity and texture) and biotic factors (propagule<br />
availability and sheep grazing) on vegetation succession in time. The effect of stochastic and<br />
deterministic factors on spatial vegetation succession was compared between newly created<br />
salt-marsh and old salt-marshes. In addition, seed bank density and similarity between seed<br />
bank and above-ground vegetation and their differentiation with depth were compared<br />
between salt-marshes in different successional stages (old and newly created).<br />
The results showed that viable seed availability might be the most important constraint for<br />
plant species to act as early colonizers, and the development of salt-marsh target species could<br />
be restricted by limited viable seed production and also unfavourable soil conditions. This<br />
study confirms the importance of a nearby salt-marsh to a restoration site and the importance<br />
187
of a continuous water bridge between seed source and sink. The lack of colonization success<br />
of some species is most probably caused by the low connectivity between source and sink.<br />
Plant composition within the restoration site (newly created salt-marsh) changed over time. In<br />
areas of the site with a higher inundation frequency, the rapid expansion of some species (e.g.<br />
Suaeda maritima), the appearance of new species (e.g. Salicornia procumbens), and change in<br />
the abundance of other species (e.g. Salicornia europaea) resulted in a variation in plant<br />
composition. At lower inundation frequencies, the expansion of some species (e.g. Elymus<br />
athericus), and turnover of others, resulted in a change in species composition; higher<br />
turnover and higher expansion of perennials at lower inundation frequencies. In general,<br />
species turnover was lower at higher inundation frequency.<br />
188<br />
The results showed that sheep grazing had some effects on vegetation succession<br />
physically and chemically despite the very short time since grazers were introduced. Species<br />
richness increased in Elymus athericus- dominated community and decreased in some parts,<br />
after sheep were introduced. In addition, sheep grazing changed forage quality in time.<br />
Nevertheless, species composition and the cover of dominant species did not change<br />
significantly through sheep grazing while natural plant succession (in composition and<br />
coverage) was going on.<br />
It appears that in our salt-marsh patches, deterministic factors (electric conductivity and<br />
texture of soil and elevation) are important in both early and late successional stages.<br />
However, annual species in old salt-marsh might germinate in the stochastically appearing<br />
vegetation gaps, unrelated to the deterministic factors, where competition with perennials<br />
does not prevent the colonization.<br />
Seed density was higher in the early successional stage than in the late successional<br />
stage. The seed bank composition remains rather constant and is composed of early<br />
successional species that produce many seeds that persist during the succession sere. In early
successional stages new colonizers become to a large extent incorporated in the seed bank<br />
leading to a relatively high similarity between seed bank and above-ground vegetation; in the<br />
late successional stages, most dominant species have a transient seed bank or probably no<br />
seed input, leading to a relatively low similarity between seed bank and above-ground<br />
vegetation. The distribution of seed bank density with depth in old salt-marshes was the same<br />
as in newly created salt-marsh with the highest density in upper soil layer.<br />
189
190
Appendices<br />
Appendix A – The position of the vegetation plots used in chapter 2. Lines reflect different (mean)<br />
tidal lines during the observation period 1991-2000; from high (east) to low (west) these are: highest<br />
measured high water level during the observation period (6.14m TAW); mean high water level at<br />
spring tide (4.68m TAW); mean high water level (4.45m TAW); mean high water level at neap tide<br />
(3.92m TAW); lowest measured high water level (2.71m TAW); mean general water level (2.38m<br />
TAW). There are 175 plots on the new salt-marsh and 66 plots on the old salt-marsh.<br />
191
192
Appendix B – The position of the vegetation plots used in chapter 3. Lines reflect different (mean)<br />
tidal lines during the observation period 1991-2000; from high (east) to low (west) these are: highest<br />
measured high water level during the observation period (6.14m TAW); mean high water level at<br />
spring tide (4.68m TAW); mean high water level (4.45m TAW); mean high water level at neap tide<br />
(3.92m TAW); lowest measured high water level (2.71m TAW); mean general water level (2.38m<br />
TAW). There are 119 plots on the new salt-marsh.<br />
193
194
Appendix C – The position of the exclosures and enclosures used in chapter 4. Lines reflect different<br />
(mean) tidal lines during the observation period 1991-2000; from high (east) to low (west) these are:<br />
highest measured high water level during the observation period (6.14m TAW); mean high water level<br />
at spring tide (4.68m TAW); mean high water level (4.45m TAW); mean high water level at neap tide<br />
(3.92m TAW); lowest measured high water level (2.71m TAW); mean general water level (2.38m<br />
TAW). There are 5 exclosures (no sheep grazing possible) and 5 neighbouring enclosures (in which<br />
sheep are able to graze); two couples are on the old salt-marsh, three on the new salt-marsh.<br />
195
196
Appendix D – The position of the vegetation plots used in chapter 5. Lines reflect different (mean)<br />
tidal lines during the observation period 1991-2000; from high (east) to low (west) these are: highest<br />
measured high water level during the observation period (6.14m TAW); mean high water level at<br />
spring tide (4.68m TAW); mean high water level (4.45m TAW); mean high water level at neap tide<br />
(3.92m TAW); lowest measured high water level (2.71m TAW); mean general water level (2.38m<br />
TAW). There are 95 plots on the new salt-marsh and 60 plots on the old salt-marsh.<br />
197
198
Appendix E.1 – The position of the vegetation and seed bank plots used in chapter 2 and 6 in the IJzer<br />
estuary study area. There are 10 plots on the new salt-marsh and 16 plots on the old salt-marsh (the<br />
latter not used in chapter 2).<br />
199
200
Appendix E.2 – The position of the vegetation and seed bank plots used in chapter 6 in the Zwin<br />
study area. In total, 14 plots were sampled.<br />
Appendix E.3 – The position of the vegetation and seed bank plots used in chapter 6 in the<br />
Verdronken Land van Saeftinghe study area. In total, 50 plots were sampled (extraction from Google<br />
Earth; all 50 sampling points are given on the map, but some samples are so close together that they<br />
appear as one point on the map ).<br />
201
202
Appendix F – Relative abundance of all species in seed bank and above-ground vegetation in the new<br />
and old salt-marshes in the IJzermonding.<br />
Seed bank Vegetation<br />
Species<br />
New Old<br />
0-5cm 5-10cm 10-15cm total 0-5cm 5-10cm 10-15cm total New Old<br />
Agrostis stolonifera 0.00 0.47 0.00 0.07 0.00 0.00 0.43 0.05 3.33 0.00<br />
Anagallis arvensis 0.00 0.00 0.00 0.00 0.00 0.00 0.00 0.00 0.37 0.00<br />
Aster tripolium 0.06 0.00 0.00 0.05 0.14 0.15 0.00 0.13 0.00 0.54<br />
Atriplex littoralis 0.84 0.55 0.00 0.73 0.81 1.09 0.36 0.84 0.00 0.00<br />
Atriplex prostrata 0.56 3.68 1.32 1.05 1.91 1.09 2.76 1.79 0.37 0.22<br />
Beta vulgaris 0.00 0.00 0.00 0.00 0.00 0.00 0.00 0.00 0.00 0.33<br />
Centaurium pulchellum 0.00 0.53 0.00 0.07 0.00 0.00 0.00 0.00 0.00 0.00<br />
Chenopodium album 0.00 0.00 0.00 0.00 0.00 0.00 0.00 0.00 0.37 0.00<br />
Chenopodium rubrum 11.35 30.76 20.10 14.71 12.18 1.85 1.84 8.55 0.00 0.00<br />
Cirsium arvense 0.25 5.68 1.13 1.07 0.82 1.03 0.00 0.79 0.74 0.00<br />
Cirsium vulgare 0.00 0.00 0.00 0.00 0.06 0.16 0.00 0.08 0.37 0.00<br />
Conyza canadensis 0.00 0.23 0.00 0.03 0.33 0.00 0.00 0.21 0.37 0.00<br />
Crepis capillaris 0.00 0.00 0.00 0.00 0.10 0.00 0.00 0.07 0.00 0.00<br />
Cynosurus cristatus 0.58 0.29 0.66 0.55 1.32 0.00 0.32 0.89 0.00 0.00<br />
Digitaria sanguinalis 0.00 0.00 0.00 0.00 0.06 0.00 0.00 0.04 0.00 0.00<br />
Diplotaxis tenuifolia 0.20 0.00 0.00 0.16 0.00 0.00 0.00 0.00 0.00 0.00<br />
Elymus athricus 0.00 0.00 0.00 0.00 0.00 0.00 0.00 0.00 10.37 55.82<br />
Elymus repens 0.00 0.00 0.00 0.00 0.00 0.00 0.00 0.00 10.74 0.00<br />
Epilobium hirsutum 0.00 0.00 0.00 0.00 0.06 0.00 0.00 0.04 0.00 0.00<br />
Glaux maritima 0.00 0.61 0.00 0.08 1.28 0.20 0.00 0.88 0.00 0.22<br />
Gnaphalium luteoalbum 0.00 0.23 0.00 0.03 0.00 0.00 0.00 0.00 0.00 0.00<br />
Halimione portulacoides 0.00 0.00 0.00 0.00 0.00 0.00 0.00 0.00 0.37 0.33<br />
Juncus bufonius 0.26 0.61 4.16 0.60 4.19 1.92 6.80 3.91 0.00 0.00<br />
Juncus sp. 0.20 3.48 4.58 0.98 0.00 1.74 1.94 0.64 0.00 0.00<br />
Limonium vulgare 0.00 0.00 0.00 0.00 0.21 0.16 0.00 0.17 3.33 12.19<br />
Lycopus europaeus 0.07 0.00 0.00 0.05 0.77 0.71 1.08 0.79 0.00 0.00<br />
Matricaria maritima 0.20 0.00 0.00 0.16 0.00 0.00 0.00 0.00 0.00 0.00<br />
Mentha aquatica 0.00 0.00 0.00 0.00 0.19 0.00 0.00 0.12 0.00 0.00<br />
Myosotis arvensis 0.06 0.00 0.00 0.05 0.00 0.00 0.00 0.00 0.00 0.00<br />
Parapholis strigosa 0.00 0.00 0.00 0.00 0.00 0.00 0.00 0.00 7.41 0.11<br />
Phragmites australis 0.05 0.26 0.00 0.08 0.07 0.32 0.00 0.12 0.00 10.77<br />
Plantago coronopus 0.07 0.00 0.00 0.05 0.00 0.00 0.00 0.00 0.37 0.00<br />
Plantago major 13.98 0.95 1.10 11.21 0.13 0.00 0.00 0.09 0.37 0.00<br />
Plantago maritima 0.00 0.00 0.00 0.00 0.06 0.00 0.00 0.04 0.00 0.11<br />
Poa annu 0.05 0.57 0.00 0.12 0.00 0.00 0.00 0.00 0.00 0.00<br />
Poa pratensis 0.00 0.47 0.00 0.07 0.00 0.00 0.00 0.00 0.00 0.00<br />
Poa trivialis 0.24 0.99 2.50 0.51 0.00 0.00 0.41 0.04 0.00 0.00<br />
Polygonum aviculare 0.00 0.00 0.00 0.00 0.07 0.00 0.00 0.04 0.00 0.00<br />
Puccinellia maritima 0.00 0.00 0.00 0.00 0.31 0.16 0.00 0.24 1.85 4.57<br />
Ranunculus sceleratus 0.07 0.00 0.00 0.05 1.82 2.30 3.65 2.13 0.00 0.00<br />
Rubus caesious 0.06 0.00 0.00 0.05 0.00 0.00 0.00 0.00 0.00 0.00<br />
Rumex conglomeratus 0.00 0.00 1.32 0.10 0.07 0.00 0.00 0.04 0.00 0.00<br />
Rumex crispus 0.05 0.66 1.80 0.27 0.00 0.00 0.00 0.00 0.00 0.00<br />
Rumex maritimus 0.00 0.99 0.00 0.14 0.00 0.00 0.00 0.00 0.00 0.00<br />
Rurippa palustris 0.00 0.26 0.00 0.04 0.00 0.00 0.00 0.00 0.00 0.00<br />
Sagina apetala 0.00 0.00 0.00 0.00 0.00 0.00 0.00 0.00 0.37 0.00<br />
Sagina maritima 0.00 0.00 0.60 0.04 0.00 0.00 0.00 0.00 0.00 0.00<br />
Sagina procumbens 0.00 0.00 0.00 0.00 0.00 0.18 0.00 0.04 0.00 0.00<br />
Salicornia sp. 55.36 39.38 39.43 51.96 35.40 49.74 50.99 40.56 13.70 2.94<br />
203
Appendix F – Continued<br />
Samolus valarandi 0.05 0.00 0.50 0.08 0.00 0.00 0.00 0.00 0.00 0.00<br />
Scirpus maritimus 0.53 0.00 0.00 0.42 0.00 0.00 0.00 0.00 0.00 0.00<br />
Senecio inaequidencs 0.00 0.00 0.00 0.00 0.07 0.00 0.00 0.04 0.00 0.00<br />
Senecio jacobaea 0.00 0.00 0.00 0.00 0.17 0.00 0.00 0.11 0.00 0.00<br />
Sisymbrium altissimum 0.00 0.23 0.00 0.03 0.00 0.00 0.00 0.00 0.00 0.00<br />
Solanum nigrum 0.00 0.00 0.00 0.00 0.78 0.34 0.00 0.59 0.00 0.00<br />
Solanum triflorum 0.06 0.00 0.00 0.05 0.53 1.09 1.04 0.72 0.00 0.00<br />
Sonchus arvensis 0.00 0.00 0.00 0.00 0.00 0.00 0.00 0.00 0.74 0.00<br />
Sonchus asper 0.00 0.00 0.00 0.00 0.44 0.19 0.00 0.33 0.00 0.00<br />
Sparganium erectum 0.00 0.00 0.00 0.00 0.00 0.00 0.37 0.04 0.00 0.00<br />
Spartina townsendii 0.00 0.00 0.00 0.00 0.00 0.00 0.00 0.00 0.00 8.81<br />
Spergularia sp. 11.18 1.77 11.32 9.87 26.34 26.41 20.96 25.79 8.15 1.85<br />
Stellaria media 0.00 0.00 0.00 0.00 0.00 0.00 0.64 0.07 0.00 0.00<br />
Suaeda maritima 3.20 3.29 1.06 3.05 5.38 2.24 2.97 4.36 36.30 0.98<br />
Triglochin maritimum 0.00 0.00 0.51 0.04 3.65 6.57 3.42 4.35 0.00 0.22<br />
Typha latifolia 0.00 0.00 0.00 0.00 0.05 0.00 0.00 0.03 0.00 0.00<br />
Urtica dioica 0.44 3.09 7.91 1.35 0.20 0.37 0.00 0.22 0.00 0.00<br />
204
Appendix G – Relative abundance of all species in seed bank and above-ground vegetation in the old<br />
salt-marshes (Saeftinghe and Zwin).<br />
Seed bank Vegetation<br />
Species<br />
Saeftinghe Zwin<br />
0-5cm 5-10cm 10-15cm total 0-5cm 5-10cm 10-15cm total Saeftinghe Zwin<br />
Agrostis stolonifera 0.16 0.46 0.33 0.24 0.00 0.25 0.00 0.15 6.06 0.00<br />
Arenaria serpyllifolia 0.00 0.07 0.03 0.02 0.00 0.00 0.00 0.00 0.00 0.00<br />
Aster tripolium 0.00 0.28 0.05 0.07 1.32 0.05 0.00 0.46 3.82 4.05<br />
Atriplex littoralis 0.00 0.01 0.00 0.00 0.00 0.00 0.00 0.00 0.05 0.00<br />
Atriplex prostrata 0.06 0.12 0.22 0.08 0.00 0.09 0.00 0.05 1.91 0.00<br />
Calamagrostis epigejos 0.00 0.04 0.00 0.01 0.00 0.00 0.00 0.00 0.00 0.00<br />
Centaurium erythraea 0.44 0.03 0.05 0.32 0.00 0.00 0.00 0.00 0.00 0.00<br />
Centaurium pulchellum 0.54 0.19 0.04 0.42 0.00 0.00 0.00 0.00 0.00 0.00<br />
Cerastium fontanum 0.02 0.01 0.05 0.02 0.00 0.00 0.00 0.00 0.00 0.00<br />
Chenopodium glaucum 0.03 0.08 0.00 0.04 0.10 0.00 1.34 0.12 0.00 0.00<br />
Chenopodium rubrum 0.01 0.03 0.00 0.01 0.20 0.08 3.42 0.34 0.00 0.00<br />
Cirsium arvense 0.08 0.34 0.44 0.17 0.00 0.00 0.00 0.00 0.93 0.00<br />
Cochlearia officinalis 0.01 0.00 0.00 0.01 0.00 0.00 0.00 0.00 0.00 0.00<br />
Convolvulus arvensis 0.00 0.00 0.00 0.00 0.00 0.00 0.00 0.00 0.05 0.00<br />
Conyza canadensis 0.02 0.00 0.00 0.01 0.00 0.00 0.00 0.00 0.00 0.00<br />
Crepis capillaris 0.00 0.00 0.00 0.00 0.00 0.00 0.00 0.00 0.05 0.00<br />
Cynosurus cristatus 0.14 0.05 0.00 0.11 0.78 0.00 0.00 0.25 0.00 0.00<br />
Digitaria sanguinalis 0.00 0.00 0.00 0.00 0.00 0.00 0.45 0.03 0.00 0.00<br />
Elymus athricus 0.00 0.00 0.00 0.00 0.00 0.00 0.00 0.00 10.43 14.76<br />
Elymus repens 0.00 0.00 0.00 0.00 0.00 0.00 0.00 0.00 0.38 0.00<br />
Epilobium hirsutum 0.00 0.03 0.00 0.01 0.00 0.00 0.00 0.00 0.00 0.00<br />
Epilobium palustre 0.01 0.00 0.00 0.01 0.00 0.00 0.00 0.00 0.00 0.00<br />
Festuca rubra 0.00 0.00 0.00 0.00 0.00 0.00 0.00 0.00 8.02 0.83<br />
Glaux maritima 0.90 3.37 1.76 1.55 5.08 3.21 10.54 4.30 3.55 0.71<br />
Gnaphalium luteoalbum 0.01 0.00 0.00 0.00 0.00 0.00 0.00 0.00 0.00 0.00<br />
Gnaphalium uligiinosum 0.02 0.00 0.00 0.01 0.00 0.00 0.00 0.00 0.00 0.00<br />
Halimione portulacoides 0.00 0.00 0.00 0.00 0.00 0.04 0.00 0.02 0.00 53.81<br />
Holcus lanatus 0.00 0.00 0.05 0.00 0.00 0.00 0.00 0.00 0.00 0.00<br />
Juncus bufonius 62.69 39.31 33.30 55.08 47.19 78.56 57.24 66.99 0.00 0.00<br />
Juncus gerardii 9.44 6.95 6.29 8.63 11.98 7.78 10.41 9.32 3.71 0.12<br />
Juncus sp. 9.46 6.95 6.29 8.64 11.98 7.78 10.87 9.35 0.00 0.60<br />
Lolium perenne 0.00 0.00 0.00 0.00 0.00 0.00 0.00 0.00 1.36 0.00<br />
Limonium vulgare 0.00 0.00 0.00 0.00 0.00 0.00 0.00 0.00 0.00 5.48<br />
Matricaria discoidea 0.01 0.00 0.05 0.01 0.00 0.00 0.00 0.00 0.00 0.00<br />
Matricaria maritima 0.01 0.00 0.00 0.00 0.00 0.04 0.00 0.02 0.00 0.00<br />
Medicago lupulina 0.00 0.02 0.00 0.01 0.00 0.00 0.00 0.00 0.00 0.00<br />
Parapholis strigosa 0.00 0.00 0.00 0.00 0.00 0.00 0.00 0.00 0.44 0.00<br />
Phragmites australis 0.20 0.14 0.21 0.19 0.00 0.00 0.00 0.00 10.64 0.00<br />
Plantago coronopus 0.00 0.00 0.00 0.00 0.00 0.00 0.00 0.00 0.05 0.00<br />
Plantago major 1.03 1.66 0.09 1.12 0.00 0.00 0.00 0.00 0.55 0.00<br />
Plantago maritima 0.01 0.01 0.00 0.01 0.00 0.00 0.00 0.00 3.44 0.60<br />
Poa annu 0.05 0.19 0.00 0.08 0.00 0.00 0.00 0.00 0.00 0.00<br />
Poa pratensis 0.01 0.00 0.00 0.00 0.00 0.00 0.00 0.00 0.05 0.00<br />
Poa trivialis 0.01 0.06 0.00 0.02 0.00 0.00 0.00 0.00 0.00 0.00<br />
Polygonum aviculare 0.01 0.13 0.00 0.04 0.00 0.00 0.00 0.00 0.05 0.00<br />
Polygonum persicaria 0.00 0.00 0.00 0.00 0.08 0.00 0.00 0.02 0.00 0.00<br />
Potentilla anserina 0.00 0.00 0.00 0.00 0.00 0.00 0.00 0.00 1.20 0.00<br />
Puccinellia maritima 0.01 0.07 0.08 0.03 0.19 0.00 0.00 0.06 9.77 2.38<br />
Ranunculus sceleratus 0.01 0.02 0.18 0.02 0.00 0.00 0.00 0.00 0.00 0.00<br />
205
Appendix G – Continued<br />
Rubus caesious 0.00 0.00 0.04 0.00 0.00 0.00 0.00 0.00 0.00 0.00<br />
Rumex acetosa 0.02 0.03 0.10 0.03 0.00 0.00 0.00 0.00 0.00 0.00<br />
Rumex crispus 0.03 0.00 0.00 0.02 0.00 0.00 0.00 0.00 0.00 0.00<br />
Rumex sp. 0.01 0.00 0.00 0.01 0.00 0.00 0.00 0.00 0.38 0.00<br />
Rurippa palustris 0.00 0.00 0.00 0.00 0.00 0.00 0.00 0.00 0.00 0.00<br />
Sagina apetala 0.01 0.02 0.12 0.02 0.00 0.00 0.00 0.00 0.00 0.00<br />
Sagina procumbens 0.00 0.01 0.00 0.00 0.00 0.00 0.00 0.00 0.00 0.00<br />
Salicornia sp. 6.13 11.84 17.30 8.26 6.15 0.59 0.77 2.40 6.11 2.14<br />
Scirpus maritimus 0.82 1.55 4.72 1.26 0.00 0.09 0.00 0.05 5.35 0.00<br />
Senecio inaequidencs 0.00 0.00 0.00 0.00 0.00 0.00 0.00 0.00 0.00 0.00<br />
Senecio jacobaea 0.00 0.00 0.00 0.00 0.00 0.00 0.00 0.00 0.00 0.00<br />
Senecio vulgaris 0.00 0.00 0.04 0.00 0.00 0.00 0.00 0.00 0.00 0.00<br />
Solanum nigrum 0.00 0.01 0.06 0.01 0.00 0.00 0.00 0.00 0.00 0.00<br />
Sonchus arvensis 0.03 0.18 0.42 0.09 0.00 0.00 0.00 0.00 0.05 0.00<br />
Sonchus asper 0.01 0.02 0.00 0.01 0.00 0.00 0.00 0.00 0.33 0.00<br />
Sonchus crispus 0.00 0.00 0.00 0.00 0.00 0.00 0.00 0.00 0.00 0.00<br />
Spartina townsendii 0.00 0.00 0.00 0.00 0.00 0.00 0.00 0.00 15.34 0.83<br />
Spergularia sp. 7.14 24.78 25.35 12.61 14.30 1.29 4.56 5.72 2.73 2.38<br />
Suaeda maritima 0.00 0.02 0.00 0.00 0.64 0.10 0.39 0.29 0.98 4.64<br />
Taraxacum vulgaria 0.00 0.00 0.00 0.00 0.00 0.00 0.00 0.00 0.22 0.00<br />
Trifolium fragiferum 0.05 0.03 0.04 0.04 0.00 0.00 0.00 0.00 0.87 0.00<br />
Trifolium repens 0.00 0.04 0.00 0.01 0.00 0.00 0.00 0.00 0.05 0.00<br />
Triglochin maritimum 0.22 0.70 1.66 0.43 0.00 0.05 0.00 0.03 1.04 0.00<br />
Typha latifolia 0.00 0.02 0.17 0.02 0.00 0.00 0.00 0.00 0.00 0.00<br />
Urtica dioica 0.12 0.12 0.47 0.15 0.00 0.00 0.00 0.00 0.00 0.00<br />
206