Leer contenido... - Gobierno Regional de Moquegua
Leer contenido... - Gobierno Regional de Moquegua
Leer contenido... - Gobierno Regional de Moquegua

Create successful ePaper yourself
Turn your PDF publications into a flip-book with our unique Google optimized e-Paper software.
1.1.2. Extensión Altitud y Densidad.<br />
8<br />
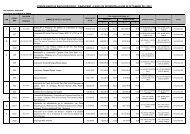
En el cuadro adjunto se muestra la extensión, altitud y <strong>de</strong>nsidad <strong>de</strong> las provincias y distritos que<br />
conforman la Región <strong>Moquegua</strong>.<br />
Departamento<br />
Provincia<br />
Distrito<br />
Cuadro Nº 2<br />
Dpto. <strong>Moquegua</strong>: Superficie, altitud y <strong>de</strong>nsidad según distritos, 2011<br />
Superficie Altitud<br />
Población<br />
Absoluto % Dpto. % Prov.<br />
Densidad<br />
2/<br />
Región <strong>Moquegua</strong> 17,574.82 172,995 100.00 9.8<br />
Mariscal Nieto 9,011.94 78,040 45.11 100.00 8.7<br />
<strong>Moquegua</strong> 3,769.54 1,410 53,844 31.12 69.00 14.3<br />
Carumas 1,884.36 2,985 5,273 3.05 6.76 2.8<br />
Cuchumbaya 194.93 3,120 2,126 1.23 2.72 10.9<br />
Samegua 91.98 1,570 6,607 3.82 8.47 71.8<br />
San Cristóbal 1,136.28 3,400 3,838 2.22 4.92 3.4<br />
Torata 1,934.85 2,207 6,352 3.67 8.14 3.3<br />
Gral. Sánchez Cerro 6,792.92 26,927 15.57 100.00 4.0<br />
Omate 229.14 2,166 4,245 2.45 15.76 18.5<br />
Chojata 819.15 3,625 2,425 1.40 9.01 3.0<br />
Coalaque 368.86 2,283 1,242 0.72 4.61 3.4<br />
Ichuña 1,119.73 3,756 4,493 2.60 16.69 4.0<br />
La Capilla 845.95 1,800 1,996 1.15 7.41 2.4<br />
Lloque 209.87 3,256 1,670 0.97 6.20 8.0<br />
Matalaque 711.28 2,538 1,126 0.65 4.18 1.6<br />
Puquina 665.92 3,084 2,805 1.62 10.42 4.2<br />
Quinistaquillas 190.26 1,800 1,211 0.70 4.50 6.4<br />
Ubinas 1,487.20 3,376 3,761 2.17 13.97 2.5<br />
Yunga 145.56 3,267 1,953 1.13 7.25 13.4<br />
Ilo 1,769.96 68,028 39.32 100.00 38.4<br />
Ilo 295.32 15 63,742 36.85 93.70 215.8<br />
El Algarrobal 1,189.78 480 284 0.16 0.42 0.2<br />
Pacocha 284.86 5 4,002 2.31 5.88 14.0<br />
1/ Recopilado <strong>de</strong>l Plan Vial Departamental Participativo 2009-2016<br />
2/ Estamaciones y Proyecciones <strong>de</strong> Población por Sexo, según Departamento, Provincia y Distrito, 2000-2015<br />
Fuente: INEI – Censo <strong>de</strong> Población y Vivienda 2007<br />
Plan <strong>de</strong> Desarrollo <strong>Regional</strong> Concertado <strong>de</strong> <strong>Moquegua</strong> 2003 – 2021<br />
Alineado al Plan Bicentenario “El Perú hacia el 2021”