Sucres [ºBrix] 18,00 16,00 14,00 12,00 10,00 8,00 6,00 4,00 2,00 58 Resultats i discussió En <strong>la</strong> tau<strong>la</strong> següent es pot veure l’anàlisi <strong>de</strong> variància <strong><strong>de</strong>ls</strong> resultats anteriors (Tau<strong>la</strong> 5.5.3.4). Producció recollida 0,00 0,00 10,00 20,00 30,00 40,00 50,00 Producció collida [t/ha] y = -0,0401x + 15,404 R² = 0,1408 Sucres-Producció collida Lineal (Sucres- Producció collida) Figura 5.5.3.2: Regressió lineal entre els sucres i <strong>la</strong> producción collida Tau<strong>la</strong> 5.5.3.5: Anàlisi <strong>de</strong> variància <strong><strong>de</strong>ls</strong> resultats entre sucres i producció collida Graus <strong>de</strong> llibertat Suma <strong>de</strong> cuadrats Promig <strong><strong>de</strong>ls</strong> cuadrats F Valor crític <strong>de</strong> F Regressió 1 1,60 1,60 2,13 0,17 Residus 13 9,78 0,75 Total 14 11,38 En <strong>la</strong> tau<strong>la</strong> i figura següent es mostren els resultats obtinguts en cada un <strong><strong>de</strong>ls</strong> <strong>arbres</strong>, per les variables: producció recollida [t/ha] i pon<strong>de</strong>ració <strong><strong>de</strong>ls</strong> sucres [ºBrix].
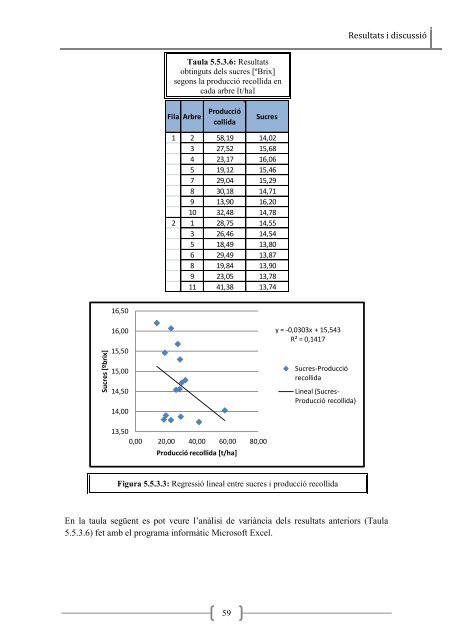
Sucres [ºbrix] 16,50 16,00 15,50 15,00 14,50 14,00 Tau<strong>la</strong> 5.5.3.6: Resultats obtinguts <strong><strong>de</strong>ls</strong> sucres [ºBrix] segons <strong>la</strong> producció recollida en cada arbre [t/ha] Fi<strong>la</strong> Arbre Producció collida 59 Sucres 1 2 58,19 14,02 3 27,52 15,68 4 23,17 16,06 5 19,12 15,46 7 29,04 15,29 8 30,18 14,71 9 13,90 16,20 10 32,48 14,78 2 1 28,75 14,55 3 26,46 14,54 5 18,49 13,80 6 29,49 13,87 8 19,84 13,90 9 23,05 13,78 11 41,38 13,74 13,50 0,00 20,00 40,00 60,00 80,00 Producció recollida [t/ha] y = -0,0303x + 15,543 R² = 0,1417 Sucres-Producció recollida Lineal (Sucres- Producció recollida) Figura 5.5.3.3: Regressió lineal entre sucres i producció recollida Resultats i discussió En <strong>la</strong> tau<strong>la</strong> següent es pot veure l’anàlisi <strong>de</strong> variància <strong><strong>de</strong>ls</strong> resultats anteriors (Tau<strong>la</strong> 5.5.3.6) fet amb el programa informàtic Microsoft Excel.
- Page 1 and 2:
UNIVERSITAT DE LLEIDA Escola Tècni
- Page 3 and 4:
3.2 Objectius .....................
- Page 5 and 6:
5.5.6 Discussió de la relació de
- Page 7 and 8:
1. INTRODUCCIÓ 1.1 Pròleg De l’
- Page 9 and 10:
Pel que fa la evolució de producci
- Page 11 and 12:
Cal destacar que amb el terme prés
- Page 13 and 14:
2. ANTECEDENTS 2.1 Introducció 6 A
- Page 15 and 16:
8 Antecedents DeJong et al., 1989).
- Page 17 and 18: 10 Antecedents en l’embrió, pode
- Page 19 and 20: Mètodes d’anàlisi de sucres 12
- Page 21 and 22: 2.2.2 Mesures no destructives 14 An
- Page 23 and 24: 2.3.2 Creixement en doble sigmoide
- Page 25 and 26: 18 Antecedents través del diàmetr
- Page 27 and 28: 20 Antecedents la distribució dels
- Page 29 and 30: 3. FINALITAT I OBJECTIUS 3.1 Finali
- Page 31 and 32: 4. MATERIAL I MÈTODES 4.1 Caracter
- Page 33 and 34: 24 Material i mètodes pot veure le
- Page 35 and 36: 26 Material i mètodes El fòsfor,
- Page 37 and 38: 28 Material i mètodes tracta d’u
- Page 39 and 40: 4.1.5.5 Aclarida L’aclarida es va
- Page 41 and 42: Taula 4.2.3.1: Secció de tronc del
- Page 43 and 44: 34 Material i mètodes fermesa fore
- Page 45 and 46: Producció 36 Material i mètodes P
- Page 47 and 48: Figura 4.4.2.3: Talls obtinguts un
- Page 49 and 50: Determinació de sucres i acidesa 4
- Page 51 and 52: 4.5 Estudi estadístic 42 Material
- Page 53 and 54: 5. RESULTATS I DISCUSSIÓ 5.1 Nomen
- Page 55 and 56: Taula 5.2.3.1: Nombre de fruits pre
- Page 57 and 58: PES [gr] 400 350 300 250 200 150 10
- Page 59 and 60: 5.5 Resultats de l’experiència 2
- Page 61 and 62: Calibre [mm] 90 80 70 60 50 40 30 2
- Page 63 and 64: Calibres [mm] 90 80 70 60 50 40 30
- Page 65 and 66: 5.5.3 Relació sucres - producció
- Page 67: Taula 5.5.3.3: Anàlisi de variànc
- Page 71 and 72: 5.5.5 Relació acidesa - producció
- Page 73 and 74: Taula 5.5.5.3: Anàlisi de variànc
- Page 75 and 76: Acidesa [g/l àcid màlic] 7,00 6,0
- Page 77 and 78: 5.5.7 Relació número de fruits -
- Page 79 and 80: Producció recollida [t/ha] 70,00 6
- Page 81 and 82: 5.5.9 Relació secció de tronc - d
- Page 83 and 84: Pes dels fruits [g] 300,00 250,00 2
- Page 85 and 86: 6. CONCLUSIONS ....................
- Page 87 and 88: 7. BIBLIOGRAFIA ...................
- Page 89 and 90: Chapman, G.W.; Hovart, R.J.; Forbus
- Page 91 and 92: Leopold, A.C.; Kriedemann, P.E. 197
- Page 93 and 94: Westwood, M.N. 1962. Seasonal chang
- Page 95 and 96: 8. ANNEXES 8.1 Plànol de localitza
- Page 97 and 98: 8.3 Recull de dades de mesures i an
- Page 99 and 100: nº fruit 8.4 Registre dels valors
- Page 101 and 102: 8,8 330 8 273,5 7,8 247,6 7,9 273,4
- Page 103 and 104: 7,55 226,4 7,85 254 8,1 275,6 7,7 2
- Page 105: Rank 1 Eqn 8001 potencial(a,b) r 2